Copyright
©The Author(s) 2019.
World J Stem Cells. Dec 26, 2019; 11(12): 1115-1129
Published online Dec 26, 2019. doi: 10.4252/wjsc.v11.i12.1115
Published online Dec 26, 2019. doi: 10.4252/wjsc.v11.i12.1115
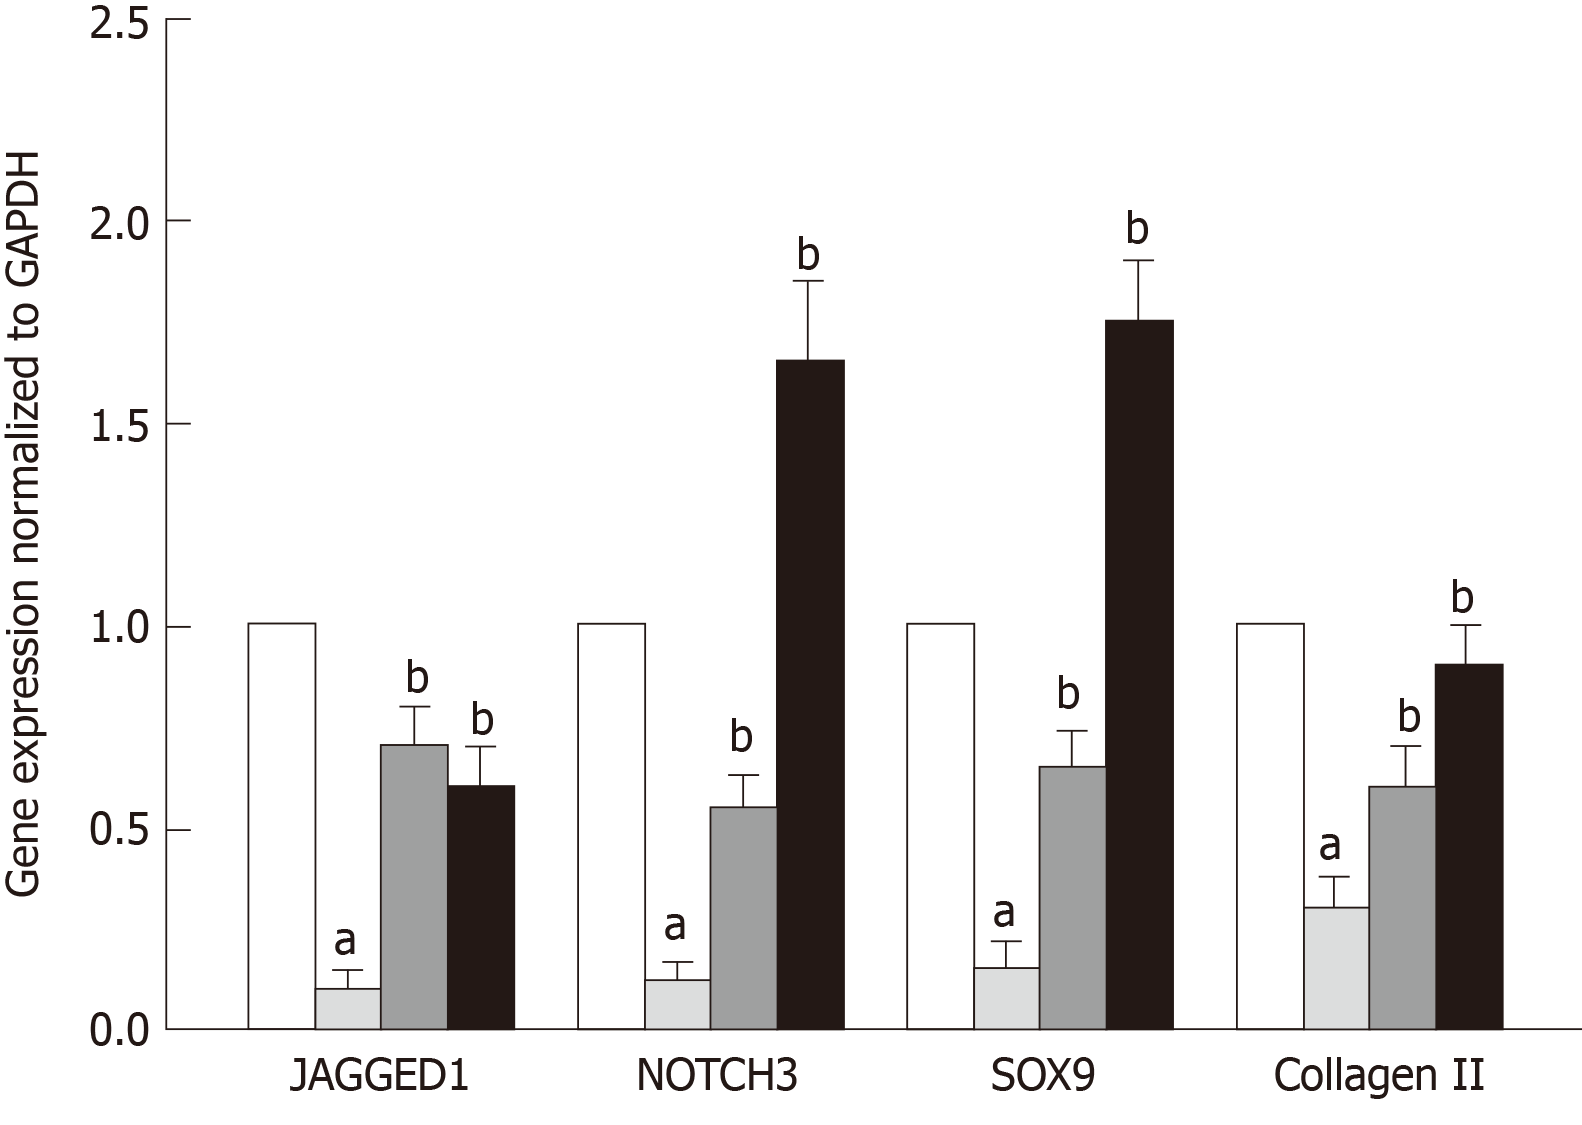
Figure 1 Expression of mRNA of NOTCH signaling and chondrogenic genes in pellet cultures.
White: Normal hADMSCs; Light grey: TSP2 siRNA-transfected hADMSCs; Dark gray: TSP2 siRNA-transfected hADMSCs + 10 ng/mL TSP2; Black: TSP2 siRNA-transfected hADMSCs + 100 ng/mL TSP2. aSignificantly different from normal hADMSCs, P < 0.05. bSignificantly different from TSP2 siRNA-transfected hADMSCs, P < 0.05. hADMSCs: Human adipose-derived mesenchymal stem cells; TSP2: Thrombospondin 2.
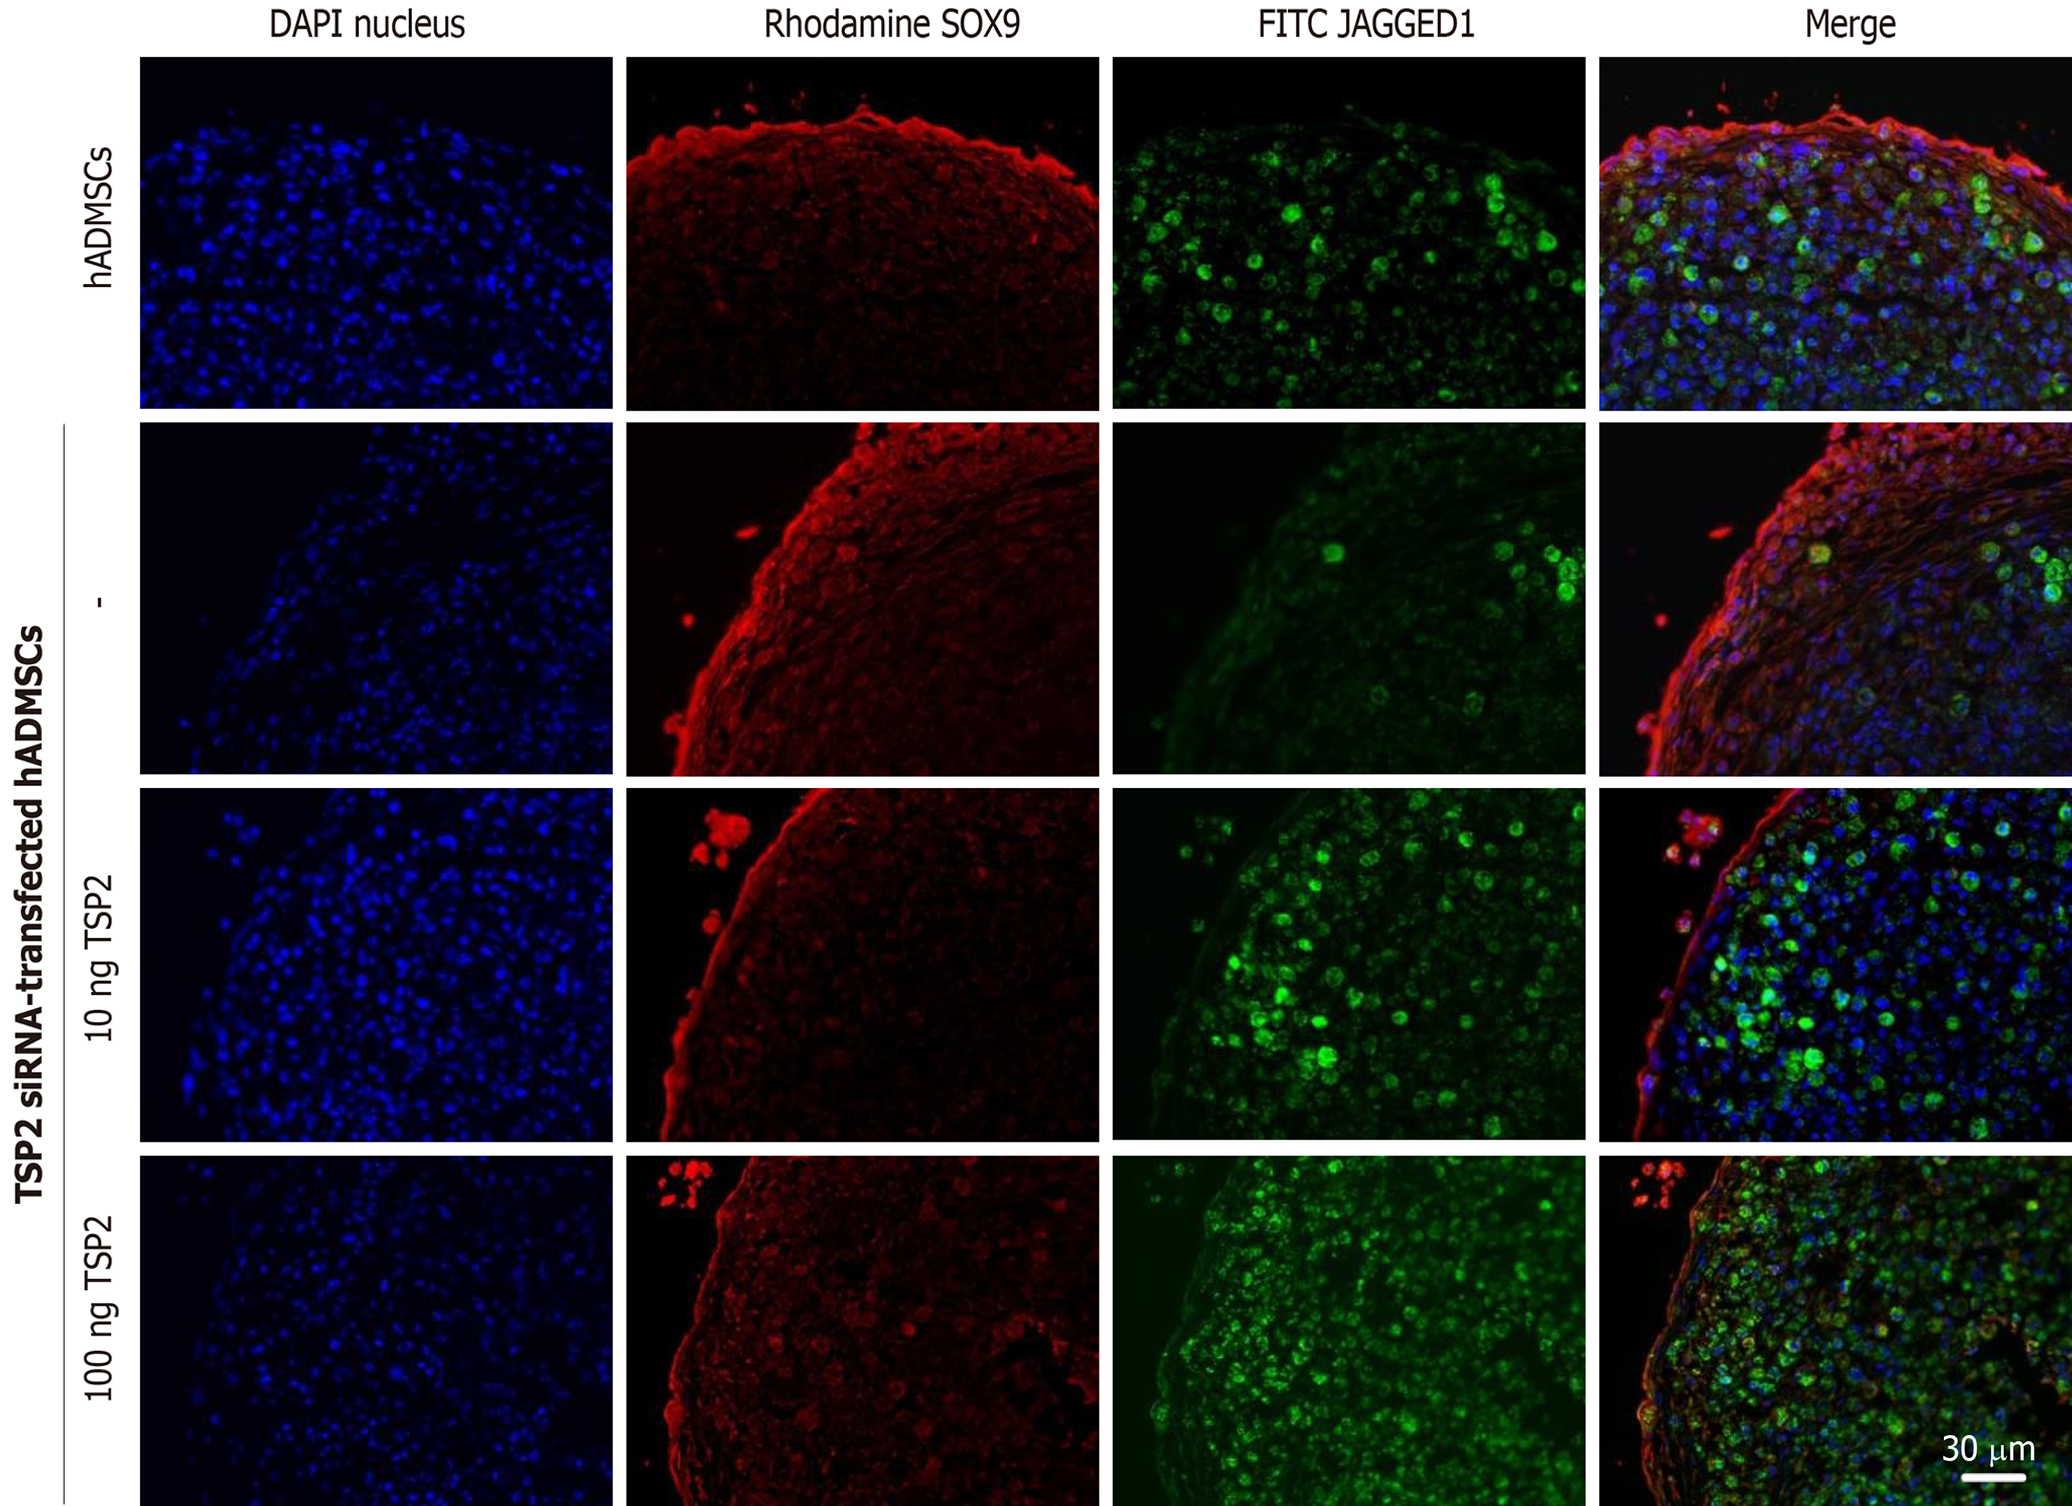
Figure 2 Production of SOX9 (chondrogenic transcription factor) and JAGGED1 (NOTCH ligand) proteins in normal hADMSCs and TSP2 siRNA-transfected hADMSCs treated with TSP2 (10 or 100 ng/mL).
hADMSCs: Human adipose-derived mesenchymal stem cells (200 ×); TSP2: Thrombospondin 2.
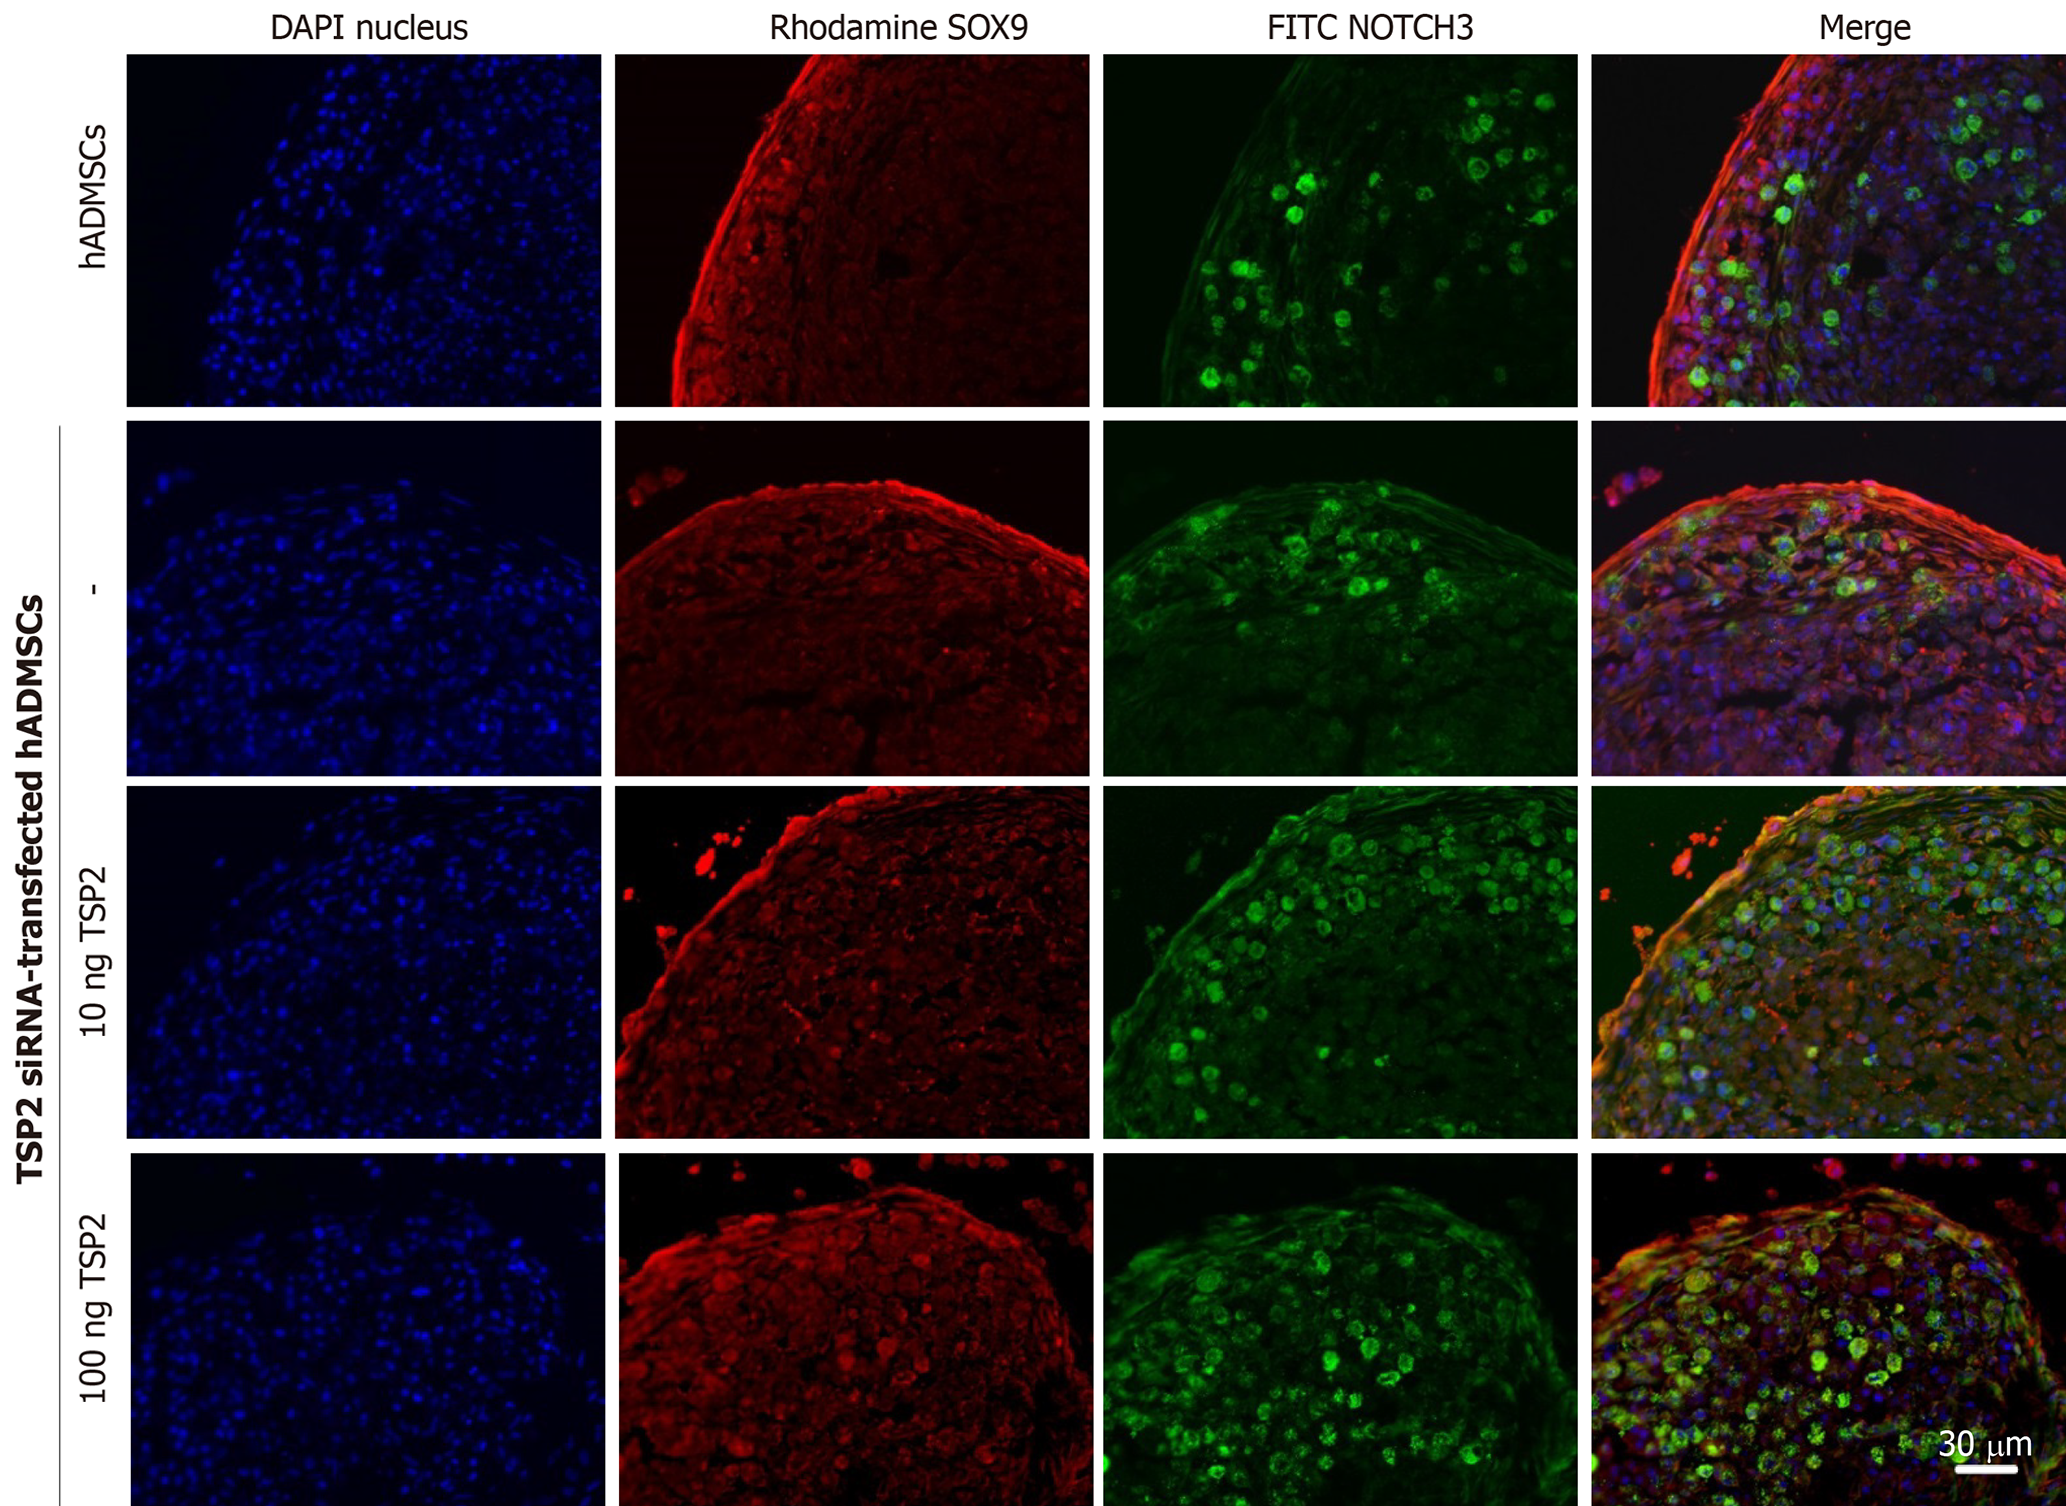
Figure 3 Production of SOX9 (chondrogenic transcription factor) and NOTCH3 (NOTCH receptor) proteins in normal hADMSCs and TSP2 siRNA-transfected hADMSCs treated with TSP2 (10 or 100 ng/mL).
hADMSCs: Human adipose-derived mesenchymal stem cells (200 ×); TSP2: Thrombospondin 2.
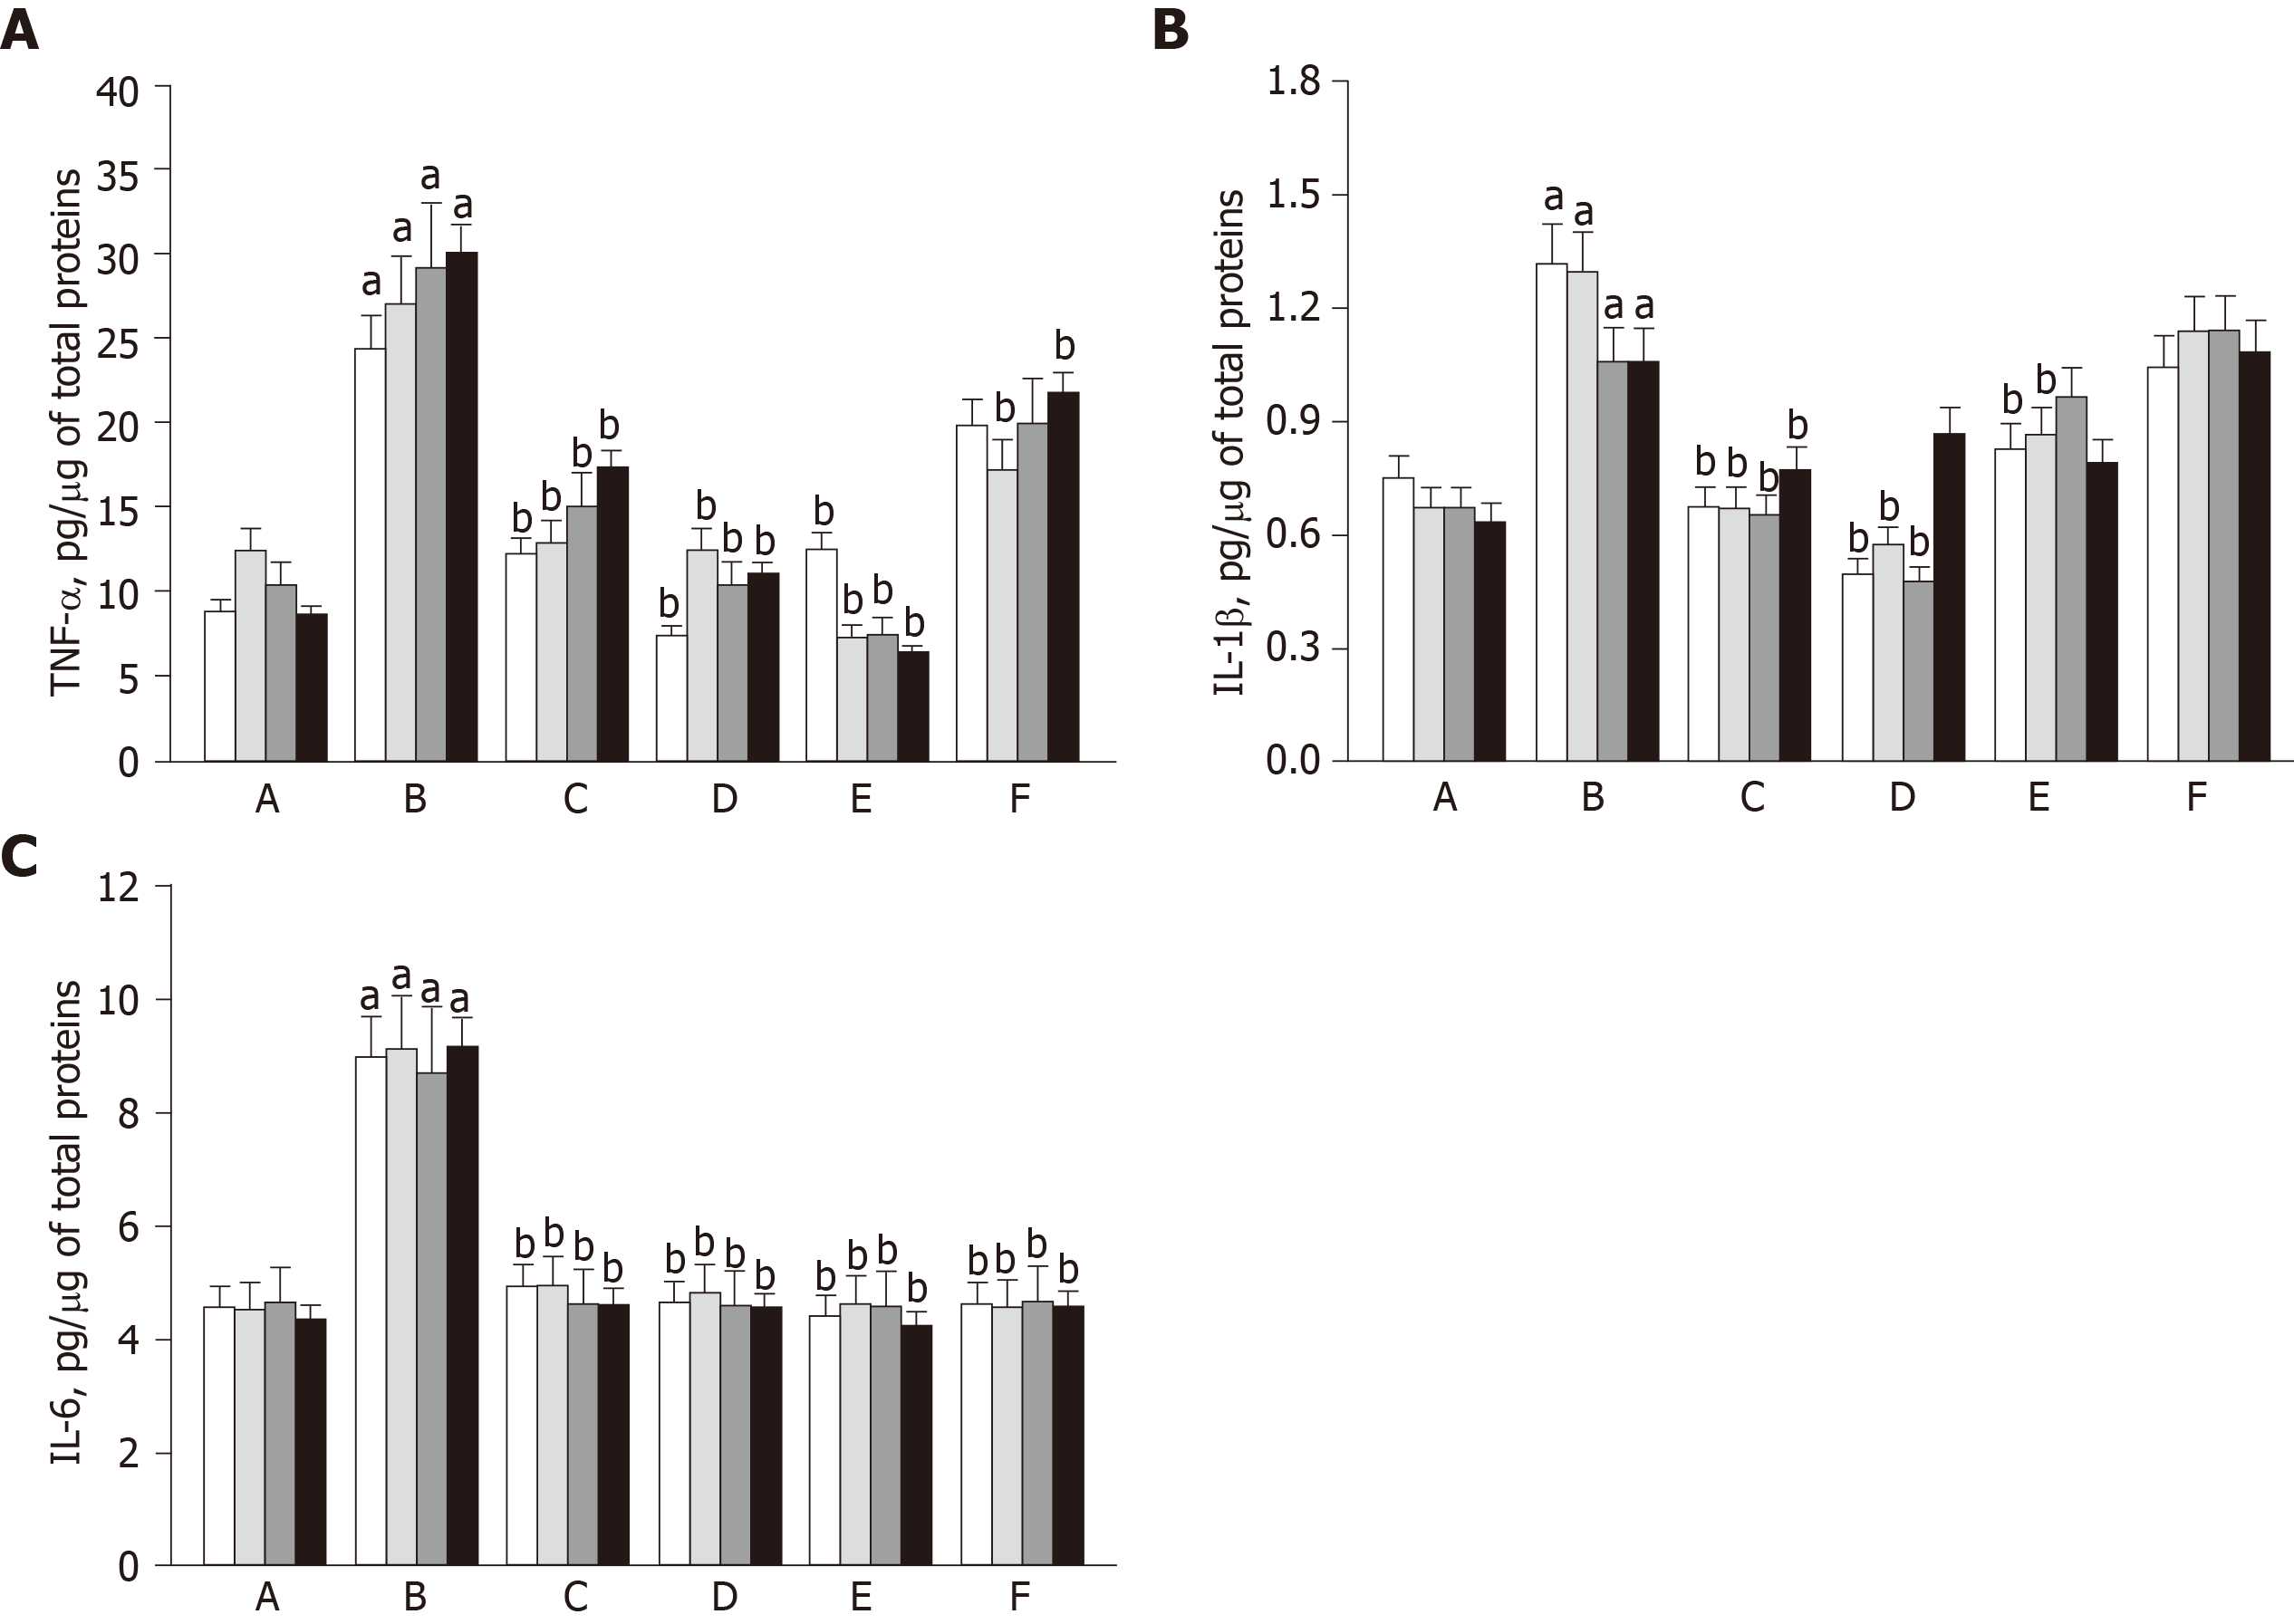
Figure 4 Concentration of pro-inflammatory cytokines in the synovial fluid 1 wk (white), 2 wk (light grey), 4 wk (dark gray), and 8 wk (black) after cell transplantation.
A: Sham control; B: ACLT alone; C: Low-dose (1.7 × 10⁶) hADMSCs; D: High-dose (1.7 × 10⁷) hADMSCs; E: Low-dose (1.7 × 10⁶) hADMSCs + TSP2 (100 ng); F: TSP2. aSignificantly different from sham control, P < 0.05. bSignificantly different from ACLT alone, P < 0.05. hADMSCs: Human adipose-derived mesenchymal stem cells; TSP2: Thrombospondin 2.
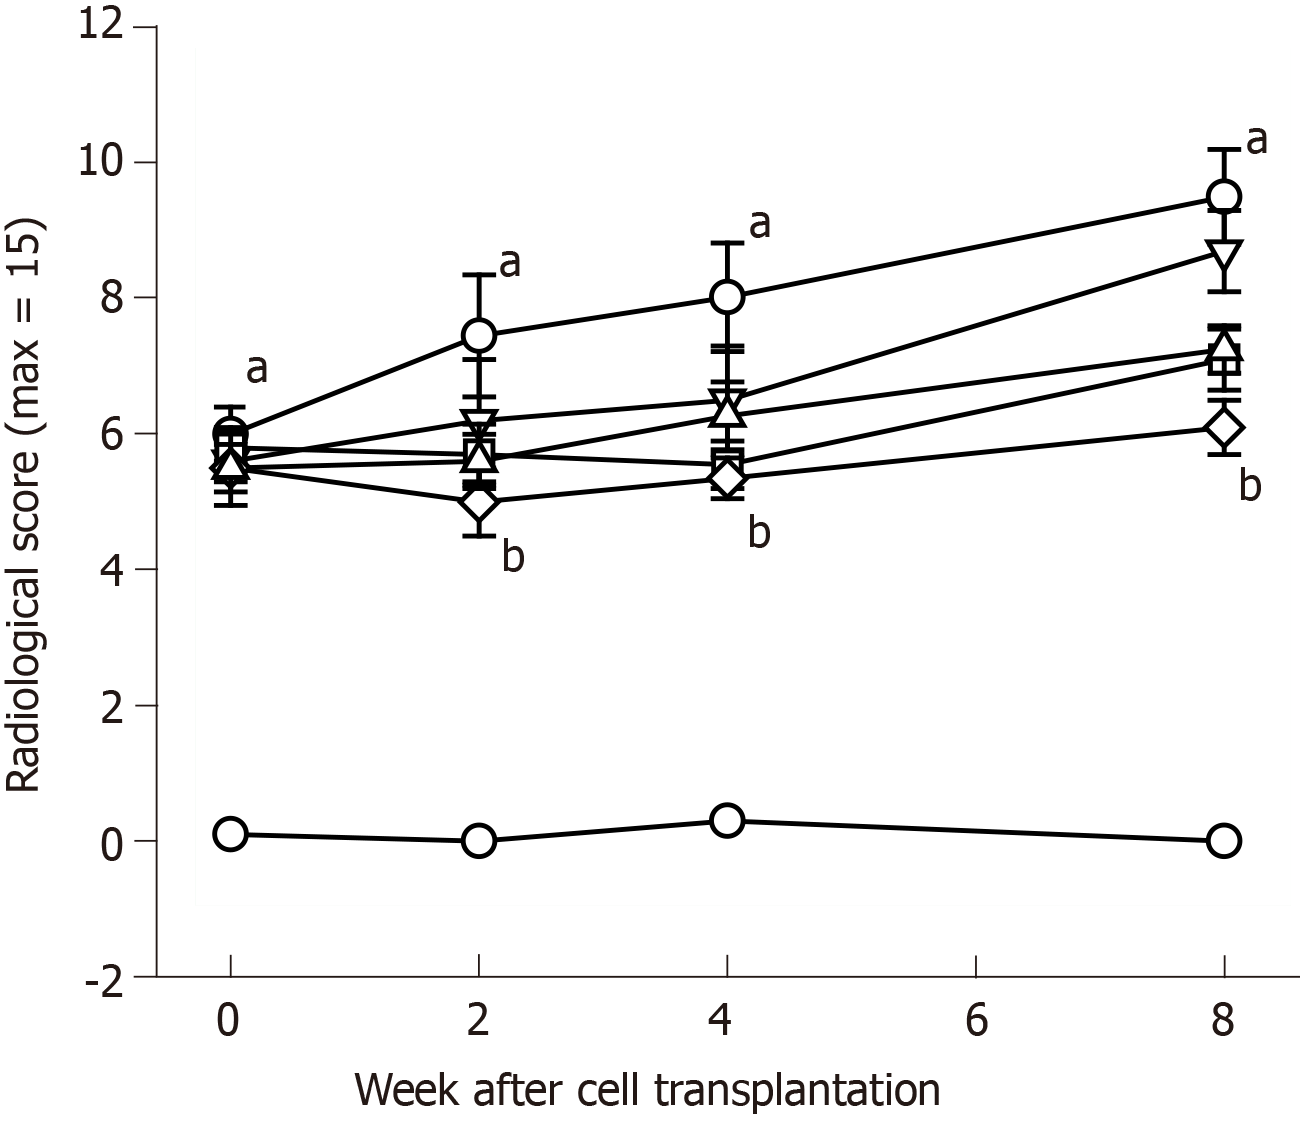
Figure 5 Time-course radiological evaluation on knee joints.
Open circle: Sham control; Filled circle: Anterior cruciate ligament transection alone; Inverted triangle: Low-dose (1.7 × 10⁶) hADMSCs; Square: High-dose (1.7 × 10⁷) hADMSCs; Lozenge: Low-dose (1.7 × 10⁶) hADMSCs + TSP2 (100 ng); Triangle: TSP2. aSignificantly different from sham control, P < 0.05. bSignificantly different from ACLT alone, P < 0.05. hADMSCs: Human adipose-derived mesenchymal stem cells; TSP2: Thrombospondin 2.
Figure 6 Representative radiological images 8 wk after cell transplantation.
A: Sham control; B: Anterior cruciate ligament transection alone; C: Low-dose (1.7 × 10⁶) hADMSCs; D: High-dose (1.7 × 10⁷) hADMSCs; E: Low-dose (1.7 × 10⁶) hADMSCs + TSP2 (100 ng); F: TSP2. Black arrowhead: Osteophytes in medial femoral condyle; White arrow: Deformity of medial tibia; White arrowhead: Sharpening of tibial spine. hADMSCs: Human adipose-derived mesenchymal stem cells; TSP2: Thrombospondin 2.
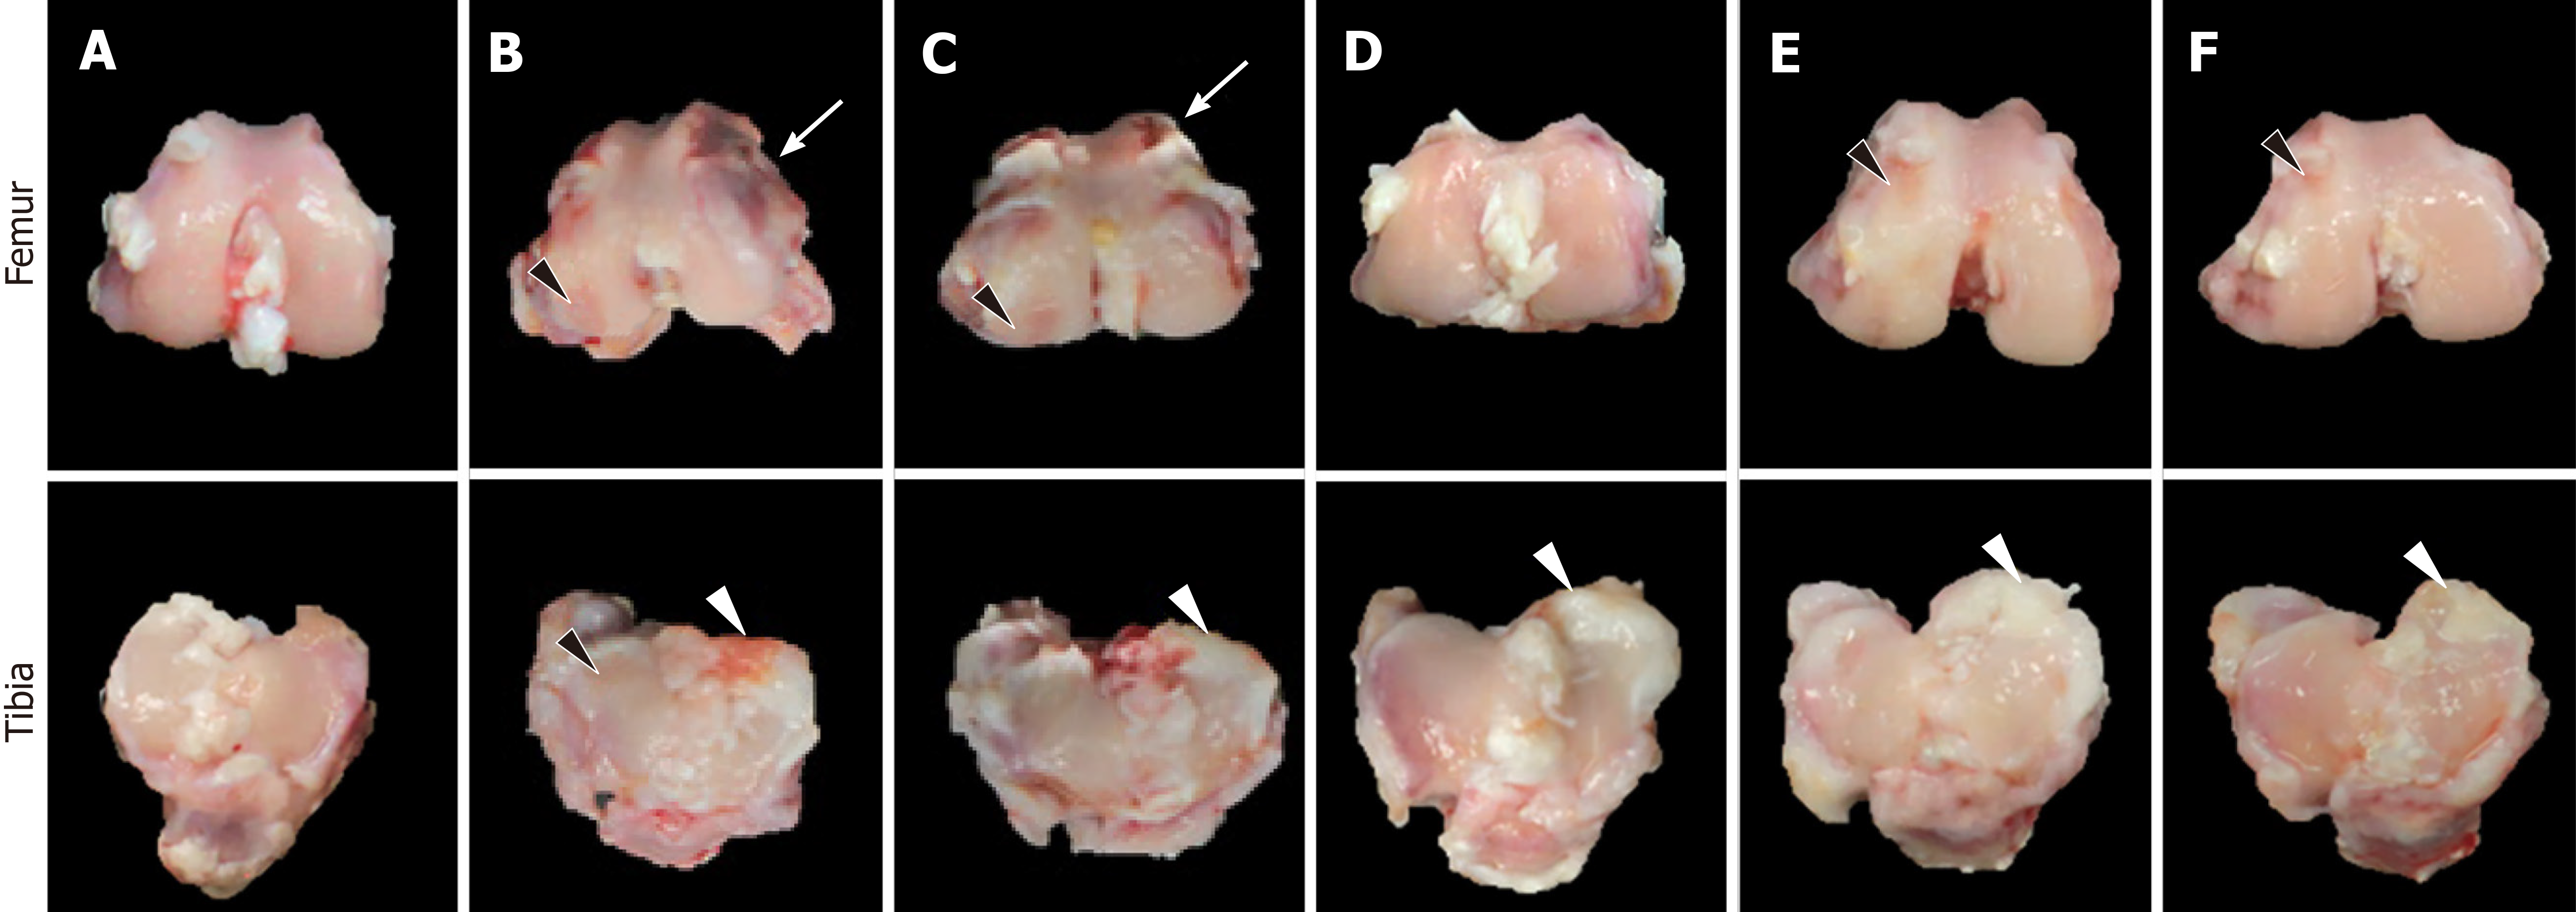
Figure 7 Representative gross findings.
A: Sham control; B: Anterior cruciate ligament transection alone; C: Low-dose (1.7 × 10⁶) hADMSCs; D: High-dose (1.7 × 10⁷) hADMSCs; E: Low-dose (1.7 × 10⁶) hADMSCs + TSP2 (100 ng); F: TSP2. Black arrowhead: Fissure and erosion; White arrowhead: Adhesion with meniscus; White arrow: Osteophyte. hADMSCs: Human adipose-derived mesenchymal stem cells; TSP2: Thrombospondin 2.
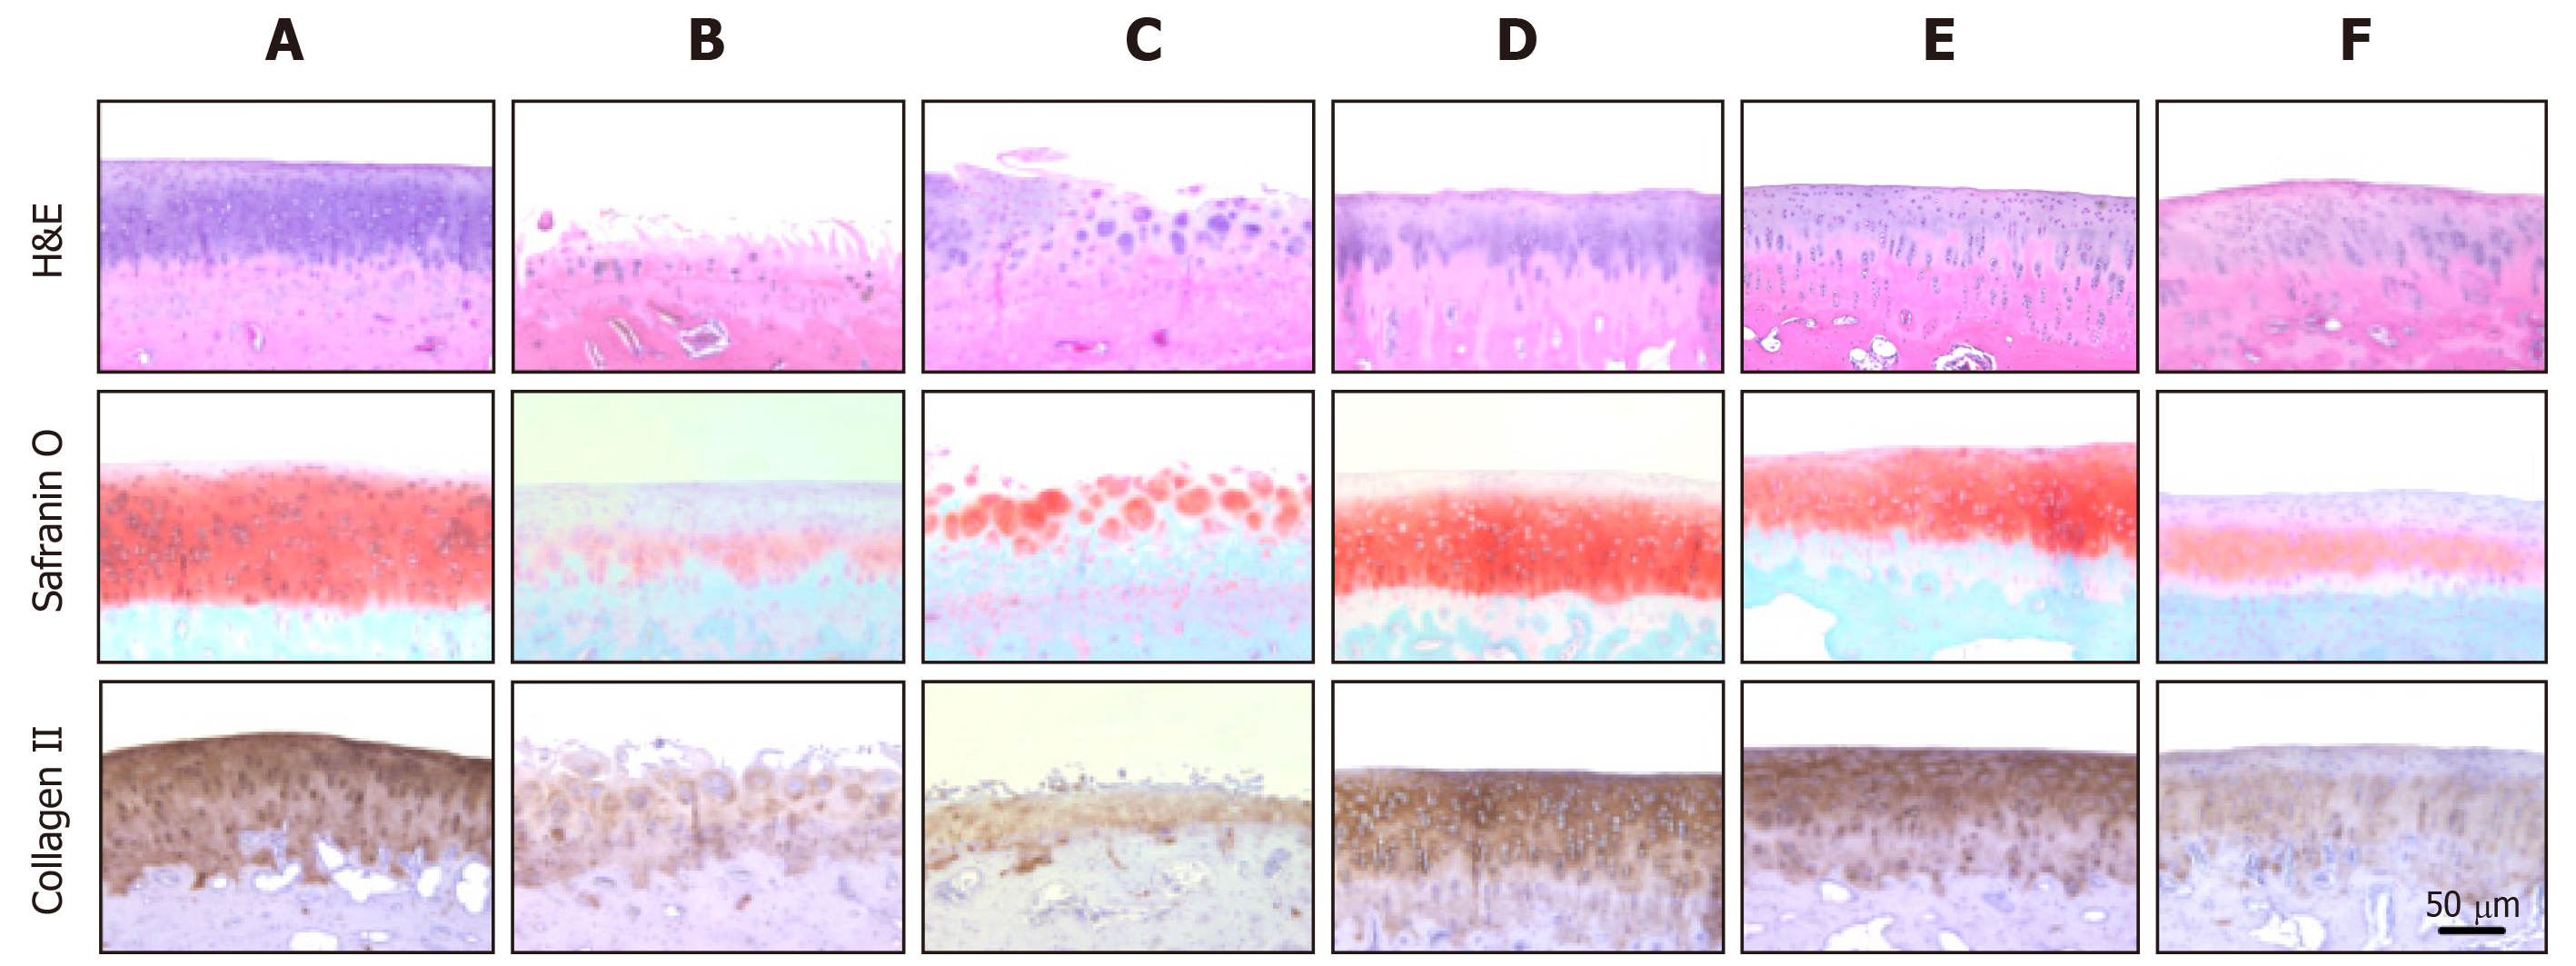
Figure 8 Representative microscopic images stained with H&E (for structure, chondrocyte density, and cluster formation), safranin O (for proteoglycan contents) or collagen II antibody (for extracellular matrix).
A: Sham control; B: ACLT alone; C: Low-dose (1.7 × 10⁶) hADMSCs; D: High-dose (1.7 × 10⁷) hADMSCs; E: Low-dose (1.7 × 10⁶) hADMSCs + TSP2 (100 ng); F: TSP2 (100×). hADMSCs: Human adipose-derived mesenchymal stem cells; TSP2: Thrombospondin 2.
- Citation: Shin K, Cha Y, Ban YH, Seo DW, Choi EK, Park D, Kang SK, Ra JC, Kim YB. Anti-osteoarthritis effect of a combination treatment with human adipose tissue-derived mesenchymal stem cells and thrombospondin 2 in rabbits. World J Stem Cells 2019; 11(12): 1115-1129
- URL: https://www.wjgnet.com/1948-0210/full/v11/i12/1115.htm
- DOI: https://dx.doi.org/10.4252/wjsc.v11.i12.1115


