Copyright
©The Author(s) 2019.
World J Stem Cells. Nov 26, 2019; 11(11): 904-919
Published online Nov 26, 2019. doi: 10.4252/wjsc.v11.i11.904
Published online Nov 26, 2019. doi: 10.4252/wjsc.v11.i11.904
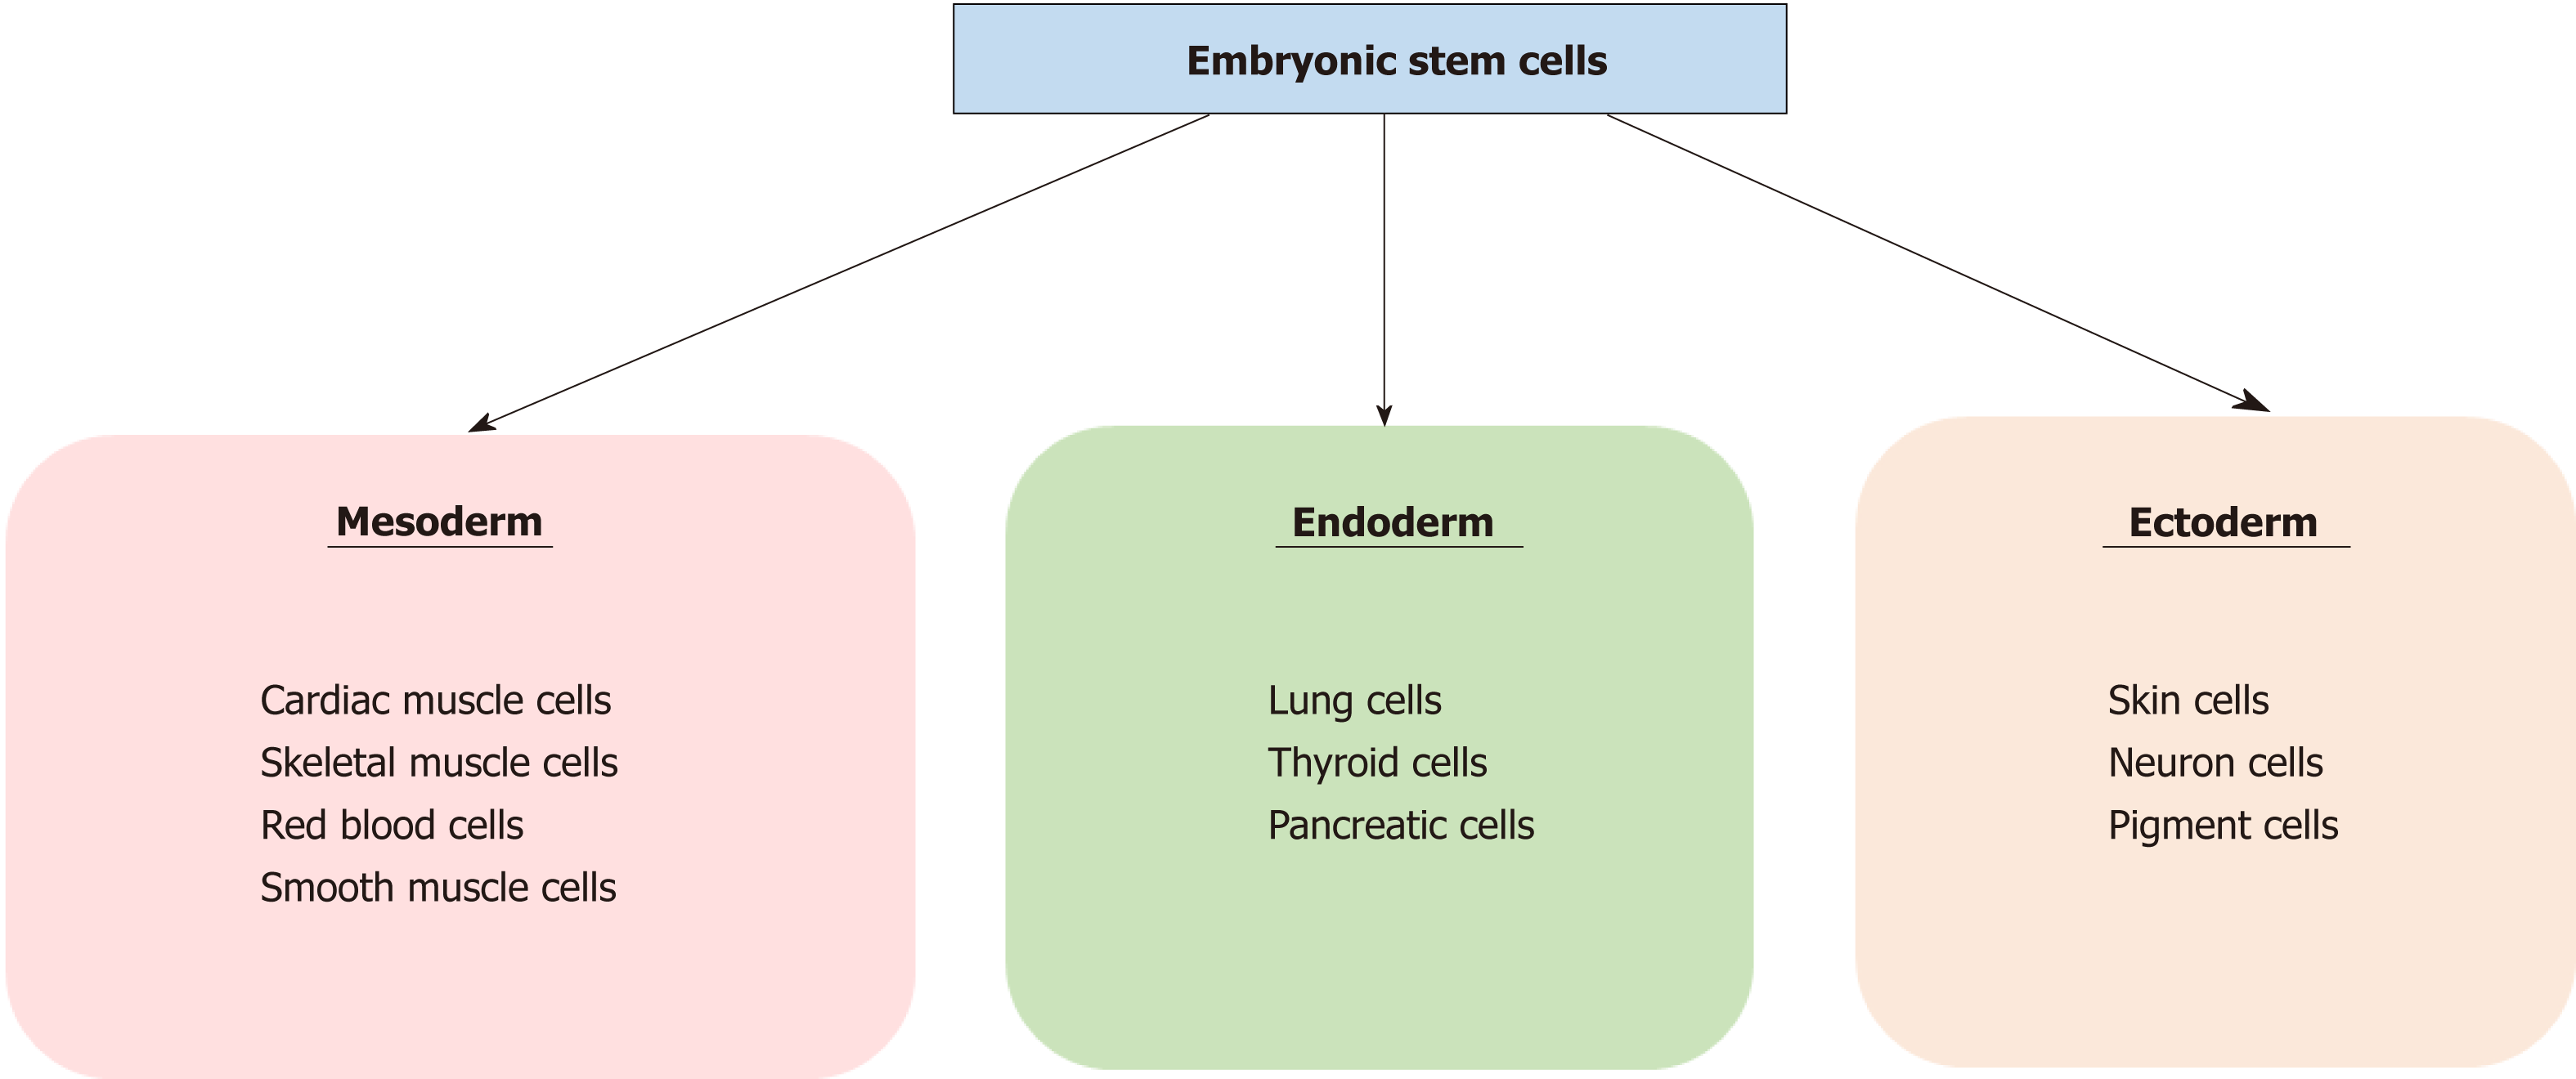
Figure 1 Diagram of the three human germ layers and lineage fates.
This diagram shows the different organs’ fate according to their original germ layer.
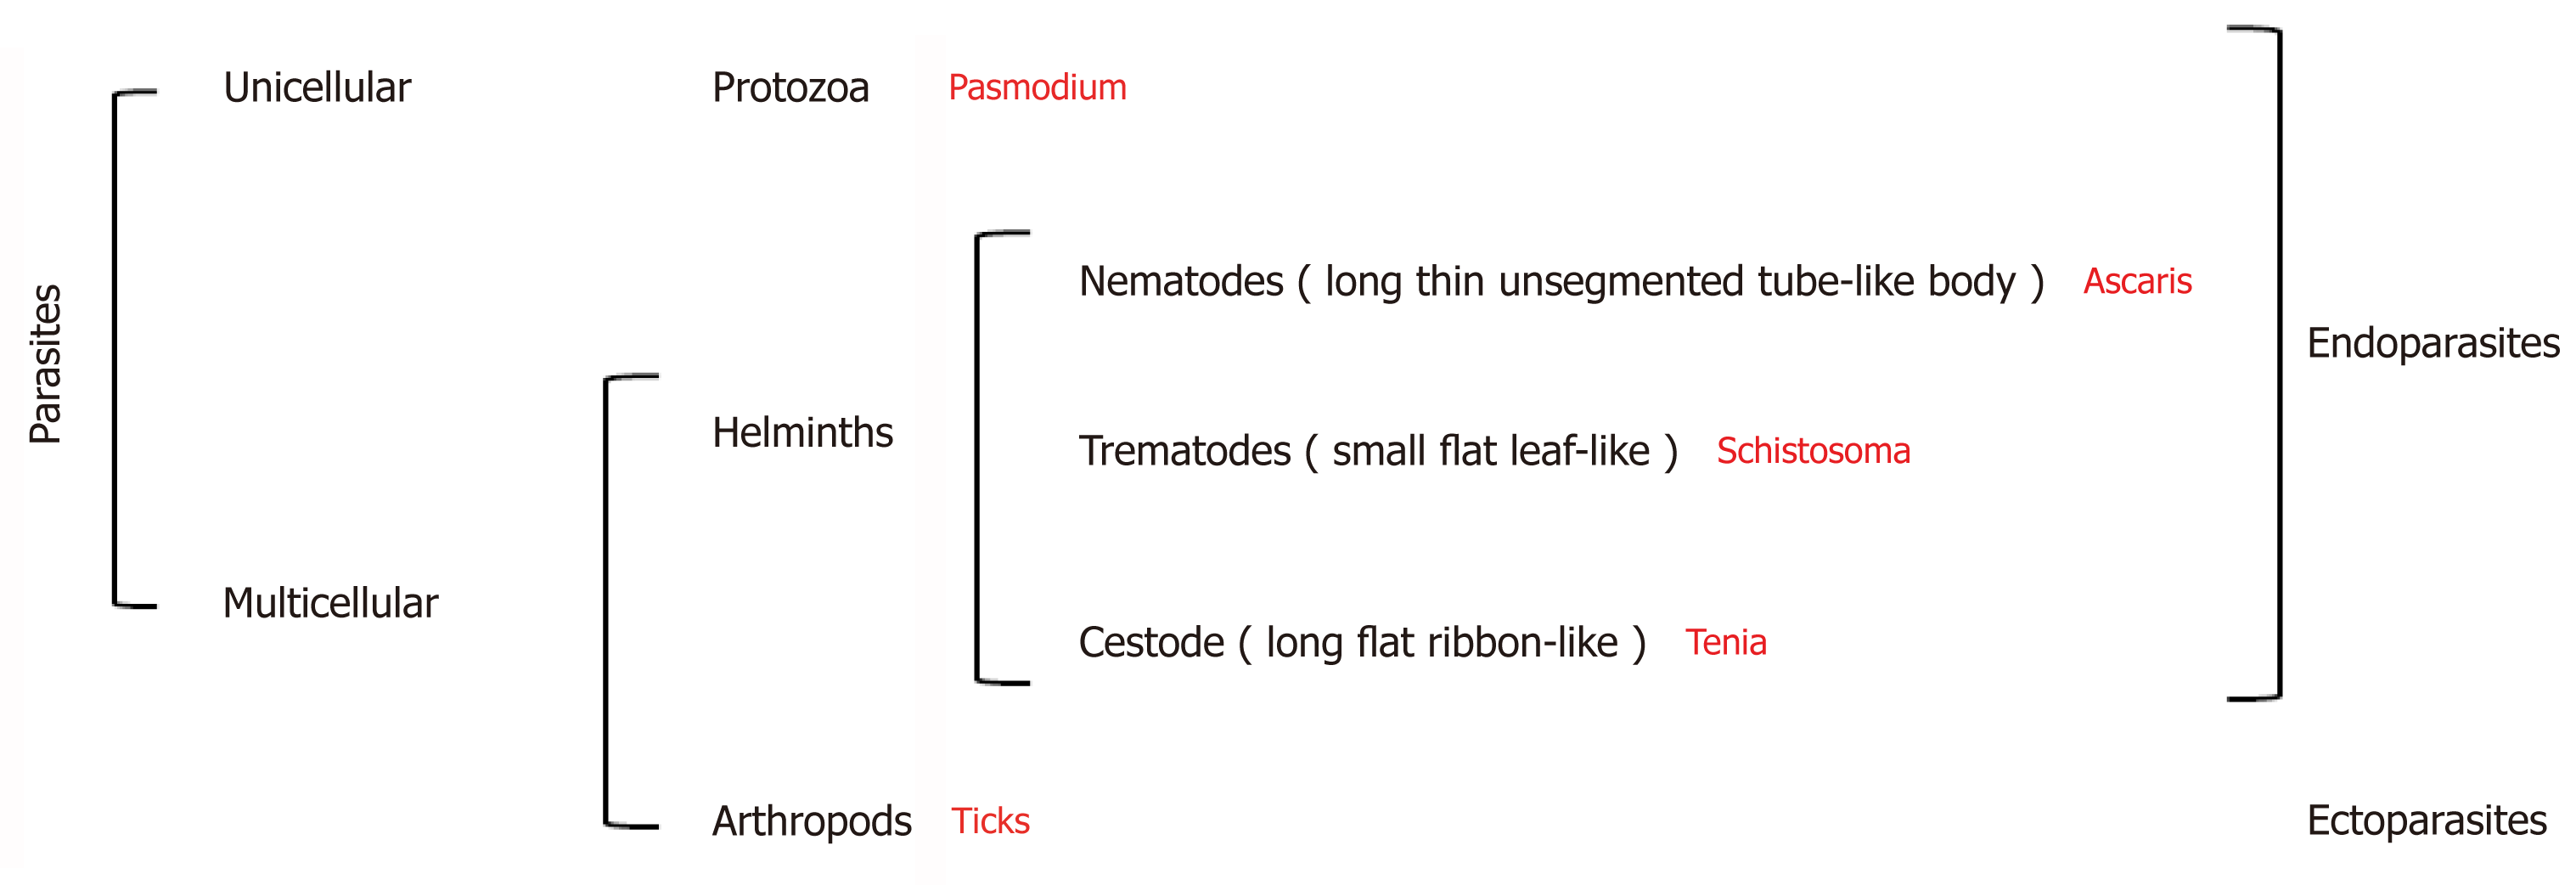
Figure 2 Diagram of parasite classification.
Parasite classification is based on their cellular properties. Some species examples are provided.
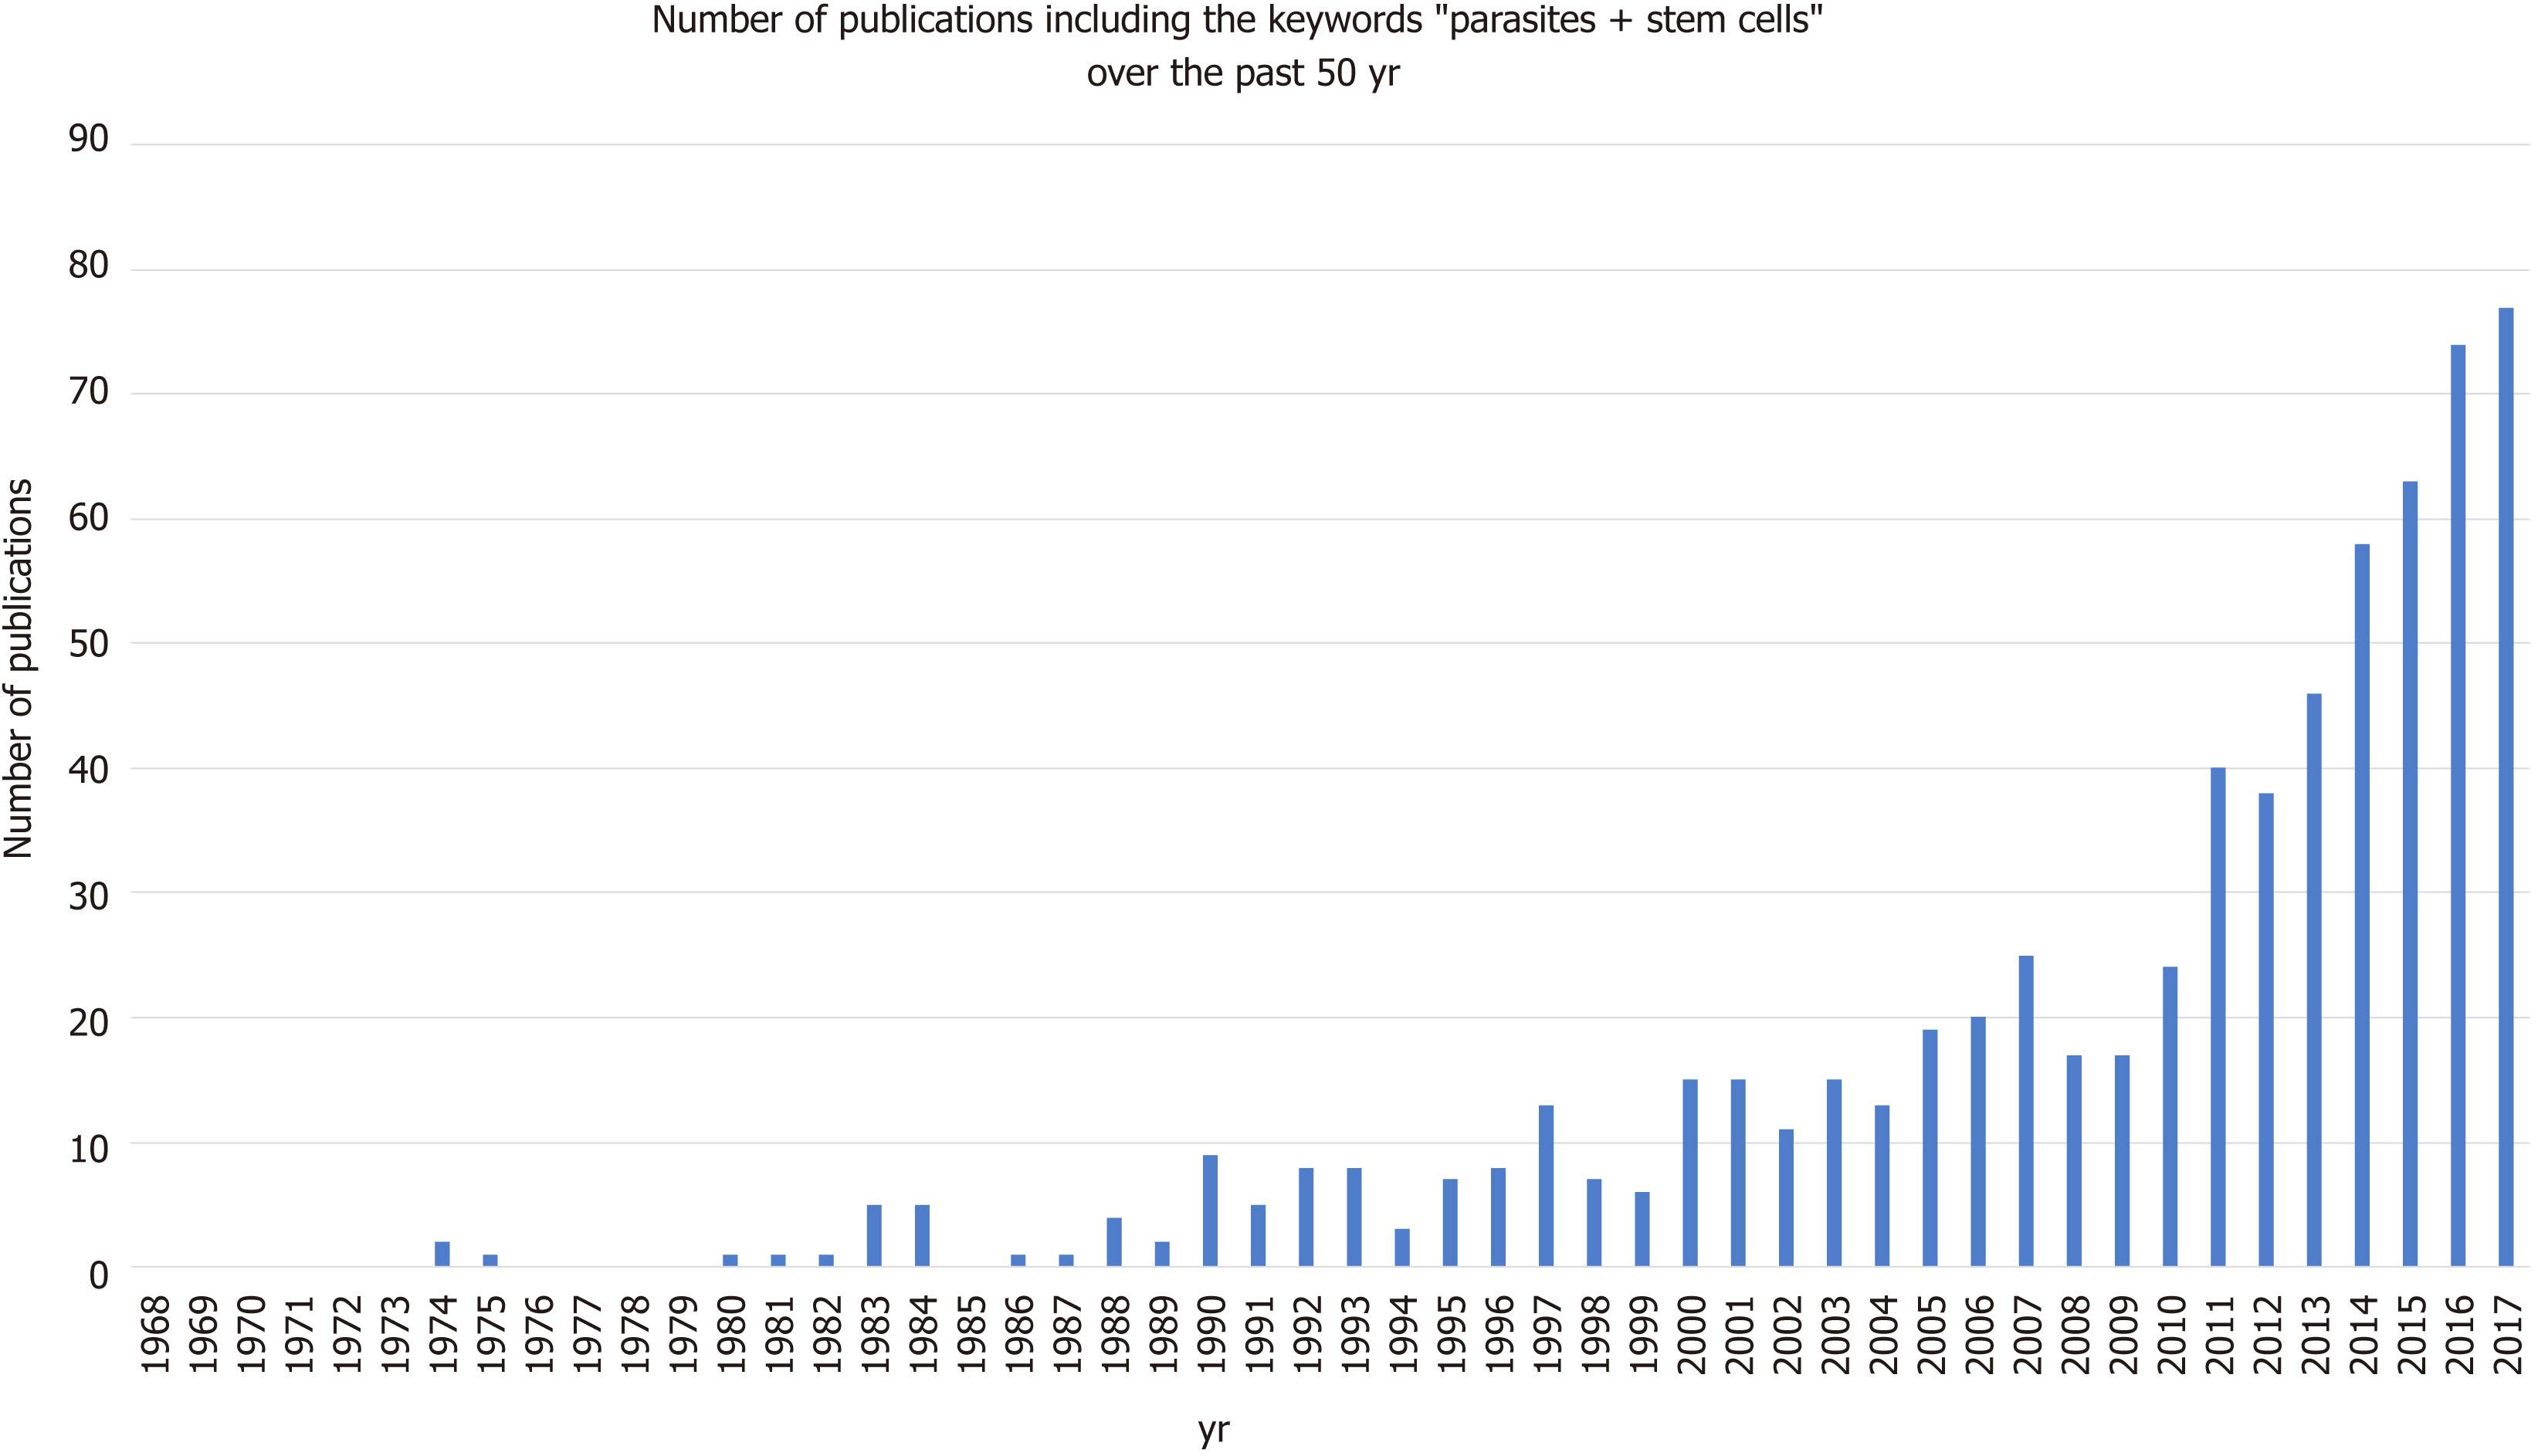
Figure 3 Chart of the yearly number of scientific literature publications including the keywords “stem cells + parasites” over the last 50 years.
This diagram shows the numbers corresponding to scientific literature on PubMed found using the inclusive keywords “stem cells” and “parasites”.
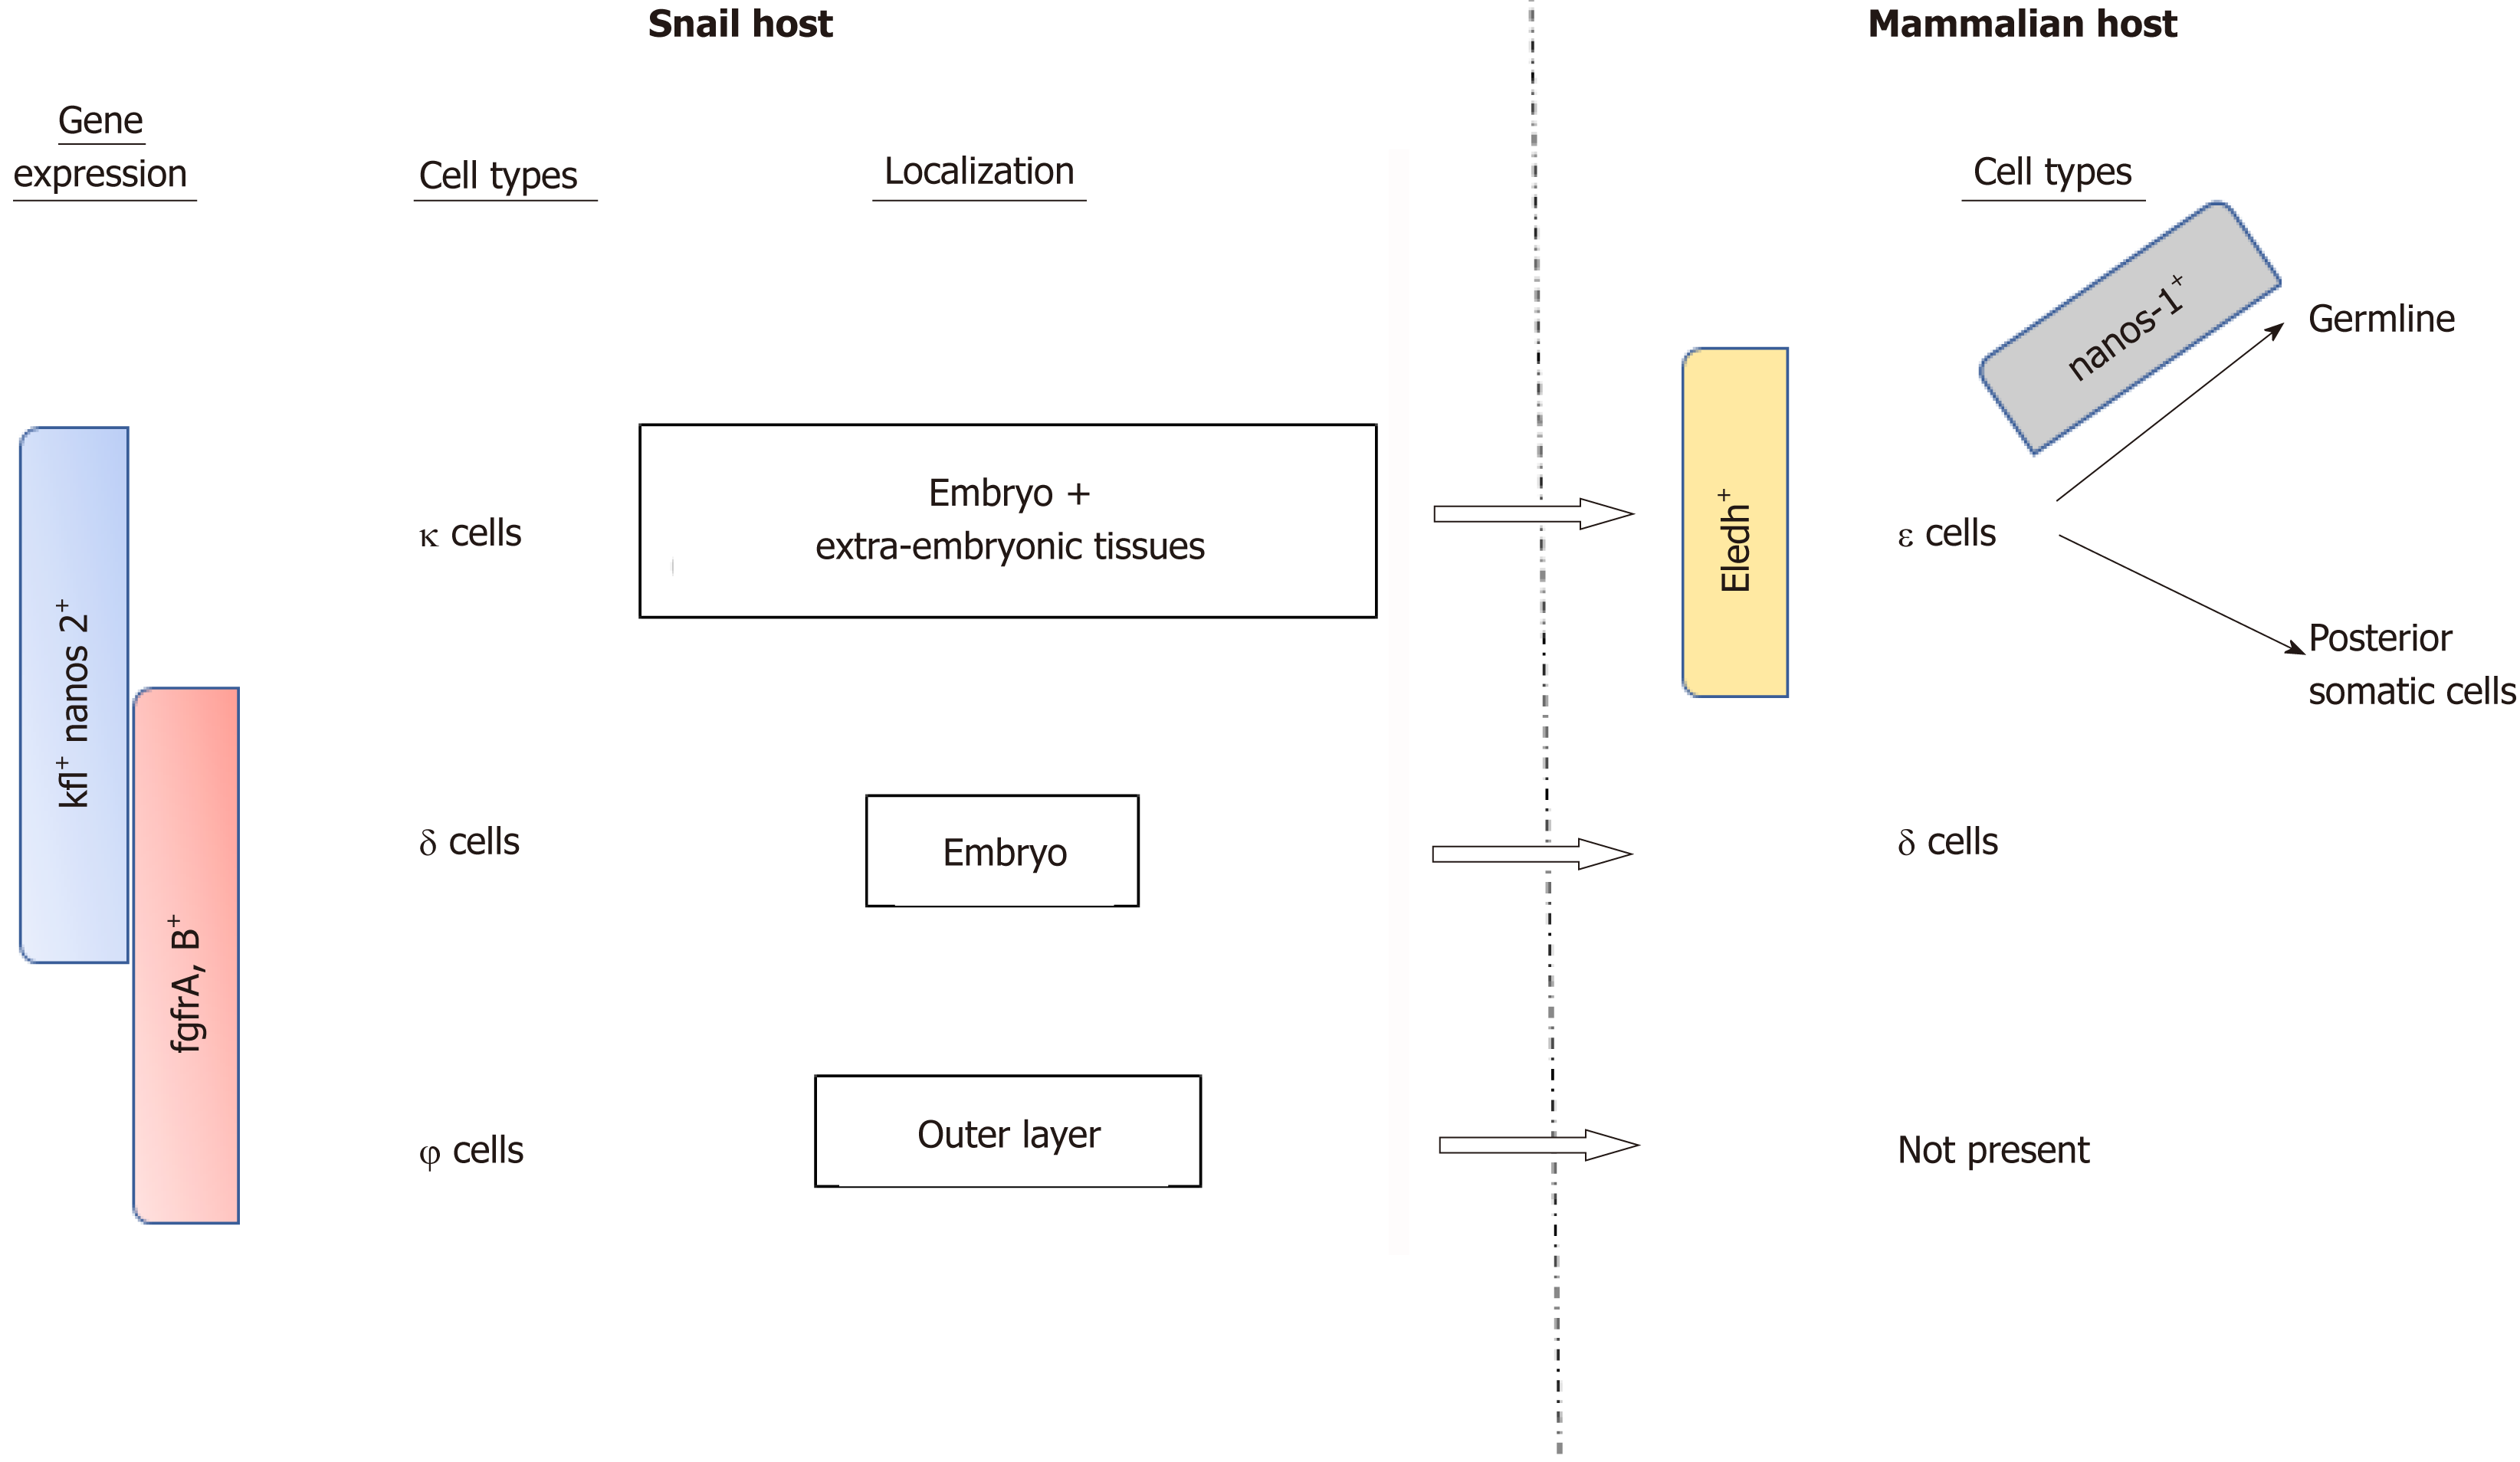
Figure 4 Gene expression and localisation of the different S mansoni stem cell populations in the two main hosts.
This diagram explains the different subpopulations of S. mansoni stem cells based on specific gene expression and localisation.
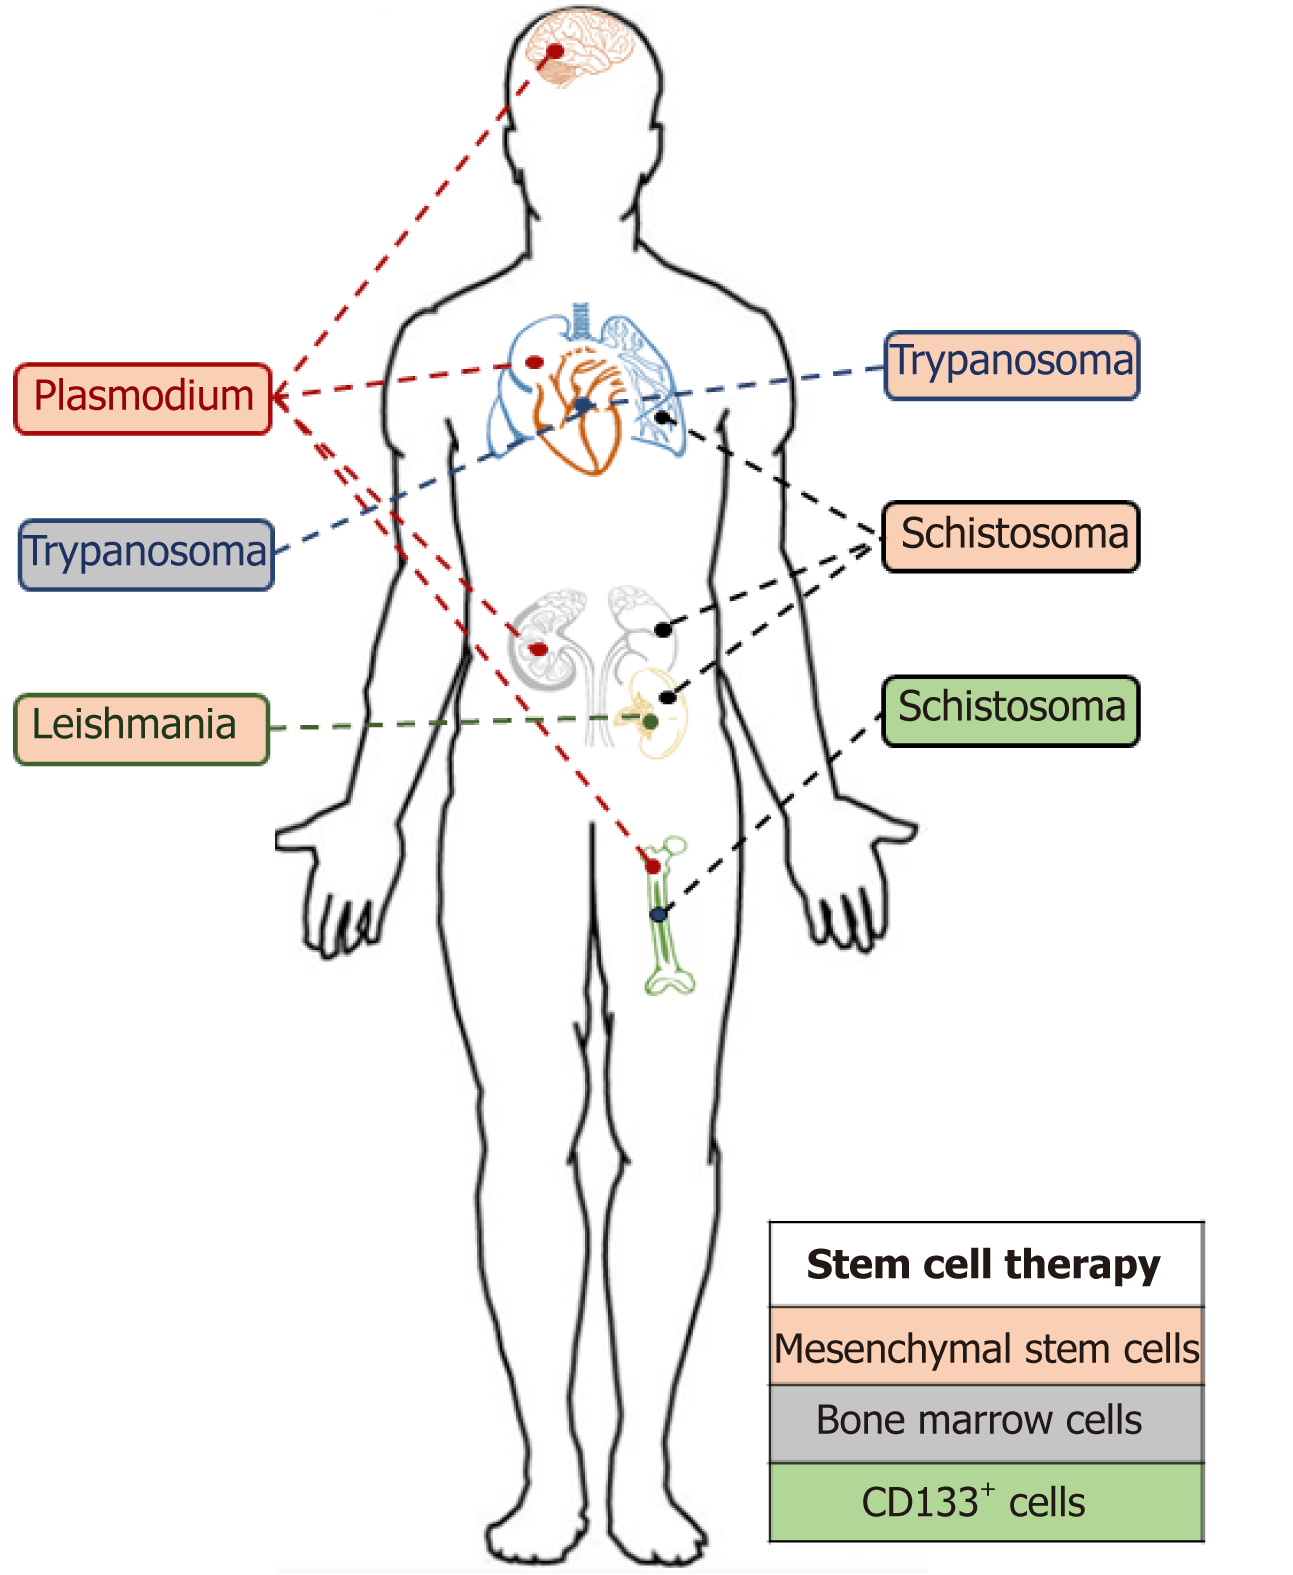
Figure 5 Parasitic infections and stem cell therapies targeting different organs.
This diagram shows the different stem cell therapies used for different parasite infections and the targeted organs.
- Citation: Matthews H, Noulin F. Unexpected encounter of the parasitic kind. World J Stem Cells 2019; 11(11): 904-919
- URL: https://www.wjgnet.com/1948-0210/full/v11/i11/904.htm
- DOI: https://dx.doi.org/10.4252/wjsc.v11.i11.904


