Copyright
©The Author(s) 2019.
World J Stem Cells. Jan 26, 2019; 11(1): 44-54
Published online Jan 26, 2019. doi: 10.4252/wjsc.v11.i1.44
Published online Jan 26, 2019. doi: 10.4252/wjsc.v11.i1.44
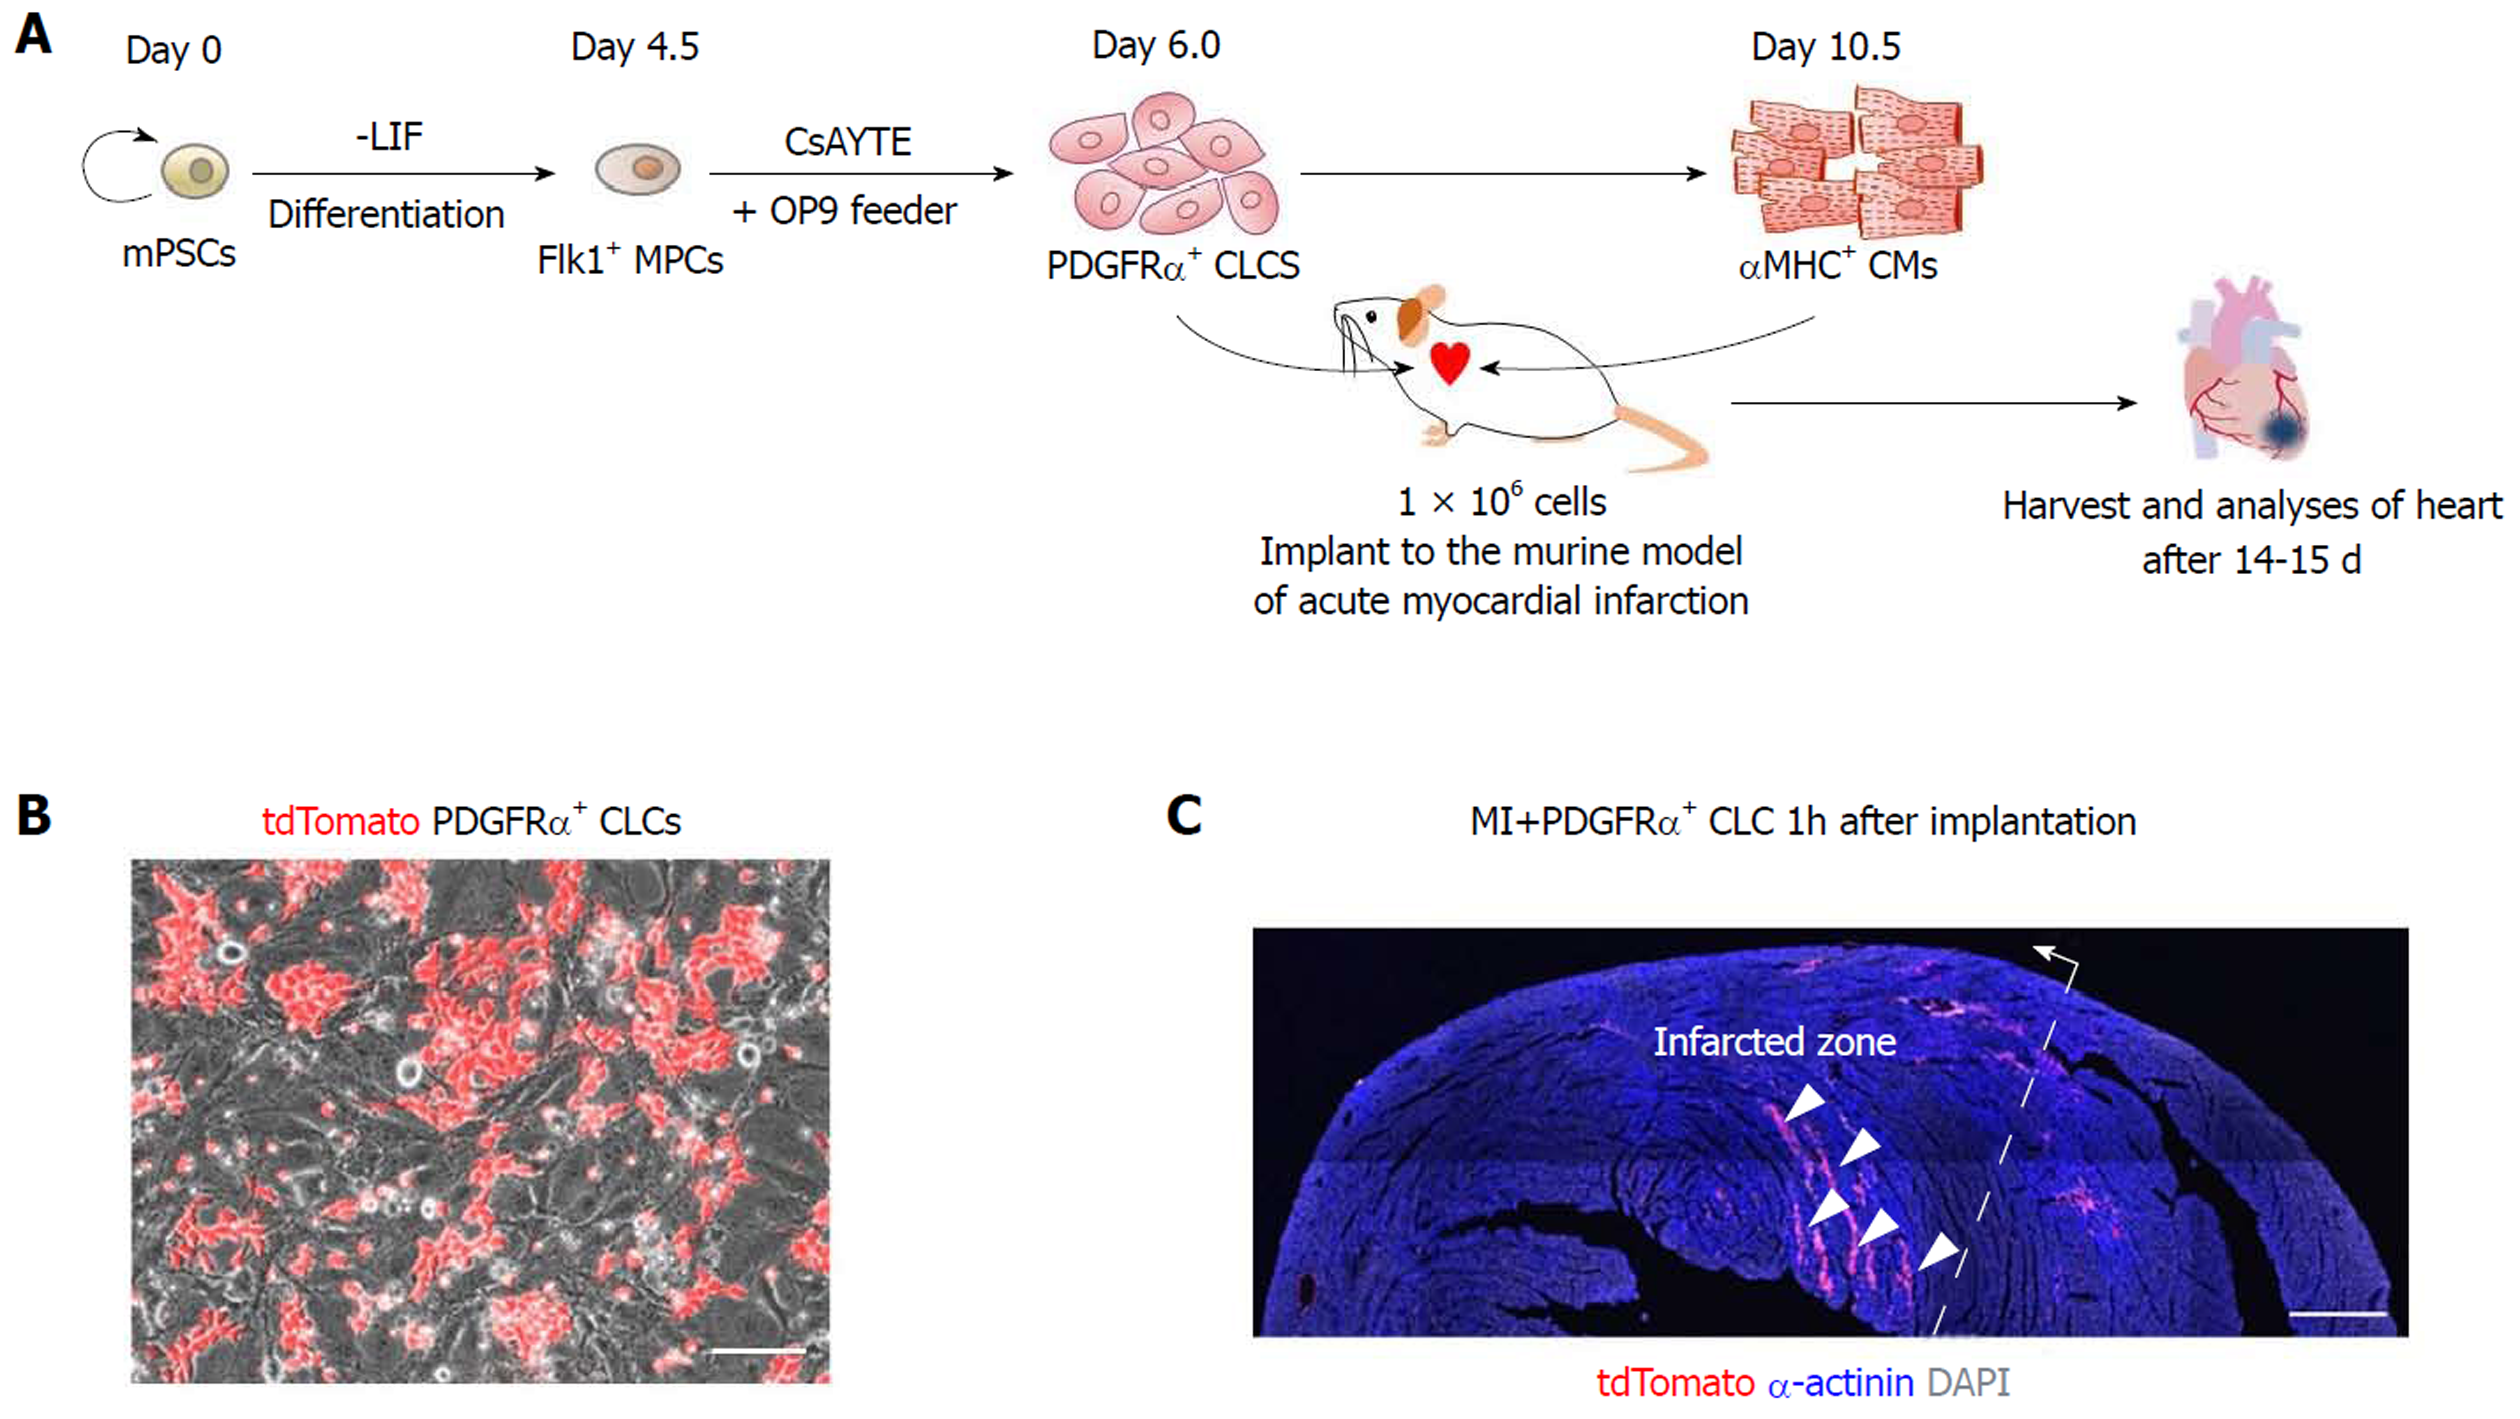
Figure 1 Implantations of platelet-derived growth factor receptor-α+ cardiac lineage-committed cells and αMHC+ cardiomyocytes in the acute myocardial infarction murine model.
A: Experimental scheme of implanting either platelet-derived growth factor receptor-α (PDGFRα)+ cardiac lineage-committed cells (CLCs) or αMHC+ cardiomyocytes (CMs) into acute myocardial infarction (MI) murine model. Analyses were performed at 2 wk after implantation of approximately 1 × 10⁶ cells of PDGFRα+ CLCs or αMHC+ CMs into the left ventricular myocardium of acute MI murine model; B: Live cell image showing tdTomato+ cells during induction of PDGFRα+ CLCs from embryonic stem cells. Scale bars, 100 μm; C: Representative confocal image showing implanted tdTomato+ PDGFRα+ CLCs in the myocardial spaces (arrowheads) of the infarcted zone (dotted line and arrow), which was formed by ligation of coronary artery 1 h prior to the implantation. Scale bar, 500 μm. CLCs: Cardiac lineage-committed cells; CMs: Cardiomyocytes; PSCs: Pluripotent stem cells; ESCs: Embryonic stem cells; LIF: Leukemia inhibitory factor.
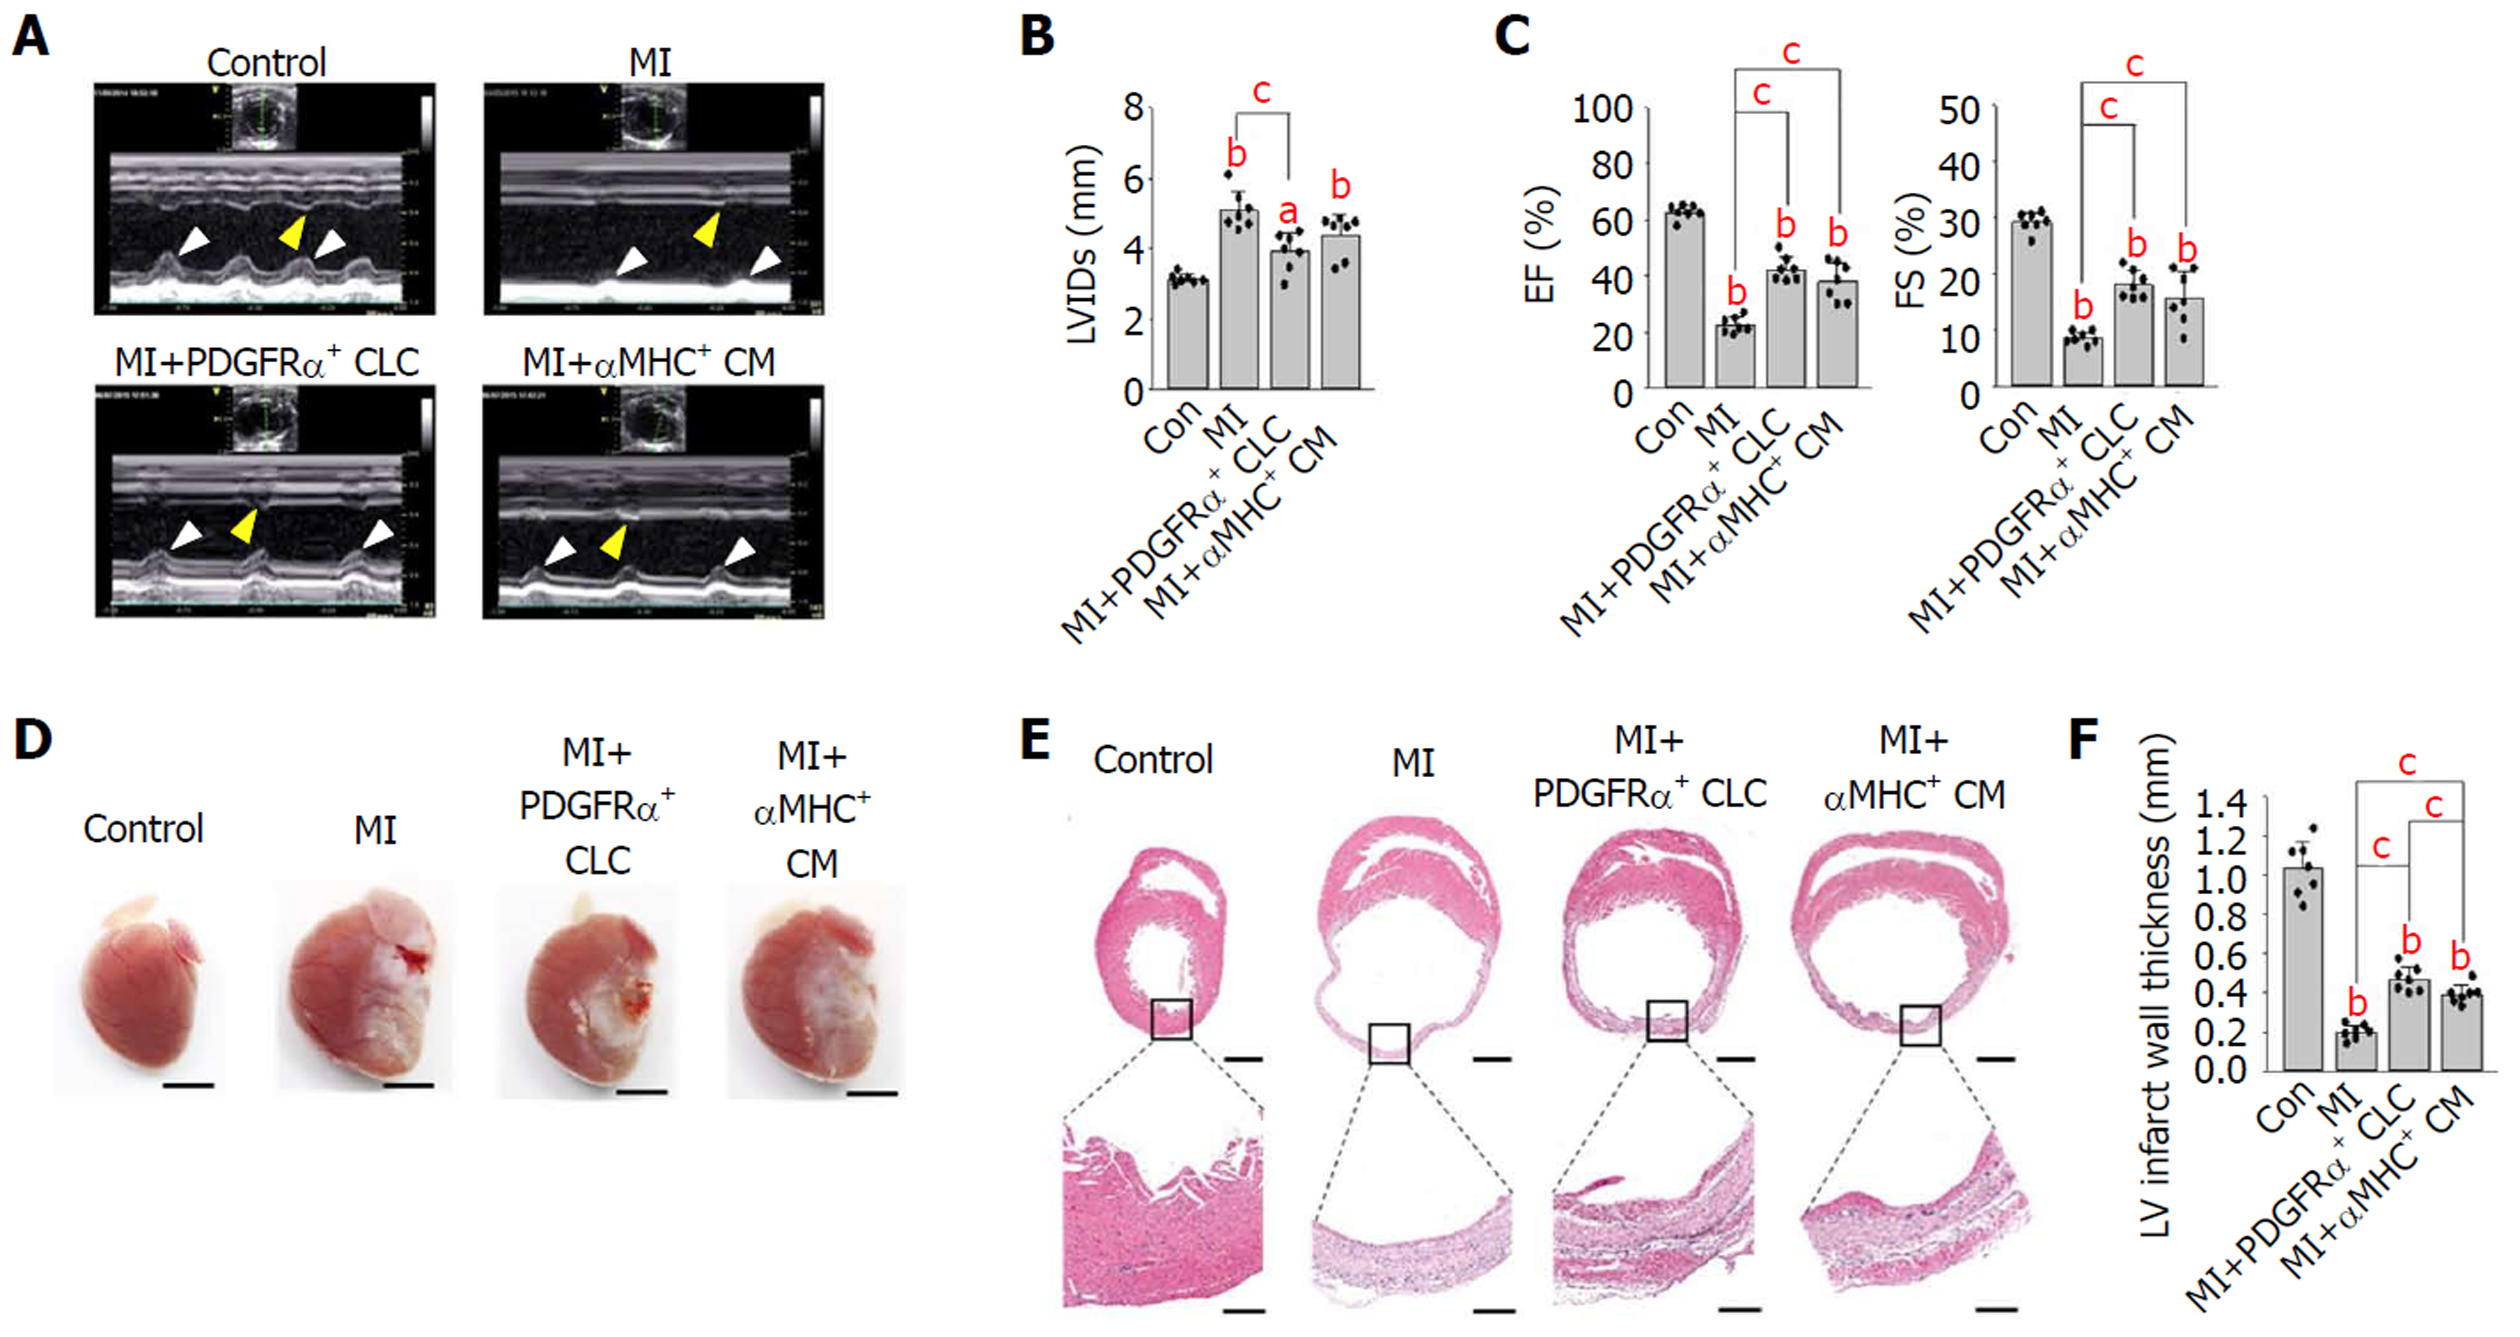
Figure 2 Implantations of platelet-derived growth factor receptor-α+ cardiac lineage-committed cells and αMHC+ cardiomyocytes equally improves contractile function and structure in the infarcted heart.
A: Representative M-mode transthoracic echocardiography views of control, myocardial infarction (MI), MI+ platelet-derived growth factor receptor-α (PDGFRα)+ cardiac lineage-committed cells (CLCs), and MI+αMHC+ cardiomyocytes (CMs). Improved anterior (white arrowheads) and septal (yellow arrowheads) regional wall motion are observed in the left ventricles of MI+PDGFRα+ CLCs and MI+αMHC+ CMs; B and C: Quantifications of left ventricular internal dimension in systole (mm), ejection fraction (%) and fractional shortening (%). Each group, n = 7. aP < 0.05 and bP < 0.01 vs Con; cP < 0.01 vs MI; D: Gross images of hearts in control, MI, MI+PDGFRα+ CLCs, and MI+αMHC+ CMs. Scale bars, 2.5 mm; E: H and E staining of mid-sectioned hearts of control, MI, MI+PDGFRα+ CLCs, and MI+αMHC+ CMs. Scale bars, 1 mm and 50 μm in the upper and lower panels, respectively; F: Quantifications of the thickness (mm) of left ventricle in the infarcted region. Each group, n = 7. bP < 0.01 vs Con; cP < 0.01 vs MI or MI+PDGFRα+ CLCs. CLCs: Cardiac lineage-committed cells; CMs: Cardiomyocytes; MI: Myocardial infarction.
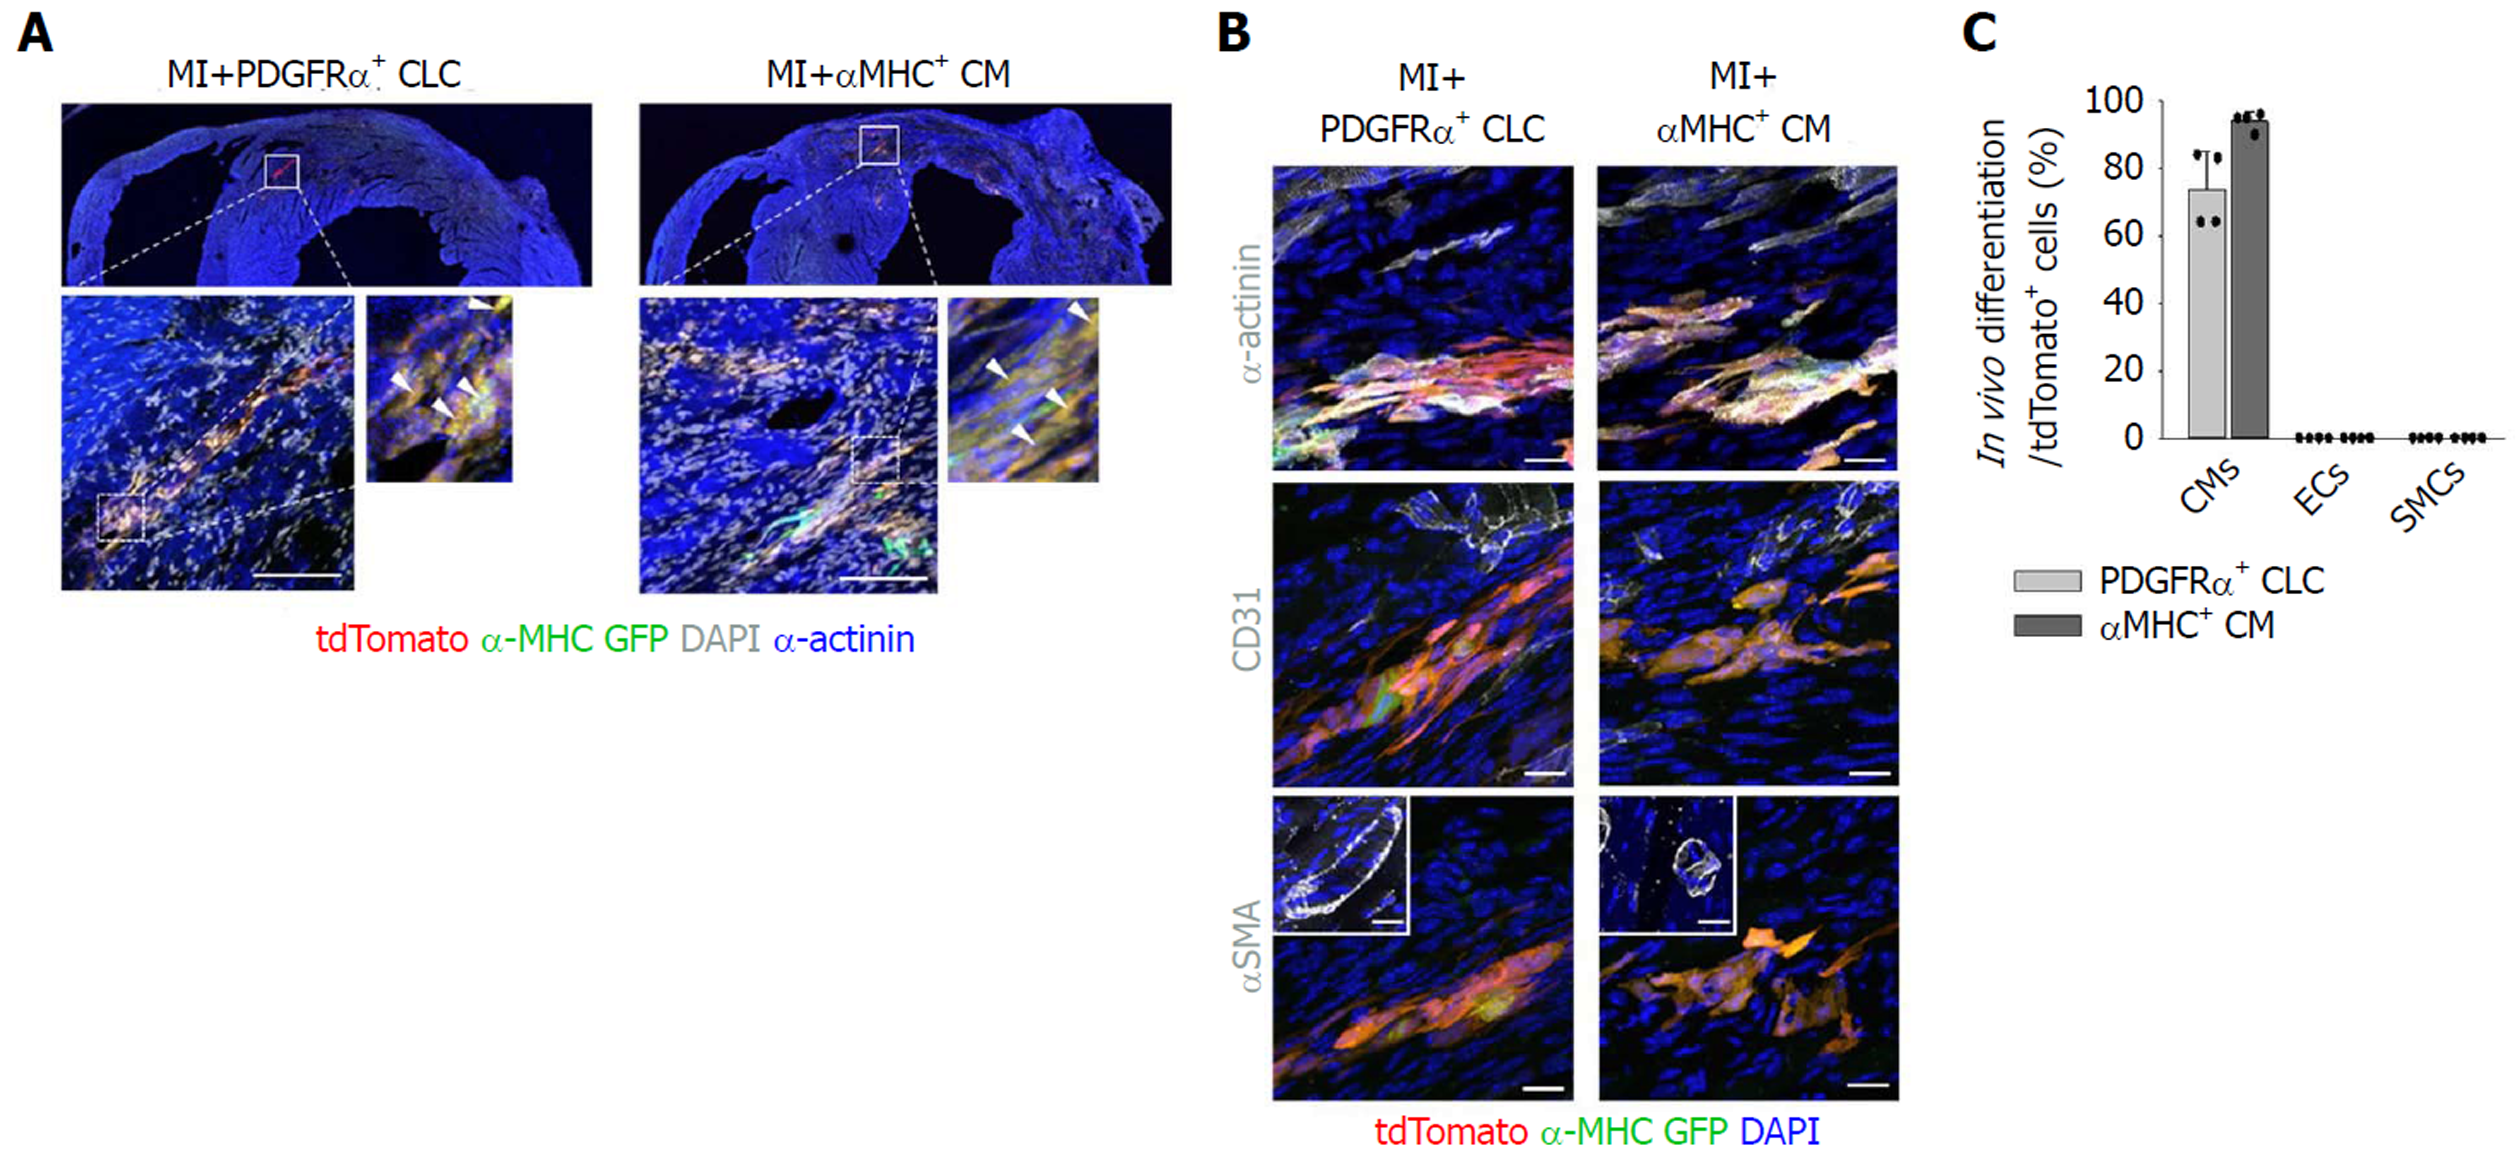
Figure 3 Integration and differentiation of implanted platelet-derived growth factor receptor-α+ cardiac lineage-committed cells in the infarcted heart.
A: tdTomato-tagged platelet-derived growth factor receptor-α (PDGFRα)+ cardiac lineage-committed cells (CLCs) or αMHC+ cardiomyocytes (CMs) were implanted into the infracted myocardium and integration was confirmed by immunostaining. tdTomato+/α-MHC-GFP+ cells (white arrowheads) are implanted PDGFRα+ CLCs and αMHC+ CMs. Scale bars, 100 μm; B: Representative confocal images showing differentiation of tdTomato+ PDGFRα+ CLCs and αMHC+ CMs into cardiomyocytes 15 d after the implantation. αSMA-expressing cells were negative for tdTomato or α-MHC-GFP signal as shown in the inlet. Scale bars, 25 μm; C: Percentages of α-actinin+ CMs, CD31 endothelial cells and αSMA+ smooth muscle cells of the implanted PDGFRα+ CLCs and αMHC+ CMs. Each group, n = 4. Scale bars, 20 μm. CLCs: Cardiac lineage-committed cells; CMs: Cardiomyocytes; MI: Myocardial infarction; ECs: Endothelial cells; SMCs: Smooth muscle cells.
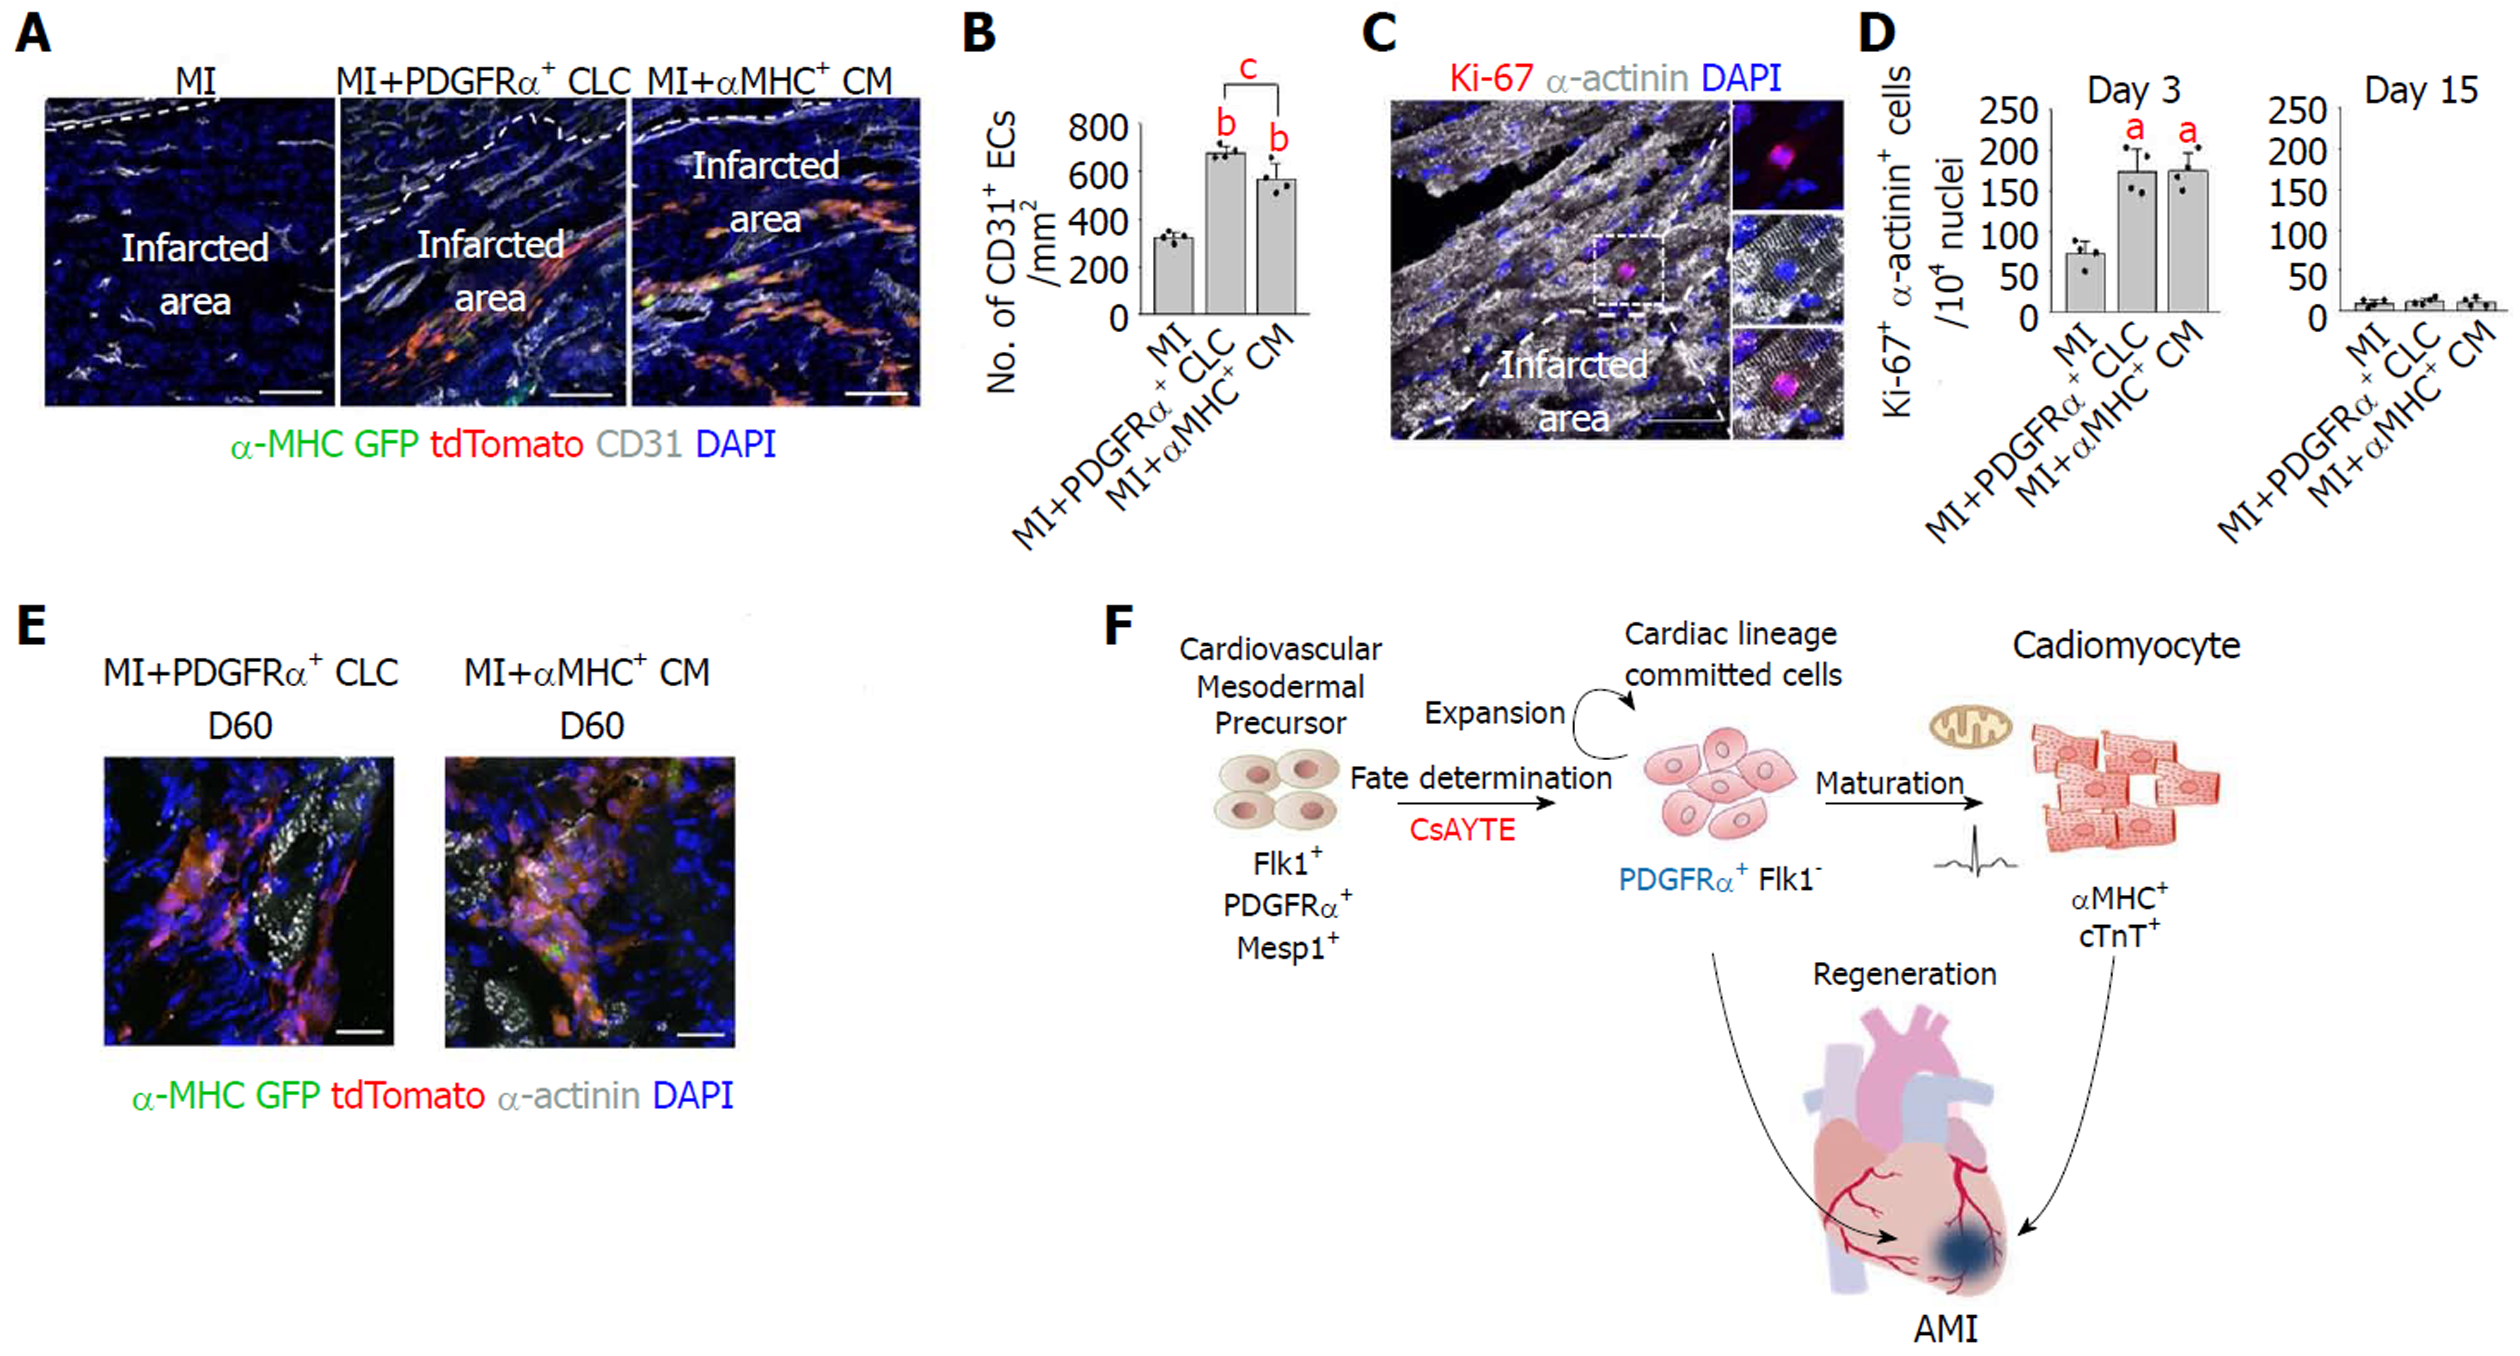
Figure 4 Proliferation and survival of implanted platelet-derived growth factor receptor-α+ cardiac lineage-committed cells in the infarcted heart.
A: Representative confocal image of Ki-67+ host cardiomyocytes in the peri-infarcted region 3 d after cell injection. Dotted-lined rectangular region is magnified in right. Scale bar, 50 μm; B: Quantifications of Ki-67+α-actinin+ cardiomyocytes per 104 nuclei in the peri-infarcted region 3 and 15 d after the implantation. Each group, n = 4. aP < 0.05 vs myocardial infarction (MI); C: Representative confocal images of revascularization within the infarcted areas 15 d after the implantation. Scale bars, 100 μm; D: Quantifications of capillary density (No. of CD31+ ECs/mm2) within the infarcted areas. Each group, n = 4. bP < 0.01 vs MI; cP < 0.01 vs MI+ platelet-derived growth factor receptor-α (PDGFRα)+ cardiac lineage-committed cells (CLCs); E: Representative confocal images of tdTomato+ PDGFRα+ CLCs and αMHC+ CMs 60 d after the implantation. Three independent experiments showed similar findings. Scale bars, 20 μm; F: Schematic diagram illustrating the regenerative potential of PDGFRα+ CLCs in the infarcted heart. CLCs: Cardiac lineage-committed cells; CMs: Cardiomyocytes; MI: Myocardial infarction.
- Citation: Hong SP, Song S, Lee S, Jo H, Kim HK, Han J, Park JH, Cho SW. Regenerative potential of mouse embryonic stem cell-derived PDGFRα+ cardiac lineage committed cells in infarcted myocardium. World J Stem Cells 2019; 11(1): 44-54
- URL: https://www.wjgnet.com/1948-0210/full/v11/i1/44.htm
- DOI: https://dx.doi.org/10.4252/wjsc.v11.i1.44


