Copyright
©The Author(s) 2018.
World J Stem Cells. Nov 26, 2018; 10(11): 146-159
Published online Nov 26, 2018. doi: 10.4252/wjsc.v10.i11.146
Published online Nov 26, 2018. doi: 10.4252/wjsc.v10.i11.146
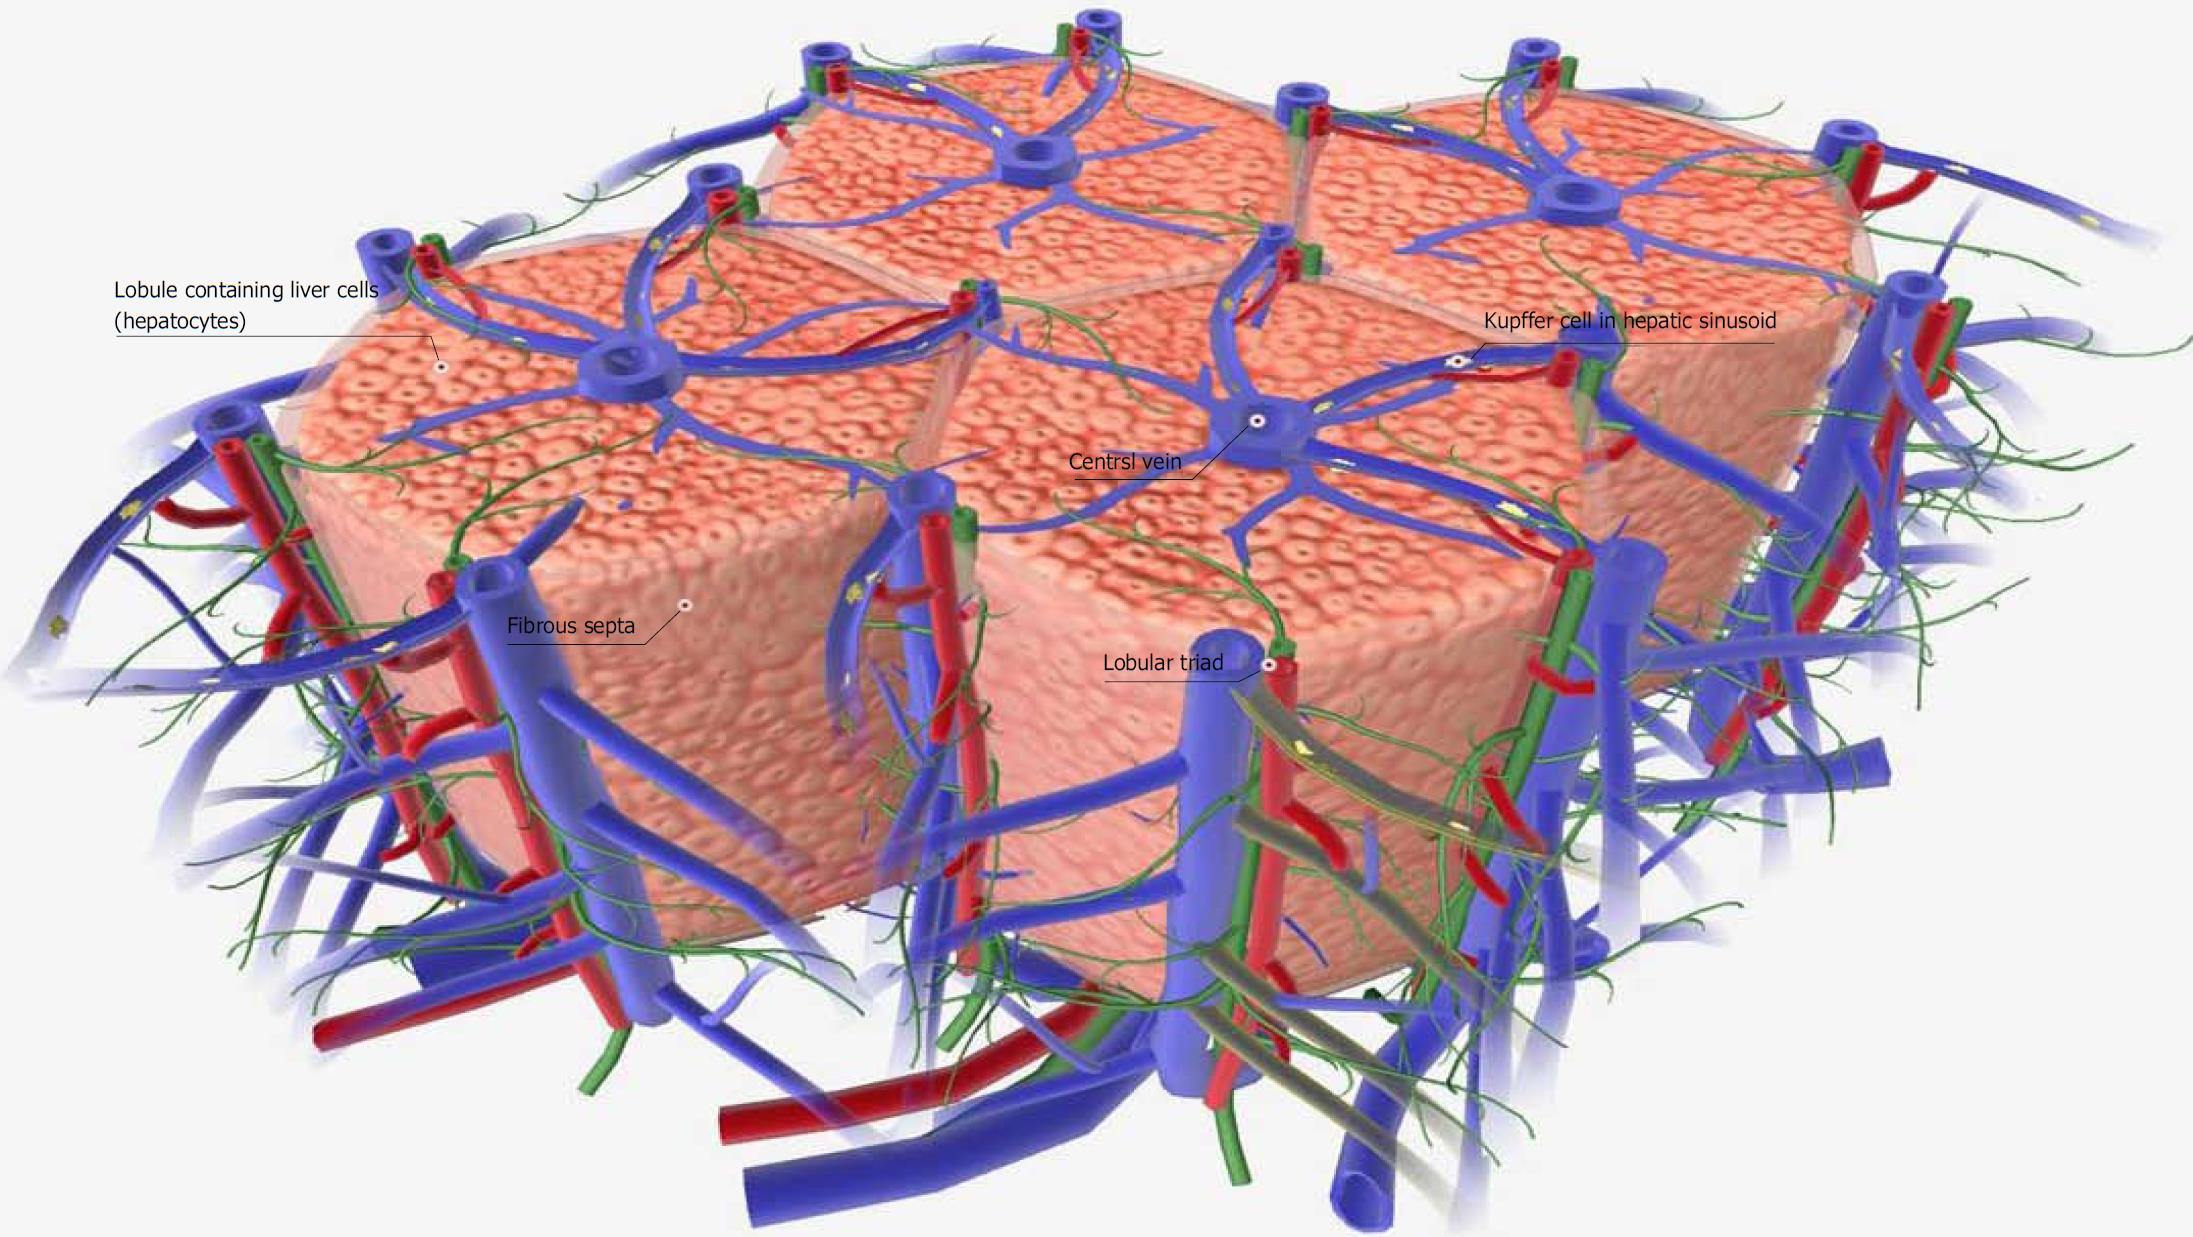
Figure 1 Schematic diagram of a normal liver tissue model.
The liver is a digestive organ that filters and detoxifies blood from the digestive tract. It also produces proteins, such as albumin, and synthesizes cholesterol and bile. The functional portion of the liver tissue is organized into hexagonal columns called liver lobules. Each liver lobule contains hundreds of individual liver cells (hepatocytes) and a large central vein. Lobular portal triads, which contain branches from the hepatic portal vein, hepatic artery and bile duct, are located at the points of the hexagonal lobule. Blood from the branches of the hepatic artery joins the blood of the hepatic vein branches, forming hepatic sinusoids. Hepatic sinusoids are lined with specialized cells called Kupffer cells, which help collect debris and detoxify the blood. All hepatic sinusoids in the liver lobule drain into the central vein. Adjacent lobules are separated by a thin fibrous septa. Images were obtained from BIODIGITAL HUMAN 3.0 (https://human.biodigital.com/index.html) (BioDigital, Broadway, NY, United States).
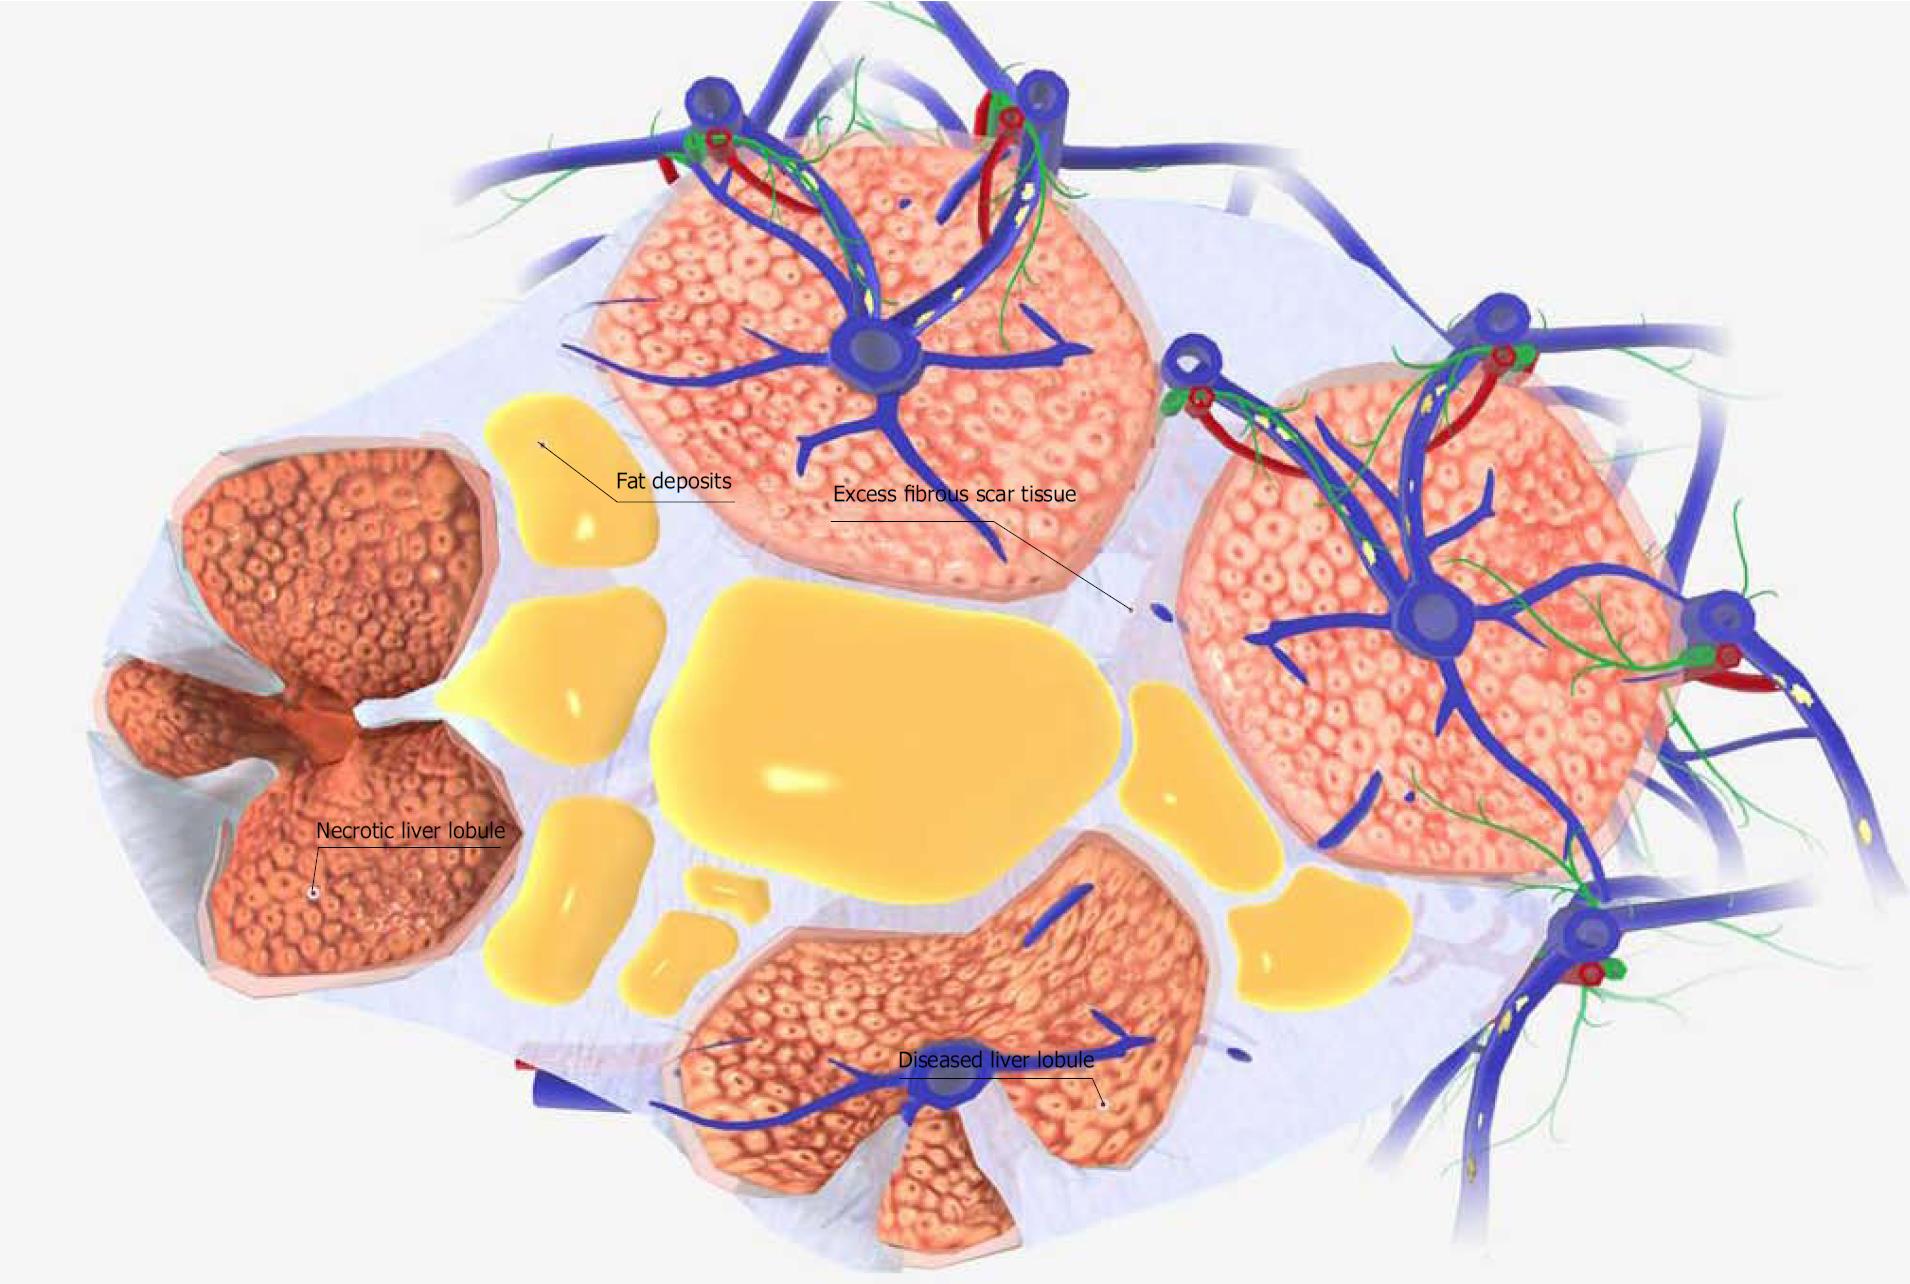
Figure 2 Schematic diagram of a liver cirrhosis tissue model.
The functional portion of the liver tissue is organized into hexagonal columns called liver lobules. Each liver lobule contains hundreds of individual liver cells (hepatocytes). In healthy liver tissue, adjacent lobules are separated by thin fibrous septa. However, liver cirrhosis involves thickening of the fibrous septa that separate lobules, and the deposition of fat. As a result, the blood flow in the lobules is disturbed and hepatocyte necrosis occurs. Also, the fibrous septa that separate the lobules transform the lobules and produce pseudolobules. Although it has a wide variety of causes, liver cirrhosis is most commonly caused by chronic alcohol abuse, chronic hepatitis, and nonalcoholic fatty liver disease. Images were obtained from BIODIGITAL HUMAN 3.0 (https://human.biodigital.com/index.html) (BioDigital, Broadway, NY, United States).
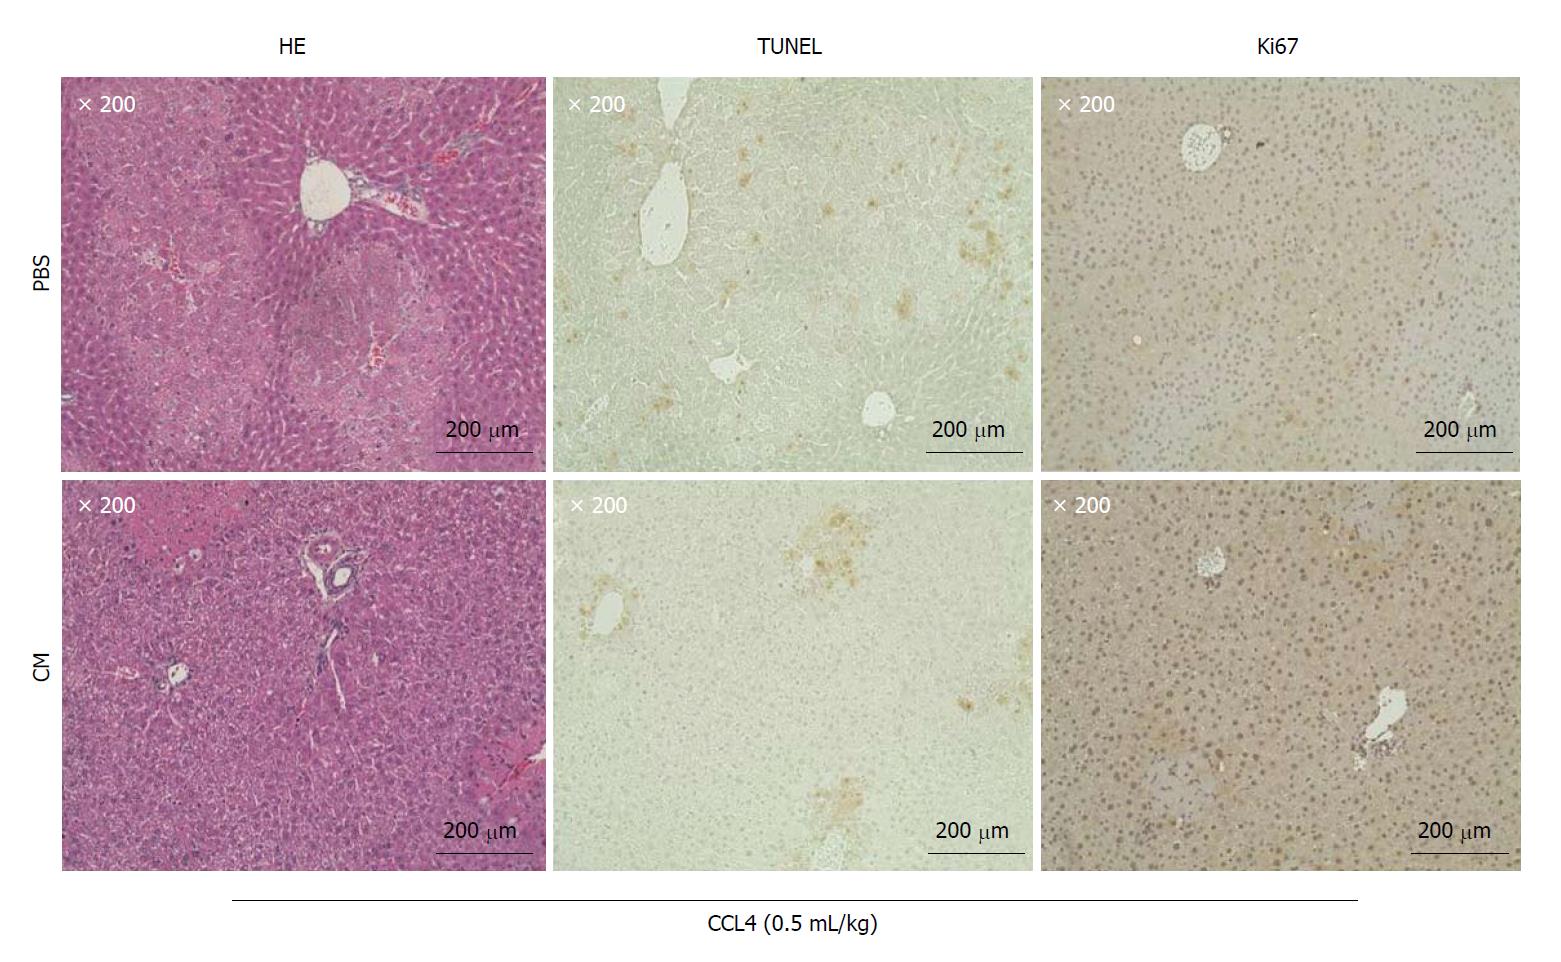
Figure 3 Culture supernatant concentrate significantly improved the symptoms of acute liver failure caused by the administration of CCL4.
Micrographic images of Hematoxylin and Eosin (HE) staining (left panels), TUNEL assay (middle panels) and tissue immunostaining of Ki67 (right panels) of liver specimens. Microscopic images of liver specimens 20 h after the administration of PBS (upper panels) and CM (lower panels) via the mouse tail vein. Fragmented DNA generated in the process of apoptosis can be detected by the TUNEL (TdT-mediated UTP nick end labeling) method. Ki67 protein present in the nucleus of cells in G1, S, G2 and M cycles (cell growth phase) was detected using immunostaining to identify cells in the growth phase in liver tissue. It was also used to count the number of positively stained cells in images of TUNNEL-stained sections (× 200). The numbers of positively stained cells in the PBS and CM groups were 14.00 ± 4.54 and 8.25 ± 5.57, respectively (n = 4; P = 0.19). The numbers of cells with positively stained nuclei on images of Ki67-stained sections (× 200) were also counted. The numbers of cells with positively stained nuclei in the PBS and CM groups were 9.25 ± 7.61 and 116.25 ± 3.06, respectively (n = 4; P < 0.01).
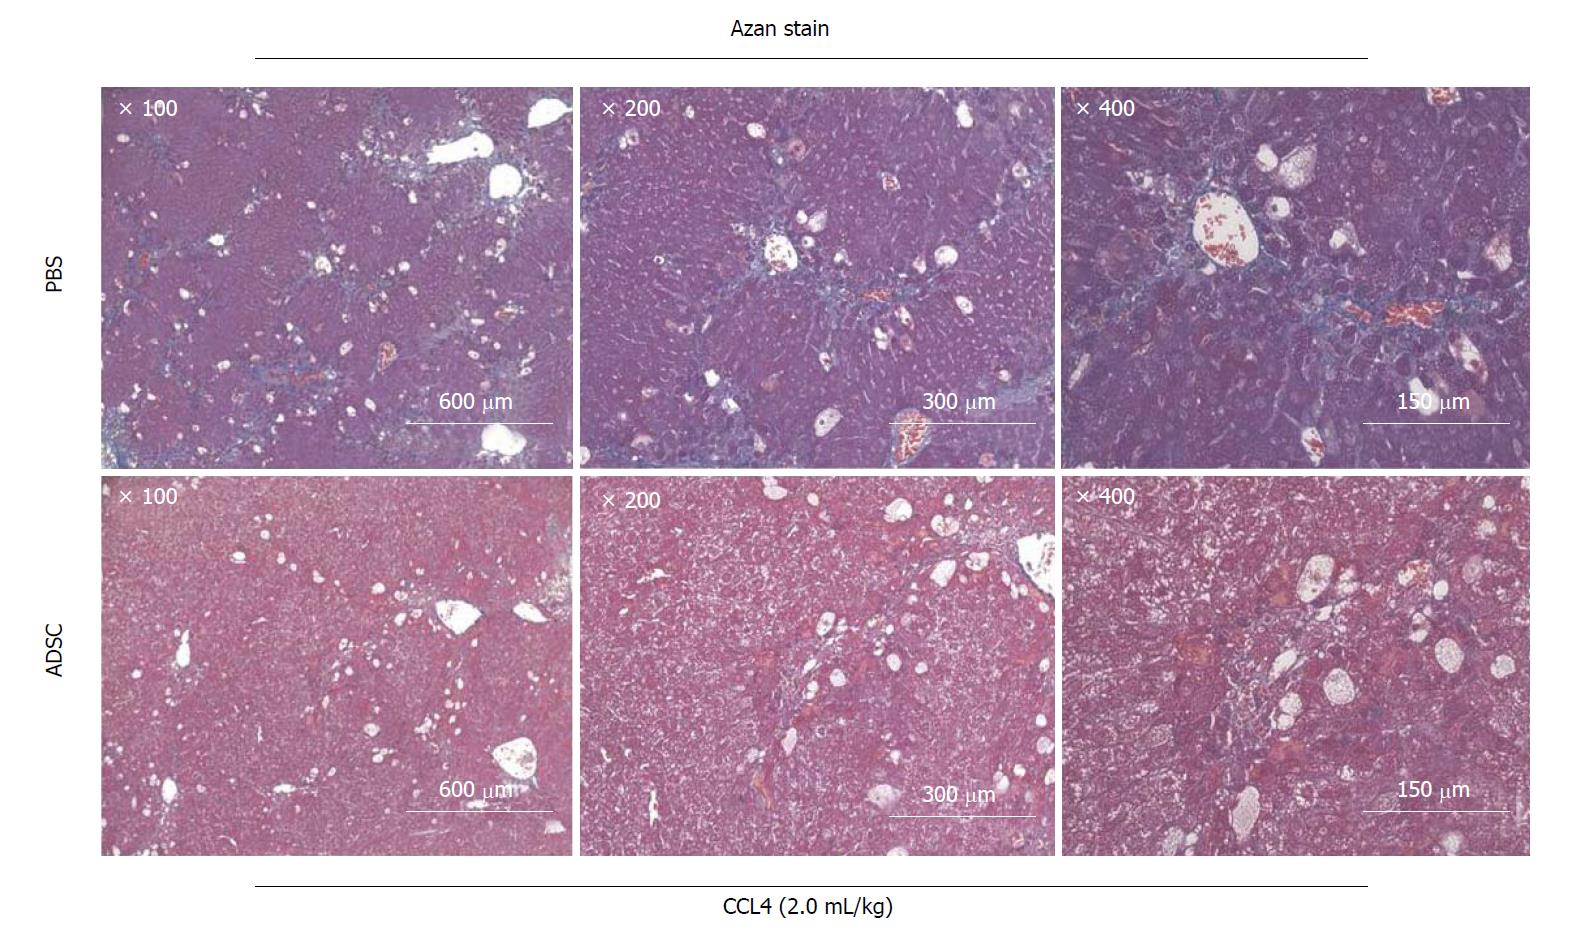
Figure 4 Adipose-derived mesenchymal stem cells improved symptoms of tissue fibrosis in cirrhosis caused by the administration of CCL4.
Micrographic image of Azan staining of liver specimens. Azan staining is a fibrous connective tissue staining method that differentiates collagen fibers and muscle fibers. The fibrous connective tissue in the tissue section was stained blue. Microscopic images of the liver specimens 20 h after the administration of PBS (upper panels) and adipose-derived mesenchymal stem cells (ADSC) (lower panels) via the mouse tail vein. In the ADSC administration group, fibrosis and pseudolobule formation were ameliorated. Microscopic images (×100 - 400) of the same tissue section.
- Citation: Nahar S, Nakashima Y, Miyagi-Shiohira C, Kinjo T, Toyoda Z, Kobayashi N, Saitoh I, Watanabe M, Noguchi H, Fujita J. Cytokines in adipose-derived mesenchymal stem cells promote the healing of liver disease. World J Stem Cells 2018; 10(11): 146-159
- URL: https://www.wjgnet.com/1948-0210/full/v10/i11/146.htm
- DOI: https://dx.doi.org/10.4252/wjsc.v10.i11.146


