Published online Jul 21, 2024. doi: 10.3748/wjg.v30.i27.3290
Revised: May 9, 2024
Accepted: June 6, 2024
Published online: July 21, 2024
Processing time: 171 Days and 0.4 Hours
The annual incidence of metabolic-associated fatty liver disease (MAFLD) in China has been increasing and is often overlooked owing to its insidious characteristics. Approximately 50% of the patients have a normal weight or are not obese. They are said to have lean-type MAFLD, and few studies of such patients are available. Because MAFLD is associated with abnormal lipid metabolism, lipid-targeted metabolomics was used in this study to provide experimental evidence for early diagnosis and pathogenesis.
To investigate the serum fatty-acid metabolic characteristics in lean-type MAFLD patients using targeted serum metabolomic technology.
Between January and June 2022, serum samples were collected from MAFLD patients and healthy individuals who were treated at Shanghai Putuo District Central Hospital for serum metabolomics analysis. Principal component analysis and orthogonal partial least squares-discriminant analysis models were deve
Urea nitrogen and uric acid levels were higher in lean-type MAFLD patients than in healthy individuals (P < 0.05). Alanine transaminase and cholinesterase levels were higher in lean-type MAFLD patients than in healthy indi
The metabolic profiles of lean-type MAFLD patients and healthy participants differed significantly, yielding 65 identified biomarkers. PA, OA, LA, and AA exhibited the most significant changes, offering valuable clinical guidance for prevention and treatment of lean-type MAFLD.
Core Tip: This study targeted the serum metabolomics of healthy individuals and metabolic-associated fatty liver disease (lean-type MAFLD), screened biomarkers and related metabolic pathways, and conducted targeted quantitative analysis of their specific biomarkers with the aim of providing experimental evidence for the early diagnosis and pathogenesis of lean-type MALFD.
- Citation: Sun PQ, Dong WM, Yuan YF, Cao Q, Chen XY, Guo LL, Jiang YY. Targeted metabolomics study of fatty-acid metabolism in lean metabolic-associated fatty liver disease patients. World J Gastroenterol 2024; 30(27): 3290-3303
- URL: https://www.wjgnet.com/1007-9327/full/v30/i27/3290.htm
- DOI: https://dx.doi.org/10.3748/wjg.v30.i27.3290
The annual prevalence of metabolic-associated fatty liver disease (MAFLD) in China has been increasing, with the current rate exceeding 30%[1-4]. Owing to subtle early manifestations that often go unnoticed, approximately 20% of MAFLD patients progress to metabolic-associated steatohepatitis, fibrosis, cirrhosis, and liver cancer[5,6]. MAFLD is closely associated with obesity and type 2 diabetes, but approximately 40.8% of MAFLD patients have a body mass index (BMI) that does not meet the criteria for overweight or obesity[7-9]. This condition is commonly referred to as lean or nonobese-type MAFLD. Compared with other ethnic groups, the prevalence of metabolic disorders is higher in Asians with lower BMIs[10].
Because studies of lean-type MAFLD are limited, its pathogenesis and optimal treatment are not clear. Patients with lean-type MAFLD are at increased risk of progressing to fatty liver inflammation and liver fibrosis, with an incidence of 30%, and it is closely associated with metabolic dysfunction[11]. Metabolomics is a high-throughput detection method widely used for disease diagnosis and in mechanistic investigations[12]. In this study, we used ultra-high-performance liquid chromatography-tandem mass spectrometry with an electrospray ionization quadrupole trap analyzer to identify serum metabolic markers that distinguished lean-type MAFLD patients from healthy individuals. We aimed to identify metabolic pathways specific to those markers and to conduct a targeted investigation of the metabolites and pathways that were significantly changed in lean-type NAFLD. This study aimed to provide experimental evidence for the early diagnosis and pathogenesis of lean-type MAFLD.
Between January 2022 and June 2022, 20 patients diagnosed with lean-type MAFLD were recruited from the gastroenterology department of the Central Hospital of Putuo District, Shanghai. The control group included 20 healthy volunteers who were recruited after physical examination. General information and clinical data, including a complete blood count, liver function, renal function, and a lipid profile, were collected for the analysis. The research protocol was approved by the Ethics Committee of the Central Hospital of Putuo District (Affiliated to the Putuo Hospital of Shanghai University of Traditional Chinese Medicine; Approval No. PTEC-R-2020-29-1). All the enrolled patients provided informed consent before participating in the study.
MAFLD was diagnosed following the clinical criteria included in the 2010 Guidelines for the Diagnosis and Treatment of Nonalcoholic Fatty Liver Disease of the Chinese Society of Hepatology, Chinese Medical Association[11]. The criteria for MAFLD were: (1) No history of excessive alcohol consumption or an equivalent ethanol intake of < 140 g per week for men (< 70 g per week for women); (2) Absence of specific diseases, including viral hepatitis, drug-induced liver disease, hepatolenticular degeneration, autoimmune liver diseases that can cause fatty liver, or use of total parenteral nutrition; and (3) Histopathological changes in liver biopsy specimens consistent with the pathological diagnosis criteria for fatty liver disease.
MAFLD was defined by: (1) Liver imaging findings consistent with the diagnosis of diffuse fatty liver and exclusion of other causes; and (2) Manifestations related to metabolic syndrome with persistently elevated levels of serum alanine transaminase (ALT), aspartate transaminase, or gamma-glutamyl transferase for > 6 months. Individuals with abnormal enzyme profiles and a fatty liver on imaging and return to normal or improve after weight loss and decreased insulin resistance fulfill the diagnostic criteria of MAFLD. The diagnostic criteria for MAFLD included a BMI of < 23 for lean-type, 23 ≤ BMI < 28 for overweight-type, and ≥ 28 for obese-type.
Patients who met the following criteria were included in the study: (1) Between 16 years and 75 years of age, regardless of sex; (2) Meeting the diagnostic criteria for lean-type MAFLD according to Western medical standards[13]; (3) Having complete and reliable clinical data, biochemical tests, and specimen collection; and (4) Providing consent to participate.
The exclusion criteria were: (1) Presence of concomitant liver-extrinsic fibrotic diseases, including systemic lupus erythematosus, rheumatic diseases, renal failure, chronic obstructive pulmonary disease; (2) Presence of severe primary diseases related to cardiovascular, cerebrovascular, urinary, renal, hematopoietic systems, malignant tumors, other serious complications, or psychiatric disorders; (3) Presence of thyroid disorders, including hyperthyroidism, hypothy
Ultra-high-performance liquid chromatography (Ultimate 3000; Thermo Fisher Scientific, Waltham, MA, United States); high-resolution mass spectrometry (Orbitrap Elite; Thermo Fisher Scientific); cryogenic high-speed centrifuge (1730R; Mr. Gene GmbH, Regensburg, Germany); ultrapure water system (Milli-Q; Merck Biotechnology Shanghai Co., Ltd., Shanghai, China); multi-tube vortex oscillator (VX-II; Beijing Tajin Technology Co., Ltd., Beijing, China); methanol (HPLC grade, Batch No.: O0621152; China National Pharmaceutical Group Chemical Reagent Co., Ltd., Shanghai, China); methyl tert-butyl ether (analytical grade, Batch No. 20210227; China National Pharmaceutical Group Chemical Reagent Co., Ltd.); formic acid (chromatography grade, Batch No.: D1290265; Shanghai ANPEL Scientific Instrument Co., Ltd., Shanghai, China); ammonium acetate (chromatography grade, Batch No. BCBR1129V; Shanghai ANPEL Scientific Instrument Co., Ltd.); isopropanol (chromatography grade, Batch No. V589K144; Shanghai ANPEL Scientific Instrument Co., Ltd.); acetonitrile (chromatography grade, Batch No. K3021728l Shanghai ANPEL Scientific Instrument Co., Ltd.).
Serum handling: The study included 20 patients with lean-type MAFLD and 20 healthy volunteers. Morning fasting venous blood (10 mL) was collected and allowed to stand at 4 °C for 2 h before centrifuging at 3000 rpm for 15 minutes. Serum (50 μL) was collected from the upper layer. Serum samples were mixed with 200 μL methanol and vortexed for complete extraction. After low-temperature centrifugation at 14000 rpm and 4 °C for 10 minutes, the supernatant was transferred to a sample vial for analysis.
Chromatographic conditions: Column: C18 chromatographic column (Hypersil Gold C18, 100 mm × 2.1 mm, 1.9 μm); flow rate: 0.3 mL/min; column temperature: 40 °C; mobile phase composition: A: Pure water + 0.1% formic acid and B: Acetonitrile + 0.1% formic acid. Gradient elution program: 0-2 minutes, 95% A; 2-12 minutes, 5%-95% A; 12-15 minutes, 5%-95% A; 15-17 minutes, 5%-95% A.
Mass spectrometric conditions: Positive ion mode: Heater temperature: 300 °C; sheath gas flow rate: 45 psi; auxiliary gas flow rate: 5 L/min; sweep gas flow rate: 0.3 L/min; electrospray voltage: 3.0 kV; capillary temperature: 350 °C; S-Lens RF level: 30%. Negative ion mode: Heater temperature 300 °C; sheath gas flow rate: 45 psi; auxiliary gas flow rate: 5 L/min; sweep gas flow rate: 0.3 L/min; electrospray voltage: 3.2 kV; capillary temperature: 350 °C; S-Lens RF level: 60%.
Chromatographic conditions: Column: Acquity UPLC BEH C8 column (2.1 mm × 100 mm, 1.7 μm) (Waters Corp., Milford, MA, United States); column temperature: 40 °C; flow rate: 0. 35 mL/min; mobile phase: water (0.1% formic acid): acetonitrile (0.1% formic acid); gradient elution program: 1 minute, 50% B; 1-5 minutes, 50%-80% B; 5-6.5 minutes, 80%-95% B; 6.5-10 minutes, 95% B.
Tandem mass spectrometry (MS/MS detection): The serum concentration of fatty acids and their metabolites were determined using ultra-high-performance liquid chromatography (H-Class; Waters Corp.) coupled with triple quadrupole mass spectrometry (6500; AB SCIEX, Framingham, MA, United States). MS/MS data were collected using deuterated arachidonoylethanolamide (AEA-d8), deuterated oleoylethanolamide (OEA-d4), deuterated linoleoylethanolamide (LEA-d4), and deuterated oleic acid (OA-d9) as internal standards. Analytes, including AEA, 2-arachidonoyl glycerol ester, palmitoylethanolamide (PEA), OEA, LEA, 2-arachidonoylglycerol (2-AG), 1-palmitoyl glycerol (1-PG), 1-oleoyl glycerol (1-OG), and 1-linoleoyl glycerol (1-LG), were detected in the positive electrospray ionization mode, and arachidonic acid (AA), stearic acid, palmitic acid (PA), OA, and linoleic acid (LA) were detected in the negative mode. The optimized operational conditions were: ion spray voltage of + 5500 V in positive mode and -4500 V in negative mode, ion source temperature of 550 °C. Nitrogen was used as the collision gas. The ion pairs and related internal standards for multiple reaction monitoring are shown in Table 1.
| ID | Q1 | Q3 | DP | CE | CXP |
| AEA-d8 | 356.100 | 294.000 | 64.94 | 19.09 | 18.93 |
| AEA | 348.000 | 62.000 | 56.00 | 42.00 | 10.00 |
| 2-AG | 379.000 | 287.400 | 163.86 | 20.05 | 13.09 |
| OEA | 326.400 | 309.200 | 195.32 | 21.31 | 29.01 |
| OEA-d4 | 330.600 | 66.100 | 132.66 | 21.55 | 12.58 |
| LEA | 324.400 | 62.100 | 130.26 | 17.76 | 11.28 |
| PEA | 300.300 | 62.100 | 124.00 | 19.83 | 10.20 |
| LEA-d4 | 328.100 | 66.000 | 133.80 | 20.98 | 8.59 |
| 1-LG | 355.300 | 338.400 | 32.21 | 10.73 | 18.49 |
| 1-OG | 357.300 | 339.300 | 145.00 | 13.20 | 24.00 |
| 1-PG | 331.200 | 313.500 | 155.00 | 12.70 | 19.00 |
| LA | 325.200 | 279.100 | -10.11 | -8.72 | -25.70 |
| OA | 327.200 | 281.300 | -47.00 | -10.50 | -10.00 |
| PA | 301.200 | 255.200 | -58.00 | -14.00 | -15.00 |
| AA | 303.100 | 259.000 | -73.90 | -16.14 | -13.02 |
| OA-d9 | 336.300 | 290.300 | -14.34 | -9.32 | -7.94 |
Sample preparation: A volume of 30 μL of serum was combined with mixed internal standards, followed by successive addition of 500 cL of methyl tert-butyl ether, 150 μL methanol, and 140 μL ultrapure water. The mixture was vortexed for 1 minute and then centrifuged at 4 °C for 10 minutes (3000 rpm). The upper layer was collected, concentrated, and dried before reconstitution with 100 μL acetonitrile. The resulting supernatant were transferred to a sample vial for further analysis.
Standard and internal standard preparation: Precisely weighed amounts of AEA, LEA, PEA, OEA, 2-AG, 1-LG, 1-PG, 1-OG, AEA-d8, OEA-d4, and LEA-d4 were prepared at concentrations of 1250, 500, 250, 125, 50, 25, 12. 5, 5, 1, and 0. 5 ng, respectively. OA, PA, AA, and LA standards were prepared at concentrations of 5, 10, and 20 μg/mL, respectively, including internal standards AA-d8 (10 μg/mL) and OA-d9 (1 μg/mL).
Data processing and statistical methods: Peak alignment, retention time correction, and peak area were calculated using LC-MS software. Accurate molecular weights and MS/MS spectra were used for the identification and database retrieval of the metabolites. Unsupervised principal component analysis (PCA) and orthogonal partial least squares-discriminant analysis (OPLS-DA) were used for multidimensional statistical analysis. Enrichment analysis of significantly altered metabolic pathways was performed using the Kyoto Encyclopedia of Genes and Genomes database. All other data were analyzed using SPSS 22.0 (IBM Corp., Armonk, NY, United States). Normally distributed quantitative data were reported as means ± SD. Comparison of quantitative data among groups was performed with analysis of variance if the data satisfied the normality and homogeneity of variance assumptions; otherwise, the Wilcoxon non-parametric test was used. P < 0. 05 was considered statistically significant.
Twenty lean-type MAFLD patients and 20 healthy individuals were included in this study. Differences in general characteristics, including sex, age, or BMI observed in lean-type MAFLD patients and healthy individuals were not significant (Table 2). Routine blood tests revealed a significant difference between the white blood cell counts of the lean-type MAFLD patients and healthy controls (P < 0.01). Renal function test results revealed significant differences in urea nitrogen, uric acid, and creatinine levels in the lean-type MAFLD patients and healthy controls (P < 0.01). The results of liver function tests, including cholinesterase and ALT levels in the lean-type MAFLD patients and healthy controls, were significantly different (P < 0.01). The glucose metabolism tests found a significant difference of fasting blood glucose level between lean-type MAFLD patients and healthy controls (P < 0.01). Blood lipid analysis revealed significant differences in high-density lipoprotein (HDL), triglycerides, and apolipoprotein A1 (APOA-1) level between lean-type MAFLD patients and healthy controls (P < 0.01).
| Indicator | Lean MAFLD group, n = 20 | Control group, n = 20 | Statistical value | P value |
| Male/female sex | 5/15 | 0/20 | χ2 = 3.657 | 0.056 |
| Age in years | 52.75 ± 15.17 | 44.95 ± 12.11 | t = 1.798 | 0.08 |
| Weight in kg | 60 ± 6.12 | 54.8 ± 5.64 | t = 2.793 | 0.008b |
| BMI in kg/m² | 22.65 (21.52, 22.80) | 21.25 (20.05, 21.80) | Z = 3.196 | 0.001b |
| White blood cells as × 109/L | 7.25 ± 2.08 | 5.31 ± 1.06 | t = 3.715 | 0.001b |
| Red blood cells as × 1012/L | 4.49 ± 0.63 | 4.23 ± 0.34 | t = 1.616 | 0.117 |
| Hemoglobin in g/L | 134.20 ± 20.78 | 125.70 ± 13.58 | t = 1.531 | 0.134 |
| Hematocrit in % | 39.22 ± 5.84 | 36.67 ± 3.27 | t = 1.703 | 0.097 |
| Platelets as × 109/L | 261.25 ± 69.41 | 228.80 ± 45.42 | t = 1.749 | 0.088 |
| Mean platelet volume in fL | 10.35 ± 1.21 | 10.96 ± 1.06 | t = -1.693 | 0.099 |
| Neutrophils in % | 55.03 ± 11.49 | 51.53 ± 6.33 | t = 1.192 | 0.243 |
| Lymphocytes in % | 35.01 ± 11.49 | 38.25 ± 6.39 | t = -1.104 | 0.278 |
| Monocytes in % | 7.53 ± 1.8773 | 6.71 ± 0.93 | t = 1.75 | 0.091 |
| Mean red cell volume in fL | 87.90 (84.5, 90.58) | 87.85 (86.08, 89.95) | Z = -0.298 | 0.766 |
| Mean red cell hemoglobin in pg | 30.25 (28.63, 31.13) | 30.55 (29.25, 31.28) | Z = -0.69 | 0.49 |
| Mean red cell hemoglobin concentration in g/L | 341.00 (337.00, 349.75) | 346.00 (337.50, 351.00) | Z = -0.895 | 0.371 |
| Red cell volume distribution width in % | 12.90 (12.33, 13.63) | 12.50 (12.13, 13.08) | Z = -1.178 | 0.239 |
| Eosinophils in % | 1.80 (0.75, 2.40) | 1.95 (1.53, 3.33) | Z = -0.934 | 0.35 |
| Basophils in % | 0.50 (0.40, 0.70) | 0.60 (0.40, 0.70) | Z = -0.849 | 0.396 |
| Creatinine in μmol/L | 66.25 ± 17.65 | 57.20 ± 6.99 | t = 2.132 | 0.043a |
| Urea nitrogen in mmol/L | 5.55 (4.35, 6.98) | 4.65 (3.78, 5.38) | Z = -2.274 | 0.023a |
| Uric acid in μmol/L | 350.50 (296.25, 450.00) | 269.00 (236.75, 310.00) | Z = -3.044 | 0.002b |
| Total bilirubin in μmol/L | 9.00 (11.00, 13.00) | 9.00 (10.00, 11.00) | Z = -1.186 | 0.236 |
| Direct bilirubin in μmol/L | 1.66 (1.88, 2.30) | 1.56 (1.62, 1.92) | Z = -1.556 | 0.120 |
| Alkaline phosphatase in U/L | 69.00 (59.25, 89.75) | 61.50 (51.00, 82.50) | Z = -1.448 | 0.148 |
| Cholinesterase in U/L | 9214.95 ± 1232.29 | 7059.20 ± 1260.51 | t = 5.469 | 0.001b |
| Alanine aminotransferase in U/L | 17.00 (11.00, 35.75) | 9.50 (6.25, 16.00) | Z = -3.022 | 0.003b |
| Aspartate aminotransferase in U/L | 24.00 (20.00, 33.75) | 20.50 (17.25, 26.75) | Z = -1.64 | 0.101 |
| γ-glutamyl transferase in U/L | 36.00 (21.50, 45.50) | 20.50 (16.50, 34.75) | Z = -1.719 | 0.086 |
| Total protein in g/L | 73.05 ± 5.93 | 72.15 ± 4.04 | t = 0.561 | 0.578 |
| Albumin in μmol/L | 42.10 ± 3.37 | 41.55 ± 2.98 | t = 0.547 | 0.588 |
| High-density lipoprotein in mmol/L | 1.07 (0.98, 1.26) | 1.40 (1.27, 1.59) | Z = -3.882 | 0.001b |
| Low-density lipoprotein in mmol/L | 3.48 ± 0.72 | 3.40 ± 1.10 | t = 0.255 | 0.800 |
| Triglycerides in mmol/L | 2.68 (1.37, 4.20) | 1.09 (0.94, 1.39) | Z = -3.598 | 0.001b |
| Total cholesterol in mmol/L | 5.19 ± 1.07 | 5.06 ± 1.28 | t = 0.366 | 0.716 |
| Apolipoprotein A1 in g/L | 1.35 (1.22, 1.56) | 1.55 (1.36, 1.74) | Z = -2.153 | 0.031a |
| Apolipoprotein B in g/L | 0.99 ± 0.22 | 0.94 ± 0.32 | t = 0.559 | 0.579 |
| Glycated albumin in % | 12.60 (10.90, 14.45) | 13.00 (12.53, 14.18) | Z = -0.717 | 0.473 |
| Fasting blood glucose in mmol/L | 5.40 (5.03, 6.05) | 4.90 (4.63, 5.15) | Z = -3.052 | 0.002b |
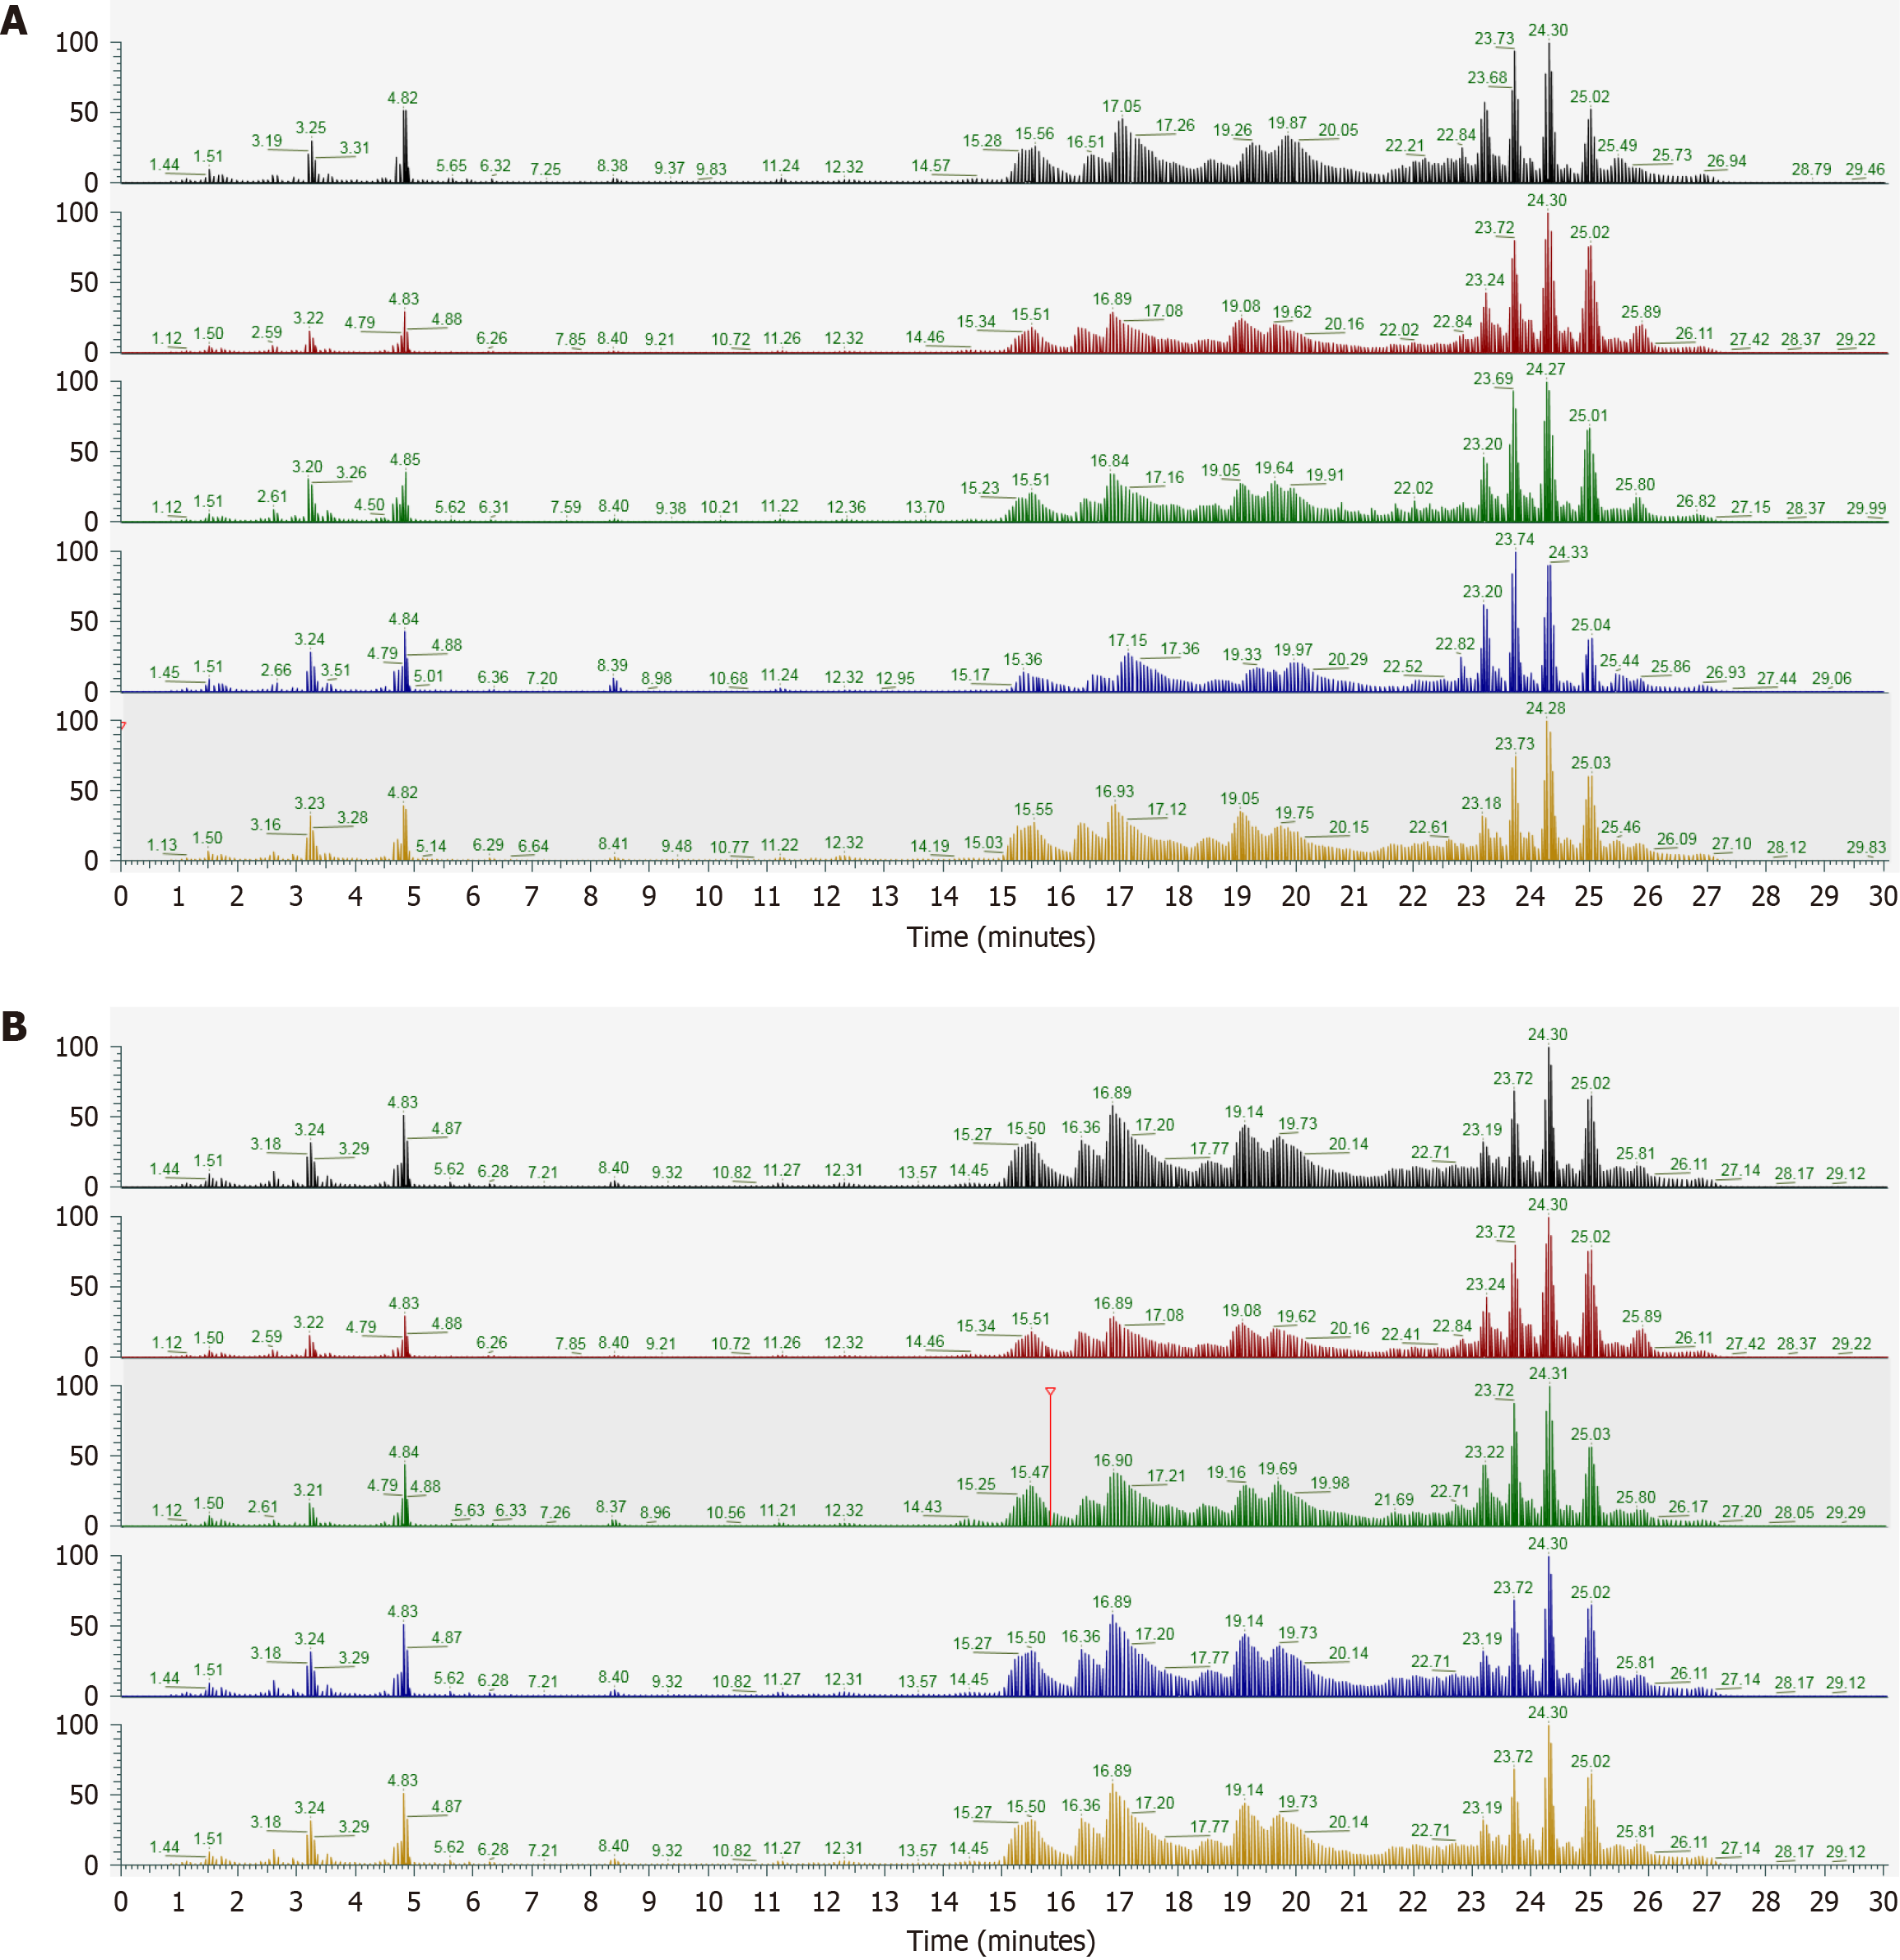
The total ion chromatogram of quality control samples of sera from lean-type MAFLD patients is shown in Figure 1. The overlapping chromatograms indicated excellent instrument stability and consistent retention times, validating the reliability of the analytical data.
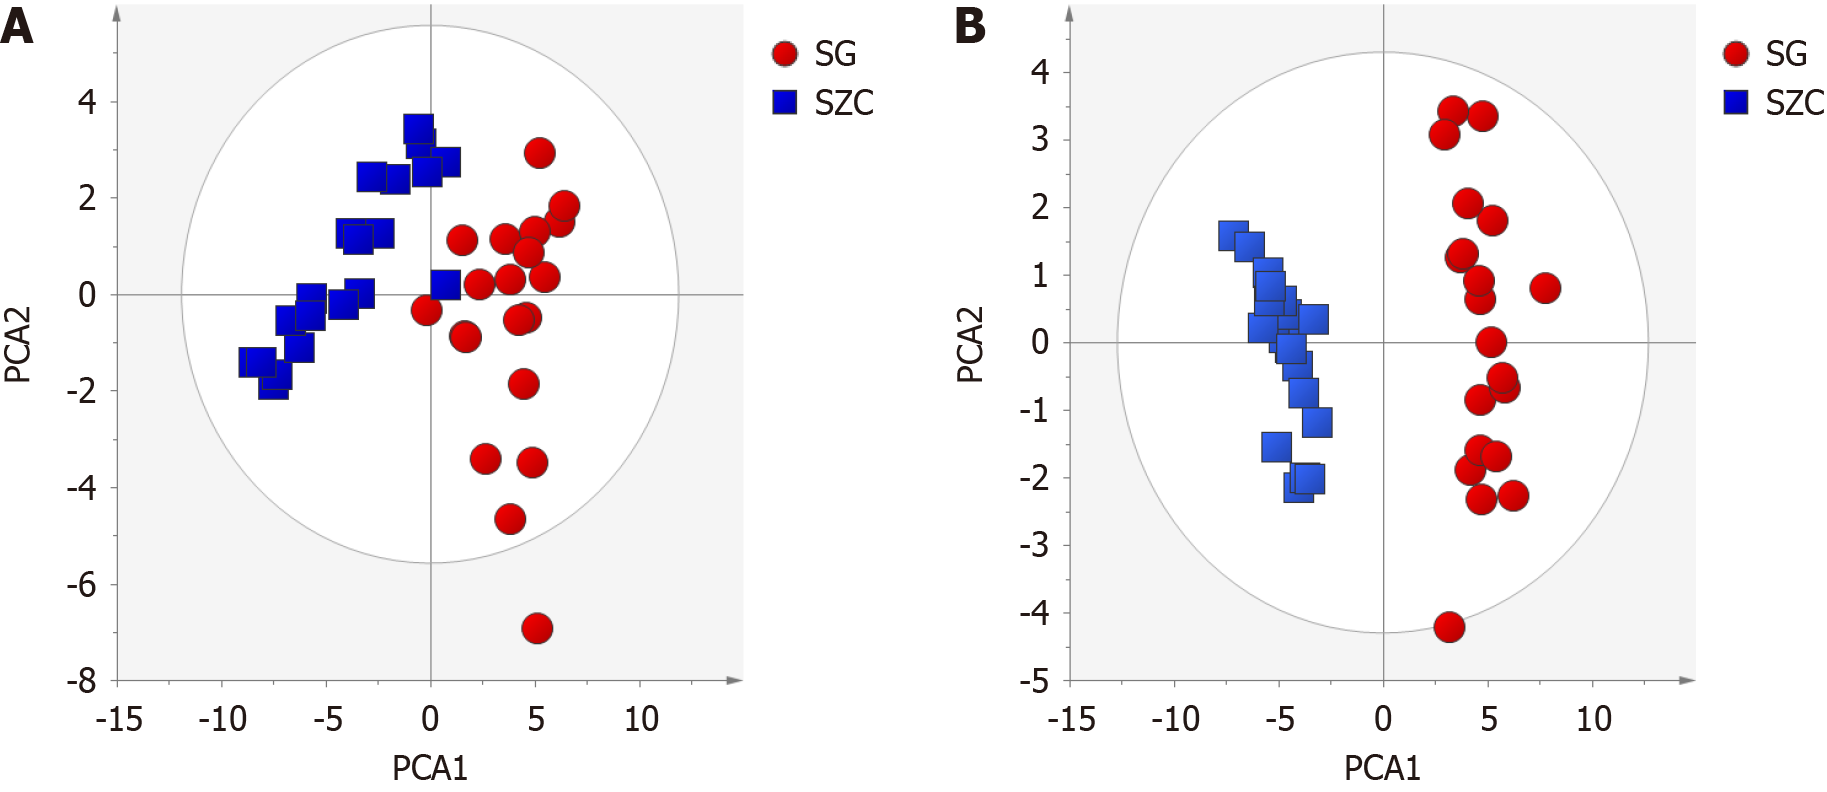
Patient serum metabolomics data were analyzed using Compound Discover software, followed by normalization. An unsupervised PCA model was constructed using Simca-P 14.0 and used to compare the overall profiles of individual samples in both positive and negative detection modes. In both positive and negative modes, samples from lean-type MAFLD patients clustered together and were clearly differentiated from the control group samples (Figure 2). That indicated a pronounced differences in the levels of metabolites found in lean-type MAFLD patients and healthy controls. The PCA model of the positive mode had an R2X of 0. 698 and Q2 of 0. 497, and for the negative mode the R2X was 0. 6794 and a Q2 of 0. 566. These results confirmed that PCA data model was able to elucidate variations in metabolites among samples.
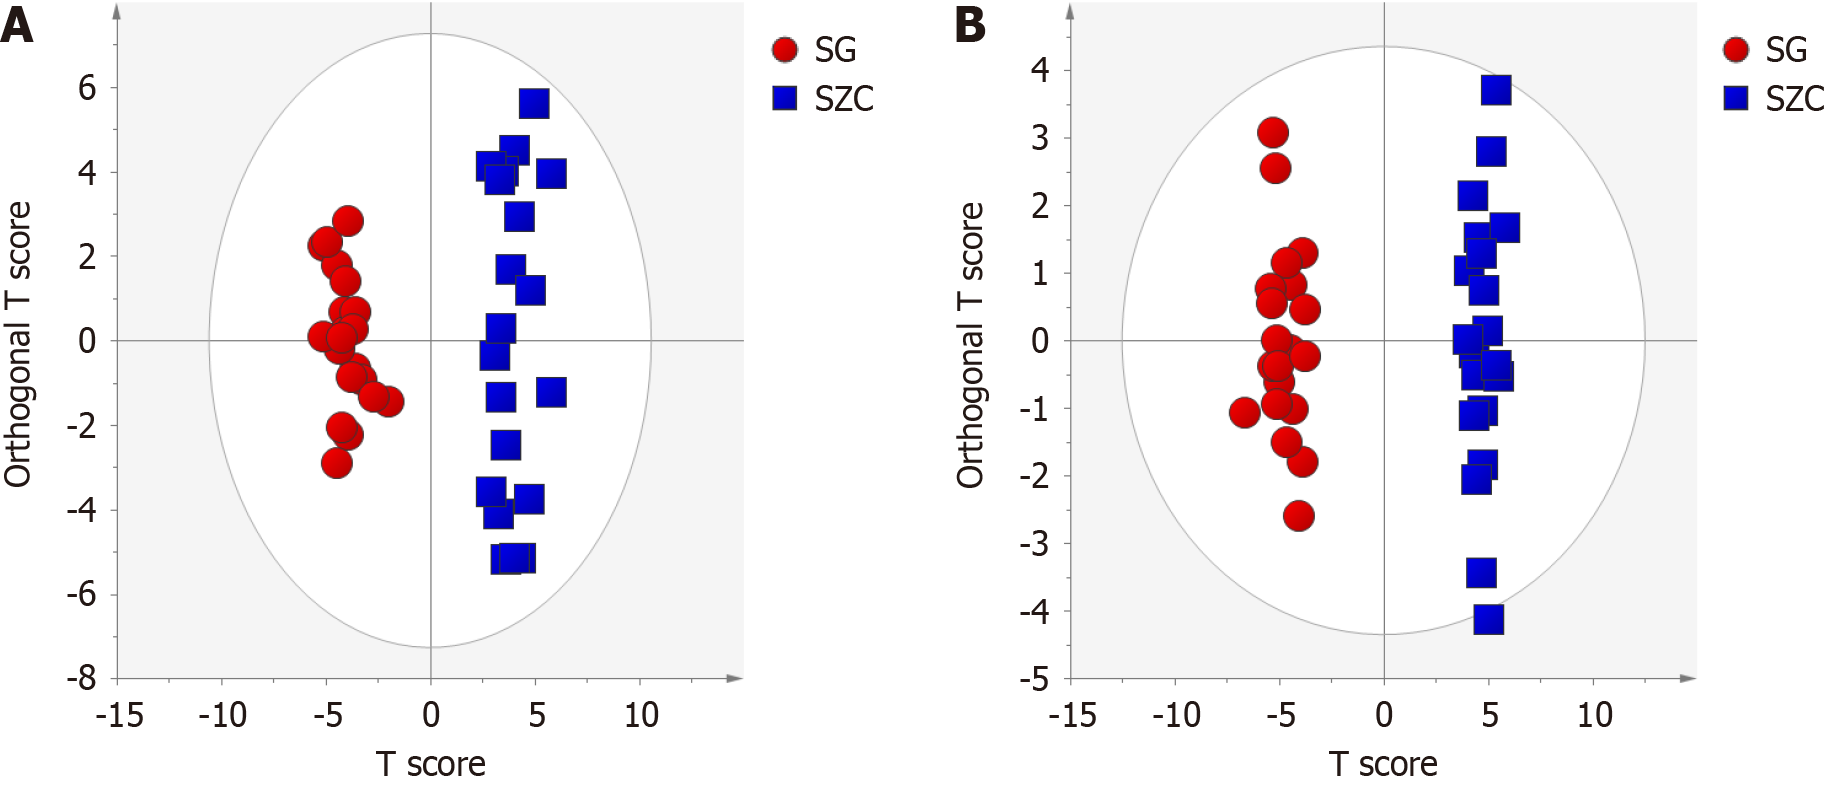
OPLS-DA was used to comprehensively analyze and compare differences in the metabolite data collected from lean-type MAFLD patients and healthy controls. In both positive and negative modes, the lean-type MAFLD patients and healthy controls were completely separated in the OPLS-DA plots (Figure 3). The corresponding R2Y and Q2 values in the positive and negative modes were 0.957 and 0.962 and 0.954 and 0.921, respectively. To further validate the robustness of the model, a permutation test with 200 iterations was conducted, and it revealed no signs of data overfitting. This confirmed the good fit and predictive ability of the model, with statistically significant results.
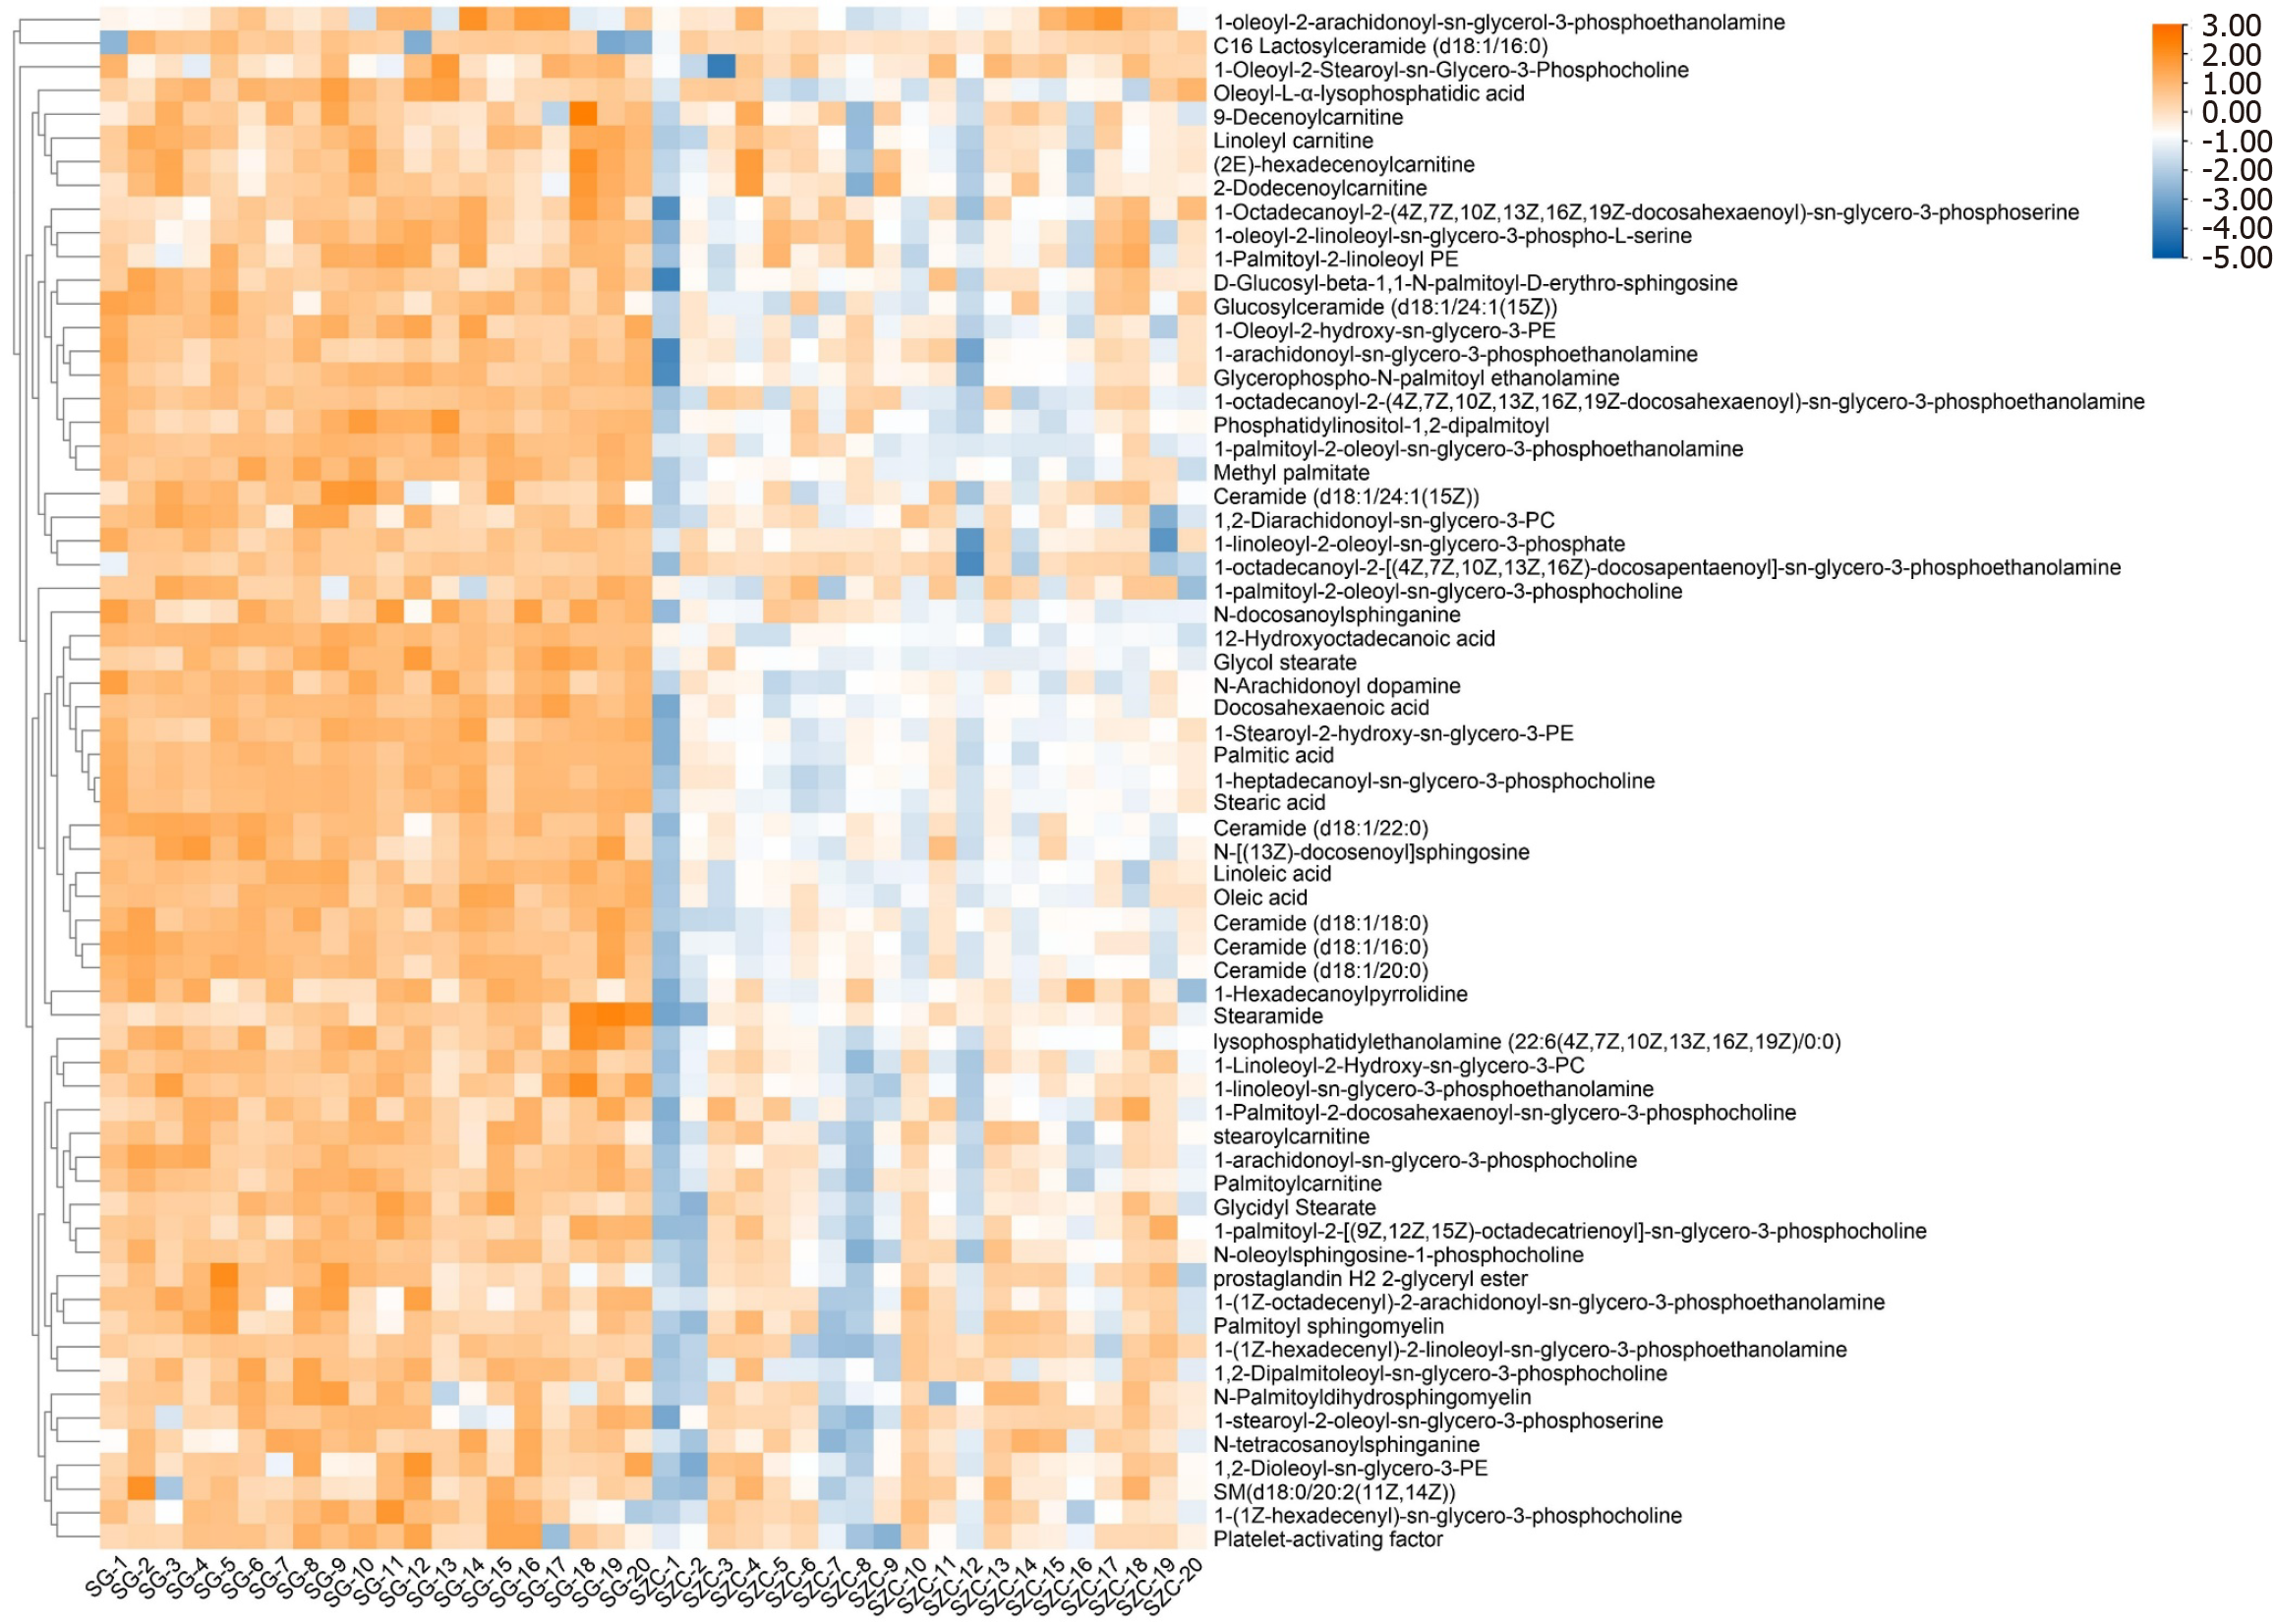
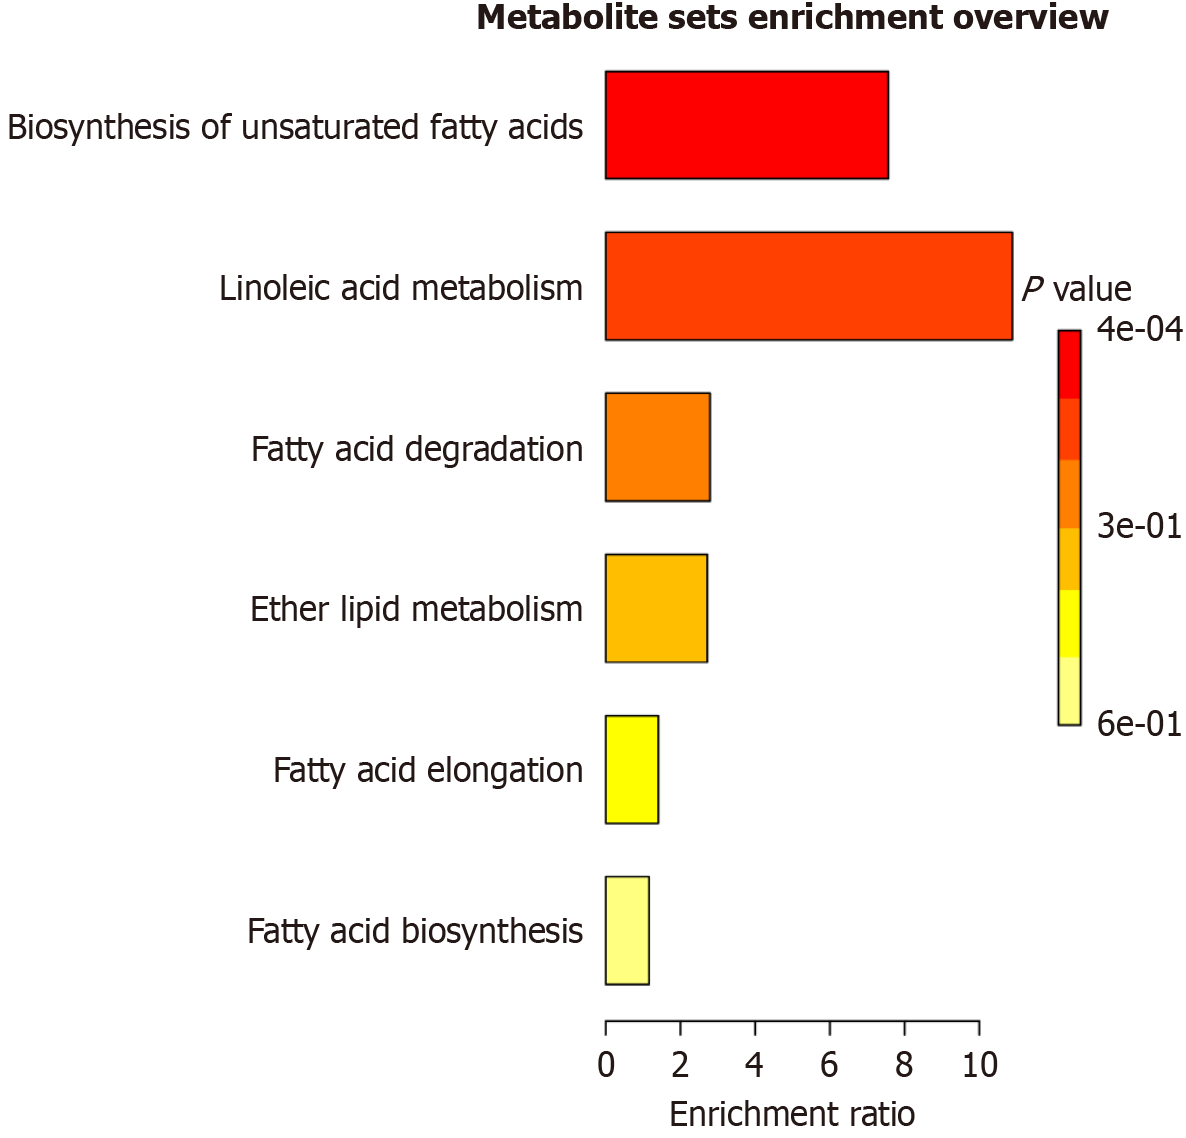
Following OPLS-DA analysis, differential metabolites were selected by a combination of variable importance in projection (VIP) values and t-tests. The selection criteria were set to satisfy VIP > 1 and P < 0.05. The selected metabolites were cross-referenced against the HMDB database. Ultimately, 65 potential differentially expressed metabolites were identified in lean-type MAFLD patients. Of those, 33 were identified in the positive mode and 32 in the negative modes (Figure 4). Metabolic pathway enrichment analysis of the identified metabolites with MetaboAnalyst 5.0 found that the 65 metabolites were associated with pathways involving unsaturated fatty acid biosynthesis, LA metabolism, fatty acid degradation, and ether lipid metabolism. Significant differences were found in the pathways of unsaturated fatty-acid biosynthesis and LA metabolism (Figure 5). A targeted metabolomic analysis of fatty acids was performed to gain a deeper understanding of the significance of fatty-acid metabolism in lean-type MAFLD patients.
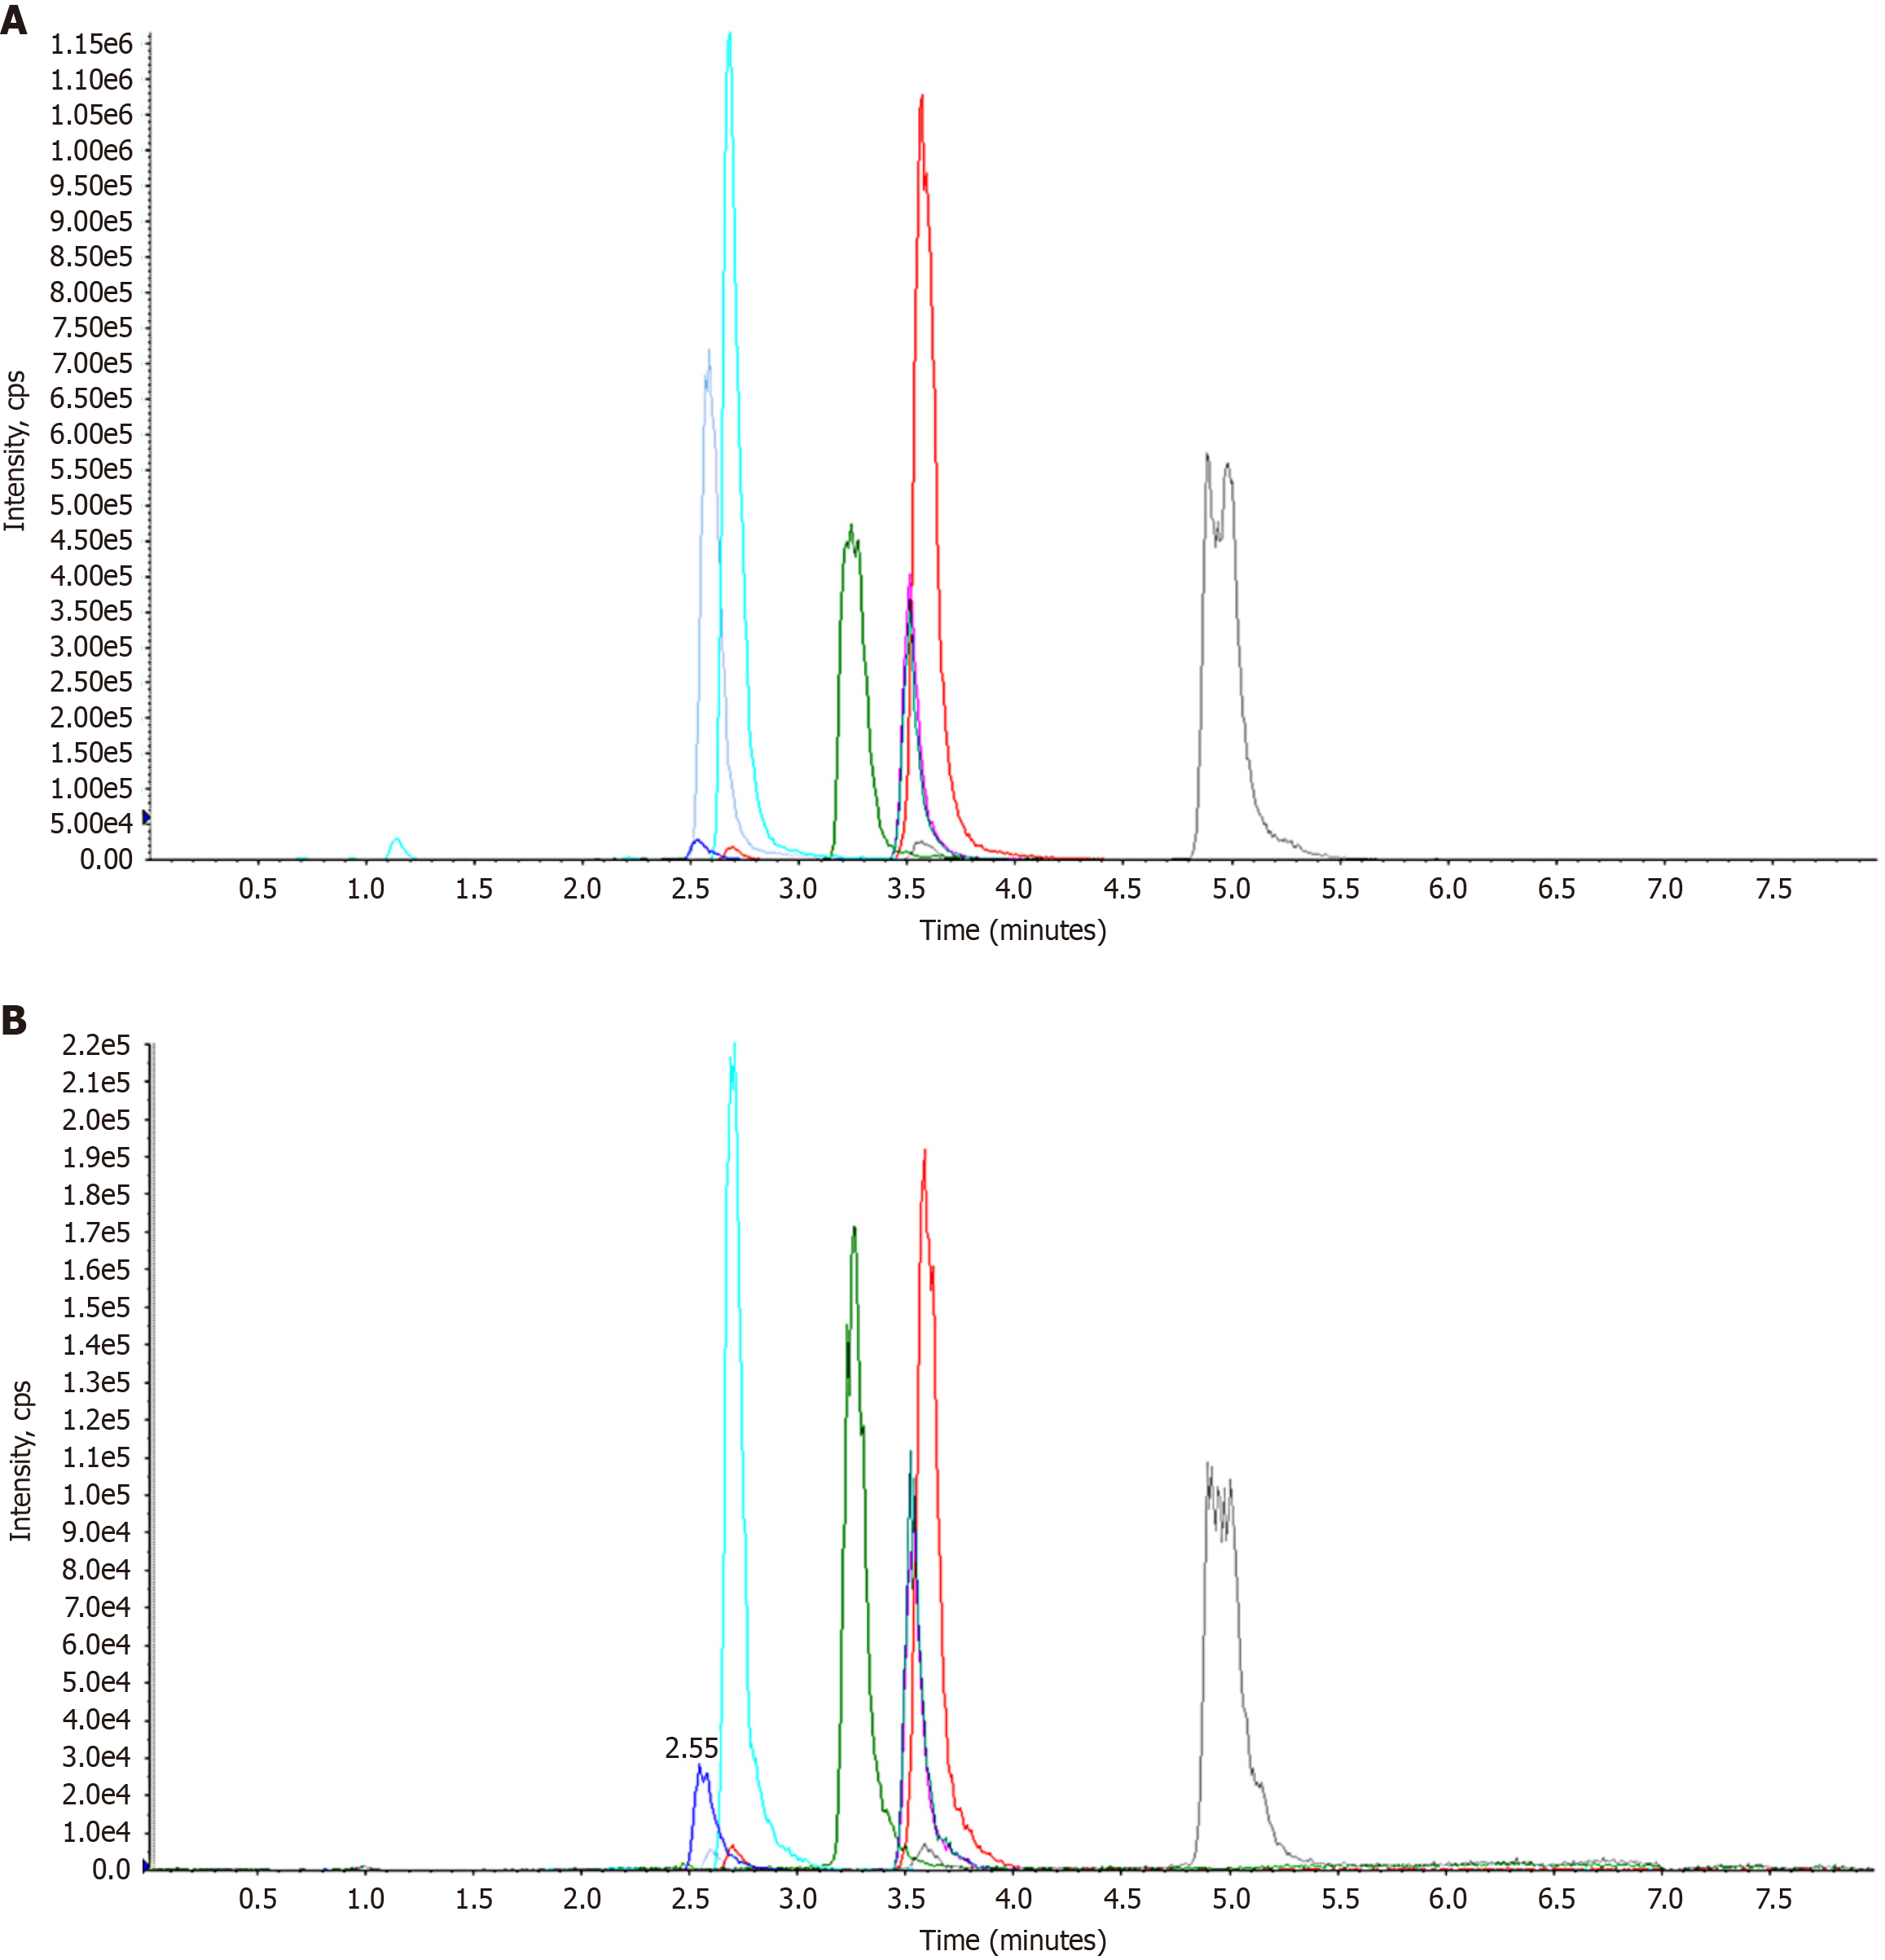
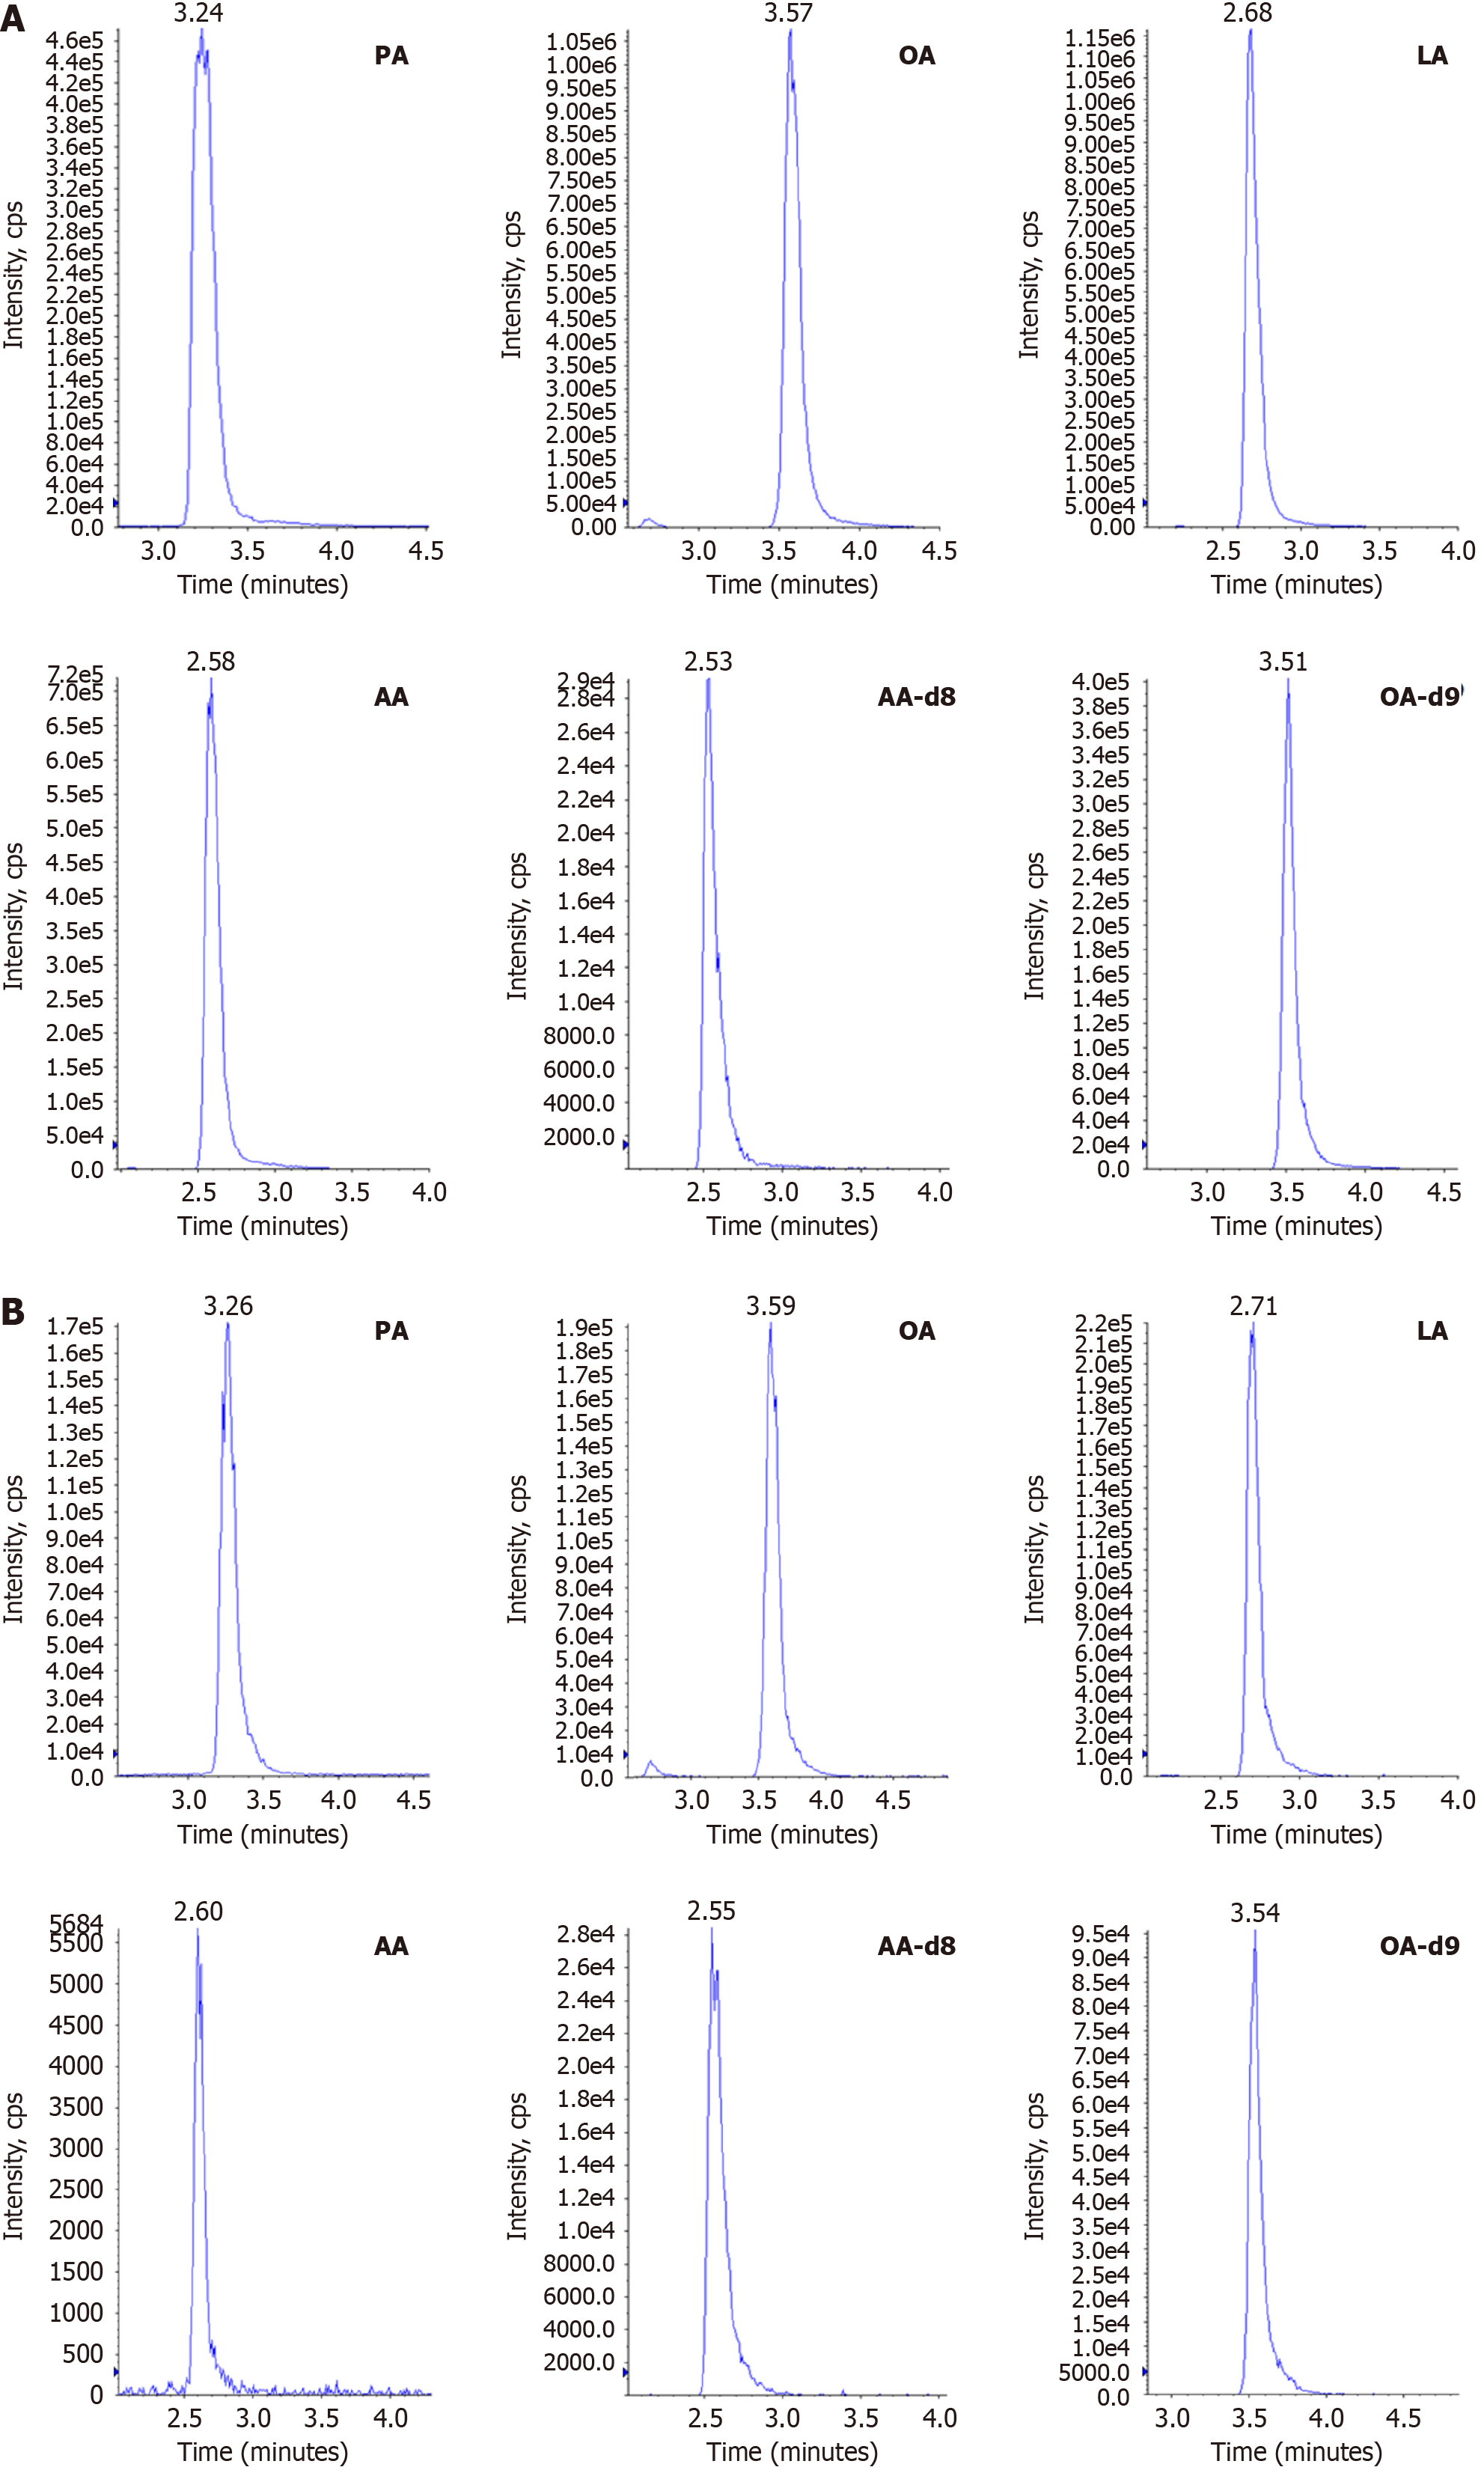
To construct the standard curve, an increasing concentration (μg/mL) series of mixed fatty-acid standards was sequentially injected, with the peak area plotted on the Y-axis. The linear range and correlation coefficients (r) are listed in Table 3. The results show that the standard curve had excellent linearity and was suitable for the quantitative detection of fatty acids in the samples. The multiple reaction monitoring chromatograms of the samples and standards are shown in Figures 6 and 7, and the results indicate that there was no interference from other matrices in the content detection of the samples.
| No. | Name | Linear | Range in μg/mL | r |
| 1 | Arachidonic acid | y = 0.0087x - 0.0053 | 0.1-5 | 0.9963 |
| 2 | Oleic acid | y = 0.0272x - 0.0425 | 0.1-5 | 0.9914 |
| 3 | Palmitic acid | y = 0.0074x + 0.0036 | 0.1-5 | 0.9940 |
| 4 | Linoleic acid | y = 0.0341x - 0.0821 | 0.1-5 | 0.9919 |
Changes in the fatty-acid content of lean-type MAFLD patients and healthy individuals are shown in Table 4. The PA, OA, LA, and AA levels in lean-type MAFLD patients were 3.41 ± 0.84, 2.63 ± 1.45, 2.42 ± 1.18, and 2.45 ± 1.21 μg/mL, respectively, and were significantly higher than those in the control group (P < 0.05).
Obesity and type 2 diabetes were prevalent in MAFLD patients, and approximately 40.8% of MAFLD patients had BMIs below threshold for overweight or obese MAFLD (< 23 kg/m2), referred to as lean-type MAFLD. According to epidemiological surveys, lean-type MAFLD accounts for 25.8% of all MAFLD cases globally, but accounts for 44.3% of the MAFLD cases in China[14]. Owing to its subtle onset, mild, or nonspecific symptoms, the diagnosis of lean-type MAFLD is challenging and is often diagnosed during routine liver function testing or imaging examination. Current research predominantly focuses on obese-type MAFLD, with limited studies on lean-type patients. This study used serum metabolomics to investigate biomarkers characteristic of lean-type MAFLD patients and performed a quantitative analysis.
In this study, the lean-type MAFLD patients had BMIs of < 23 kg/m2, and had higher BMIs and body mass than healthy lean participants. Compared with healthy controls, lean-type MAFLD patients had significantly elevated white blood cell counts (P < 0.01). Additionally, significant differences were observed in liver and kidney function indexes and lipid profile components, such as urea nitrogen, uric acid, creatinine, cholinesterase, ALT, fasting blood glucose, HDL, triglycerides, and APOA-1 (P < 0.01).
ALT is present in hepatic cell cytoplasm, where increased intracellular triglycerides in provide sufficient reactive substrates for lipid peroxidation, thereby affecting the activity of antioxidant enzymes. This leads to increased oxidative stress. When liver cells are damaged, intracellular enzymes are released into the blood, causing ALT to spill over from liver cells into the extracellular space, resulting in increased ALT in the peripheral blood. Therefore, ALT levels reflect the integrity of liver cells. In this study, ALT and triglyceride levels were significantly higher in lean-type MAFLD patients than they were in healthy lean controls (P < 0.01). Accumulation of excess lipids in liver cells is a crucial factor that leads to hepatocyte degeneration and inflammation. Therefore, effective lipid transport and reduction in lipid synthesis may be crucial for the prevention and treatment of fatty liver disease. APOA-1, the primary apolipoprotein in HDL, is involved in cholesterol transport[15]. Mice with APOA-1 deficiency cannot form normal HDL particles, resulting in decreased cholesterol transport to liver tissue and cholesterol accumulation[16], which is consistent with our finding that APOA-1 levels were lower in lean-type MAFLD patients than in lean healthy controls, whereas triglyceride levels were signi
Metabolomics is a high-throughput detection method that reflects disease status by the overall biochemical phenotype. It allows the examination of changes in endogenous metabolites at the macroscopic level following exposure to biological stimuli. By analyzing comprehensive metabolic profiles, it is possible to identify disease-associated metabolites and reveal their metabolic pathways. In our study, serum metabolomics and liquid chromatography coupled with triple quadrupole mass spectrometry were used to investigate biomarkers specicic to lean-type MAFLD. Using a VIP > 1 and
Additionally, quantitative lipidomic analysis of four specific biomarkers revealed significant increases in the serum level of PA, OA, LA, and AA in lean-type MAFLD patients (P < 0.05), which were 2.23, 2.09, 1.86, and 1.98 times higher, respectively, than those in healthy individuals. FAs are components of triglycerides. Approximately 60 types of fatty acids have been identified in the plasma and tissues. However, only a few of them can be absorbed and used by the human body[18]. The homeostasis of body fatty acids ensures normal functioning.
FAs have a crucial role in lipid metabolism, but studies of their role in lean-type MAFLD patients are lacking. Current research indicates a close association between fatty acids and metabolic disorders, in which elevated levels of PA, palmitoleic acid, and LA are positively correlated with the onset and progression of MAFLD[19]. A study by Gambino et al[20] compared the changes in serum free FAs in MAFLD patients and in healthy controls, and reported significant increases in the serum level of free LA, OA, and AA. A plasma lipidomics study by Puri et al[21] reported significantly higher levels of PA, OA, and LA in MAFLD and nonalcoholic steatohepatitis patients, than in healthy individuals, but found no significant changes in AA. These findings align broadly with our research findings and, to a certain extent, reflect the serum levels of PA, OA, LA, and AA in lean-type MAFLD patients.
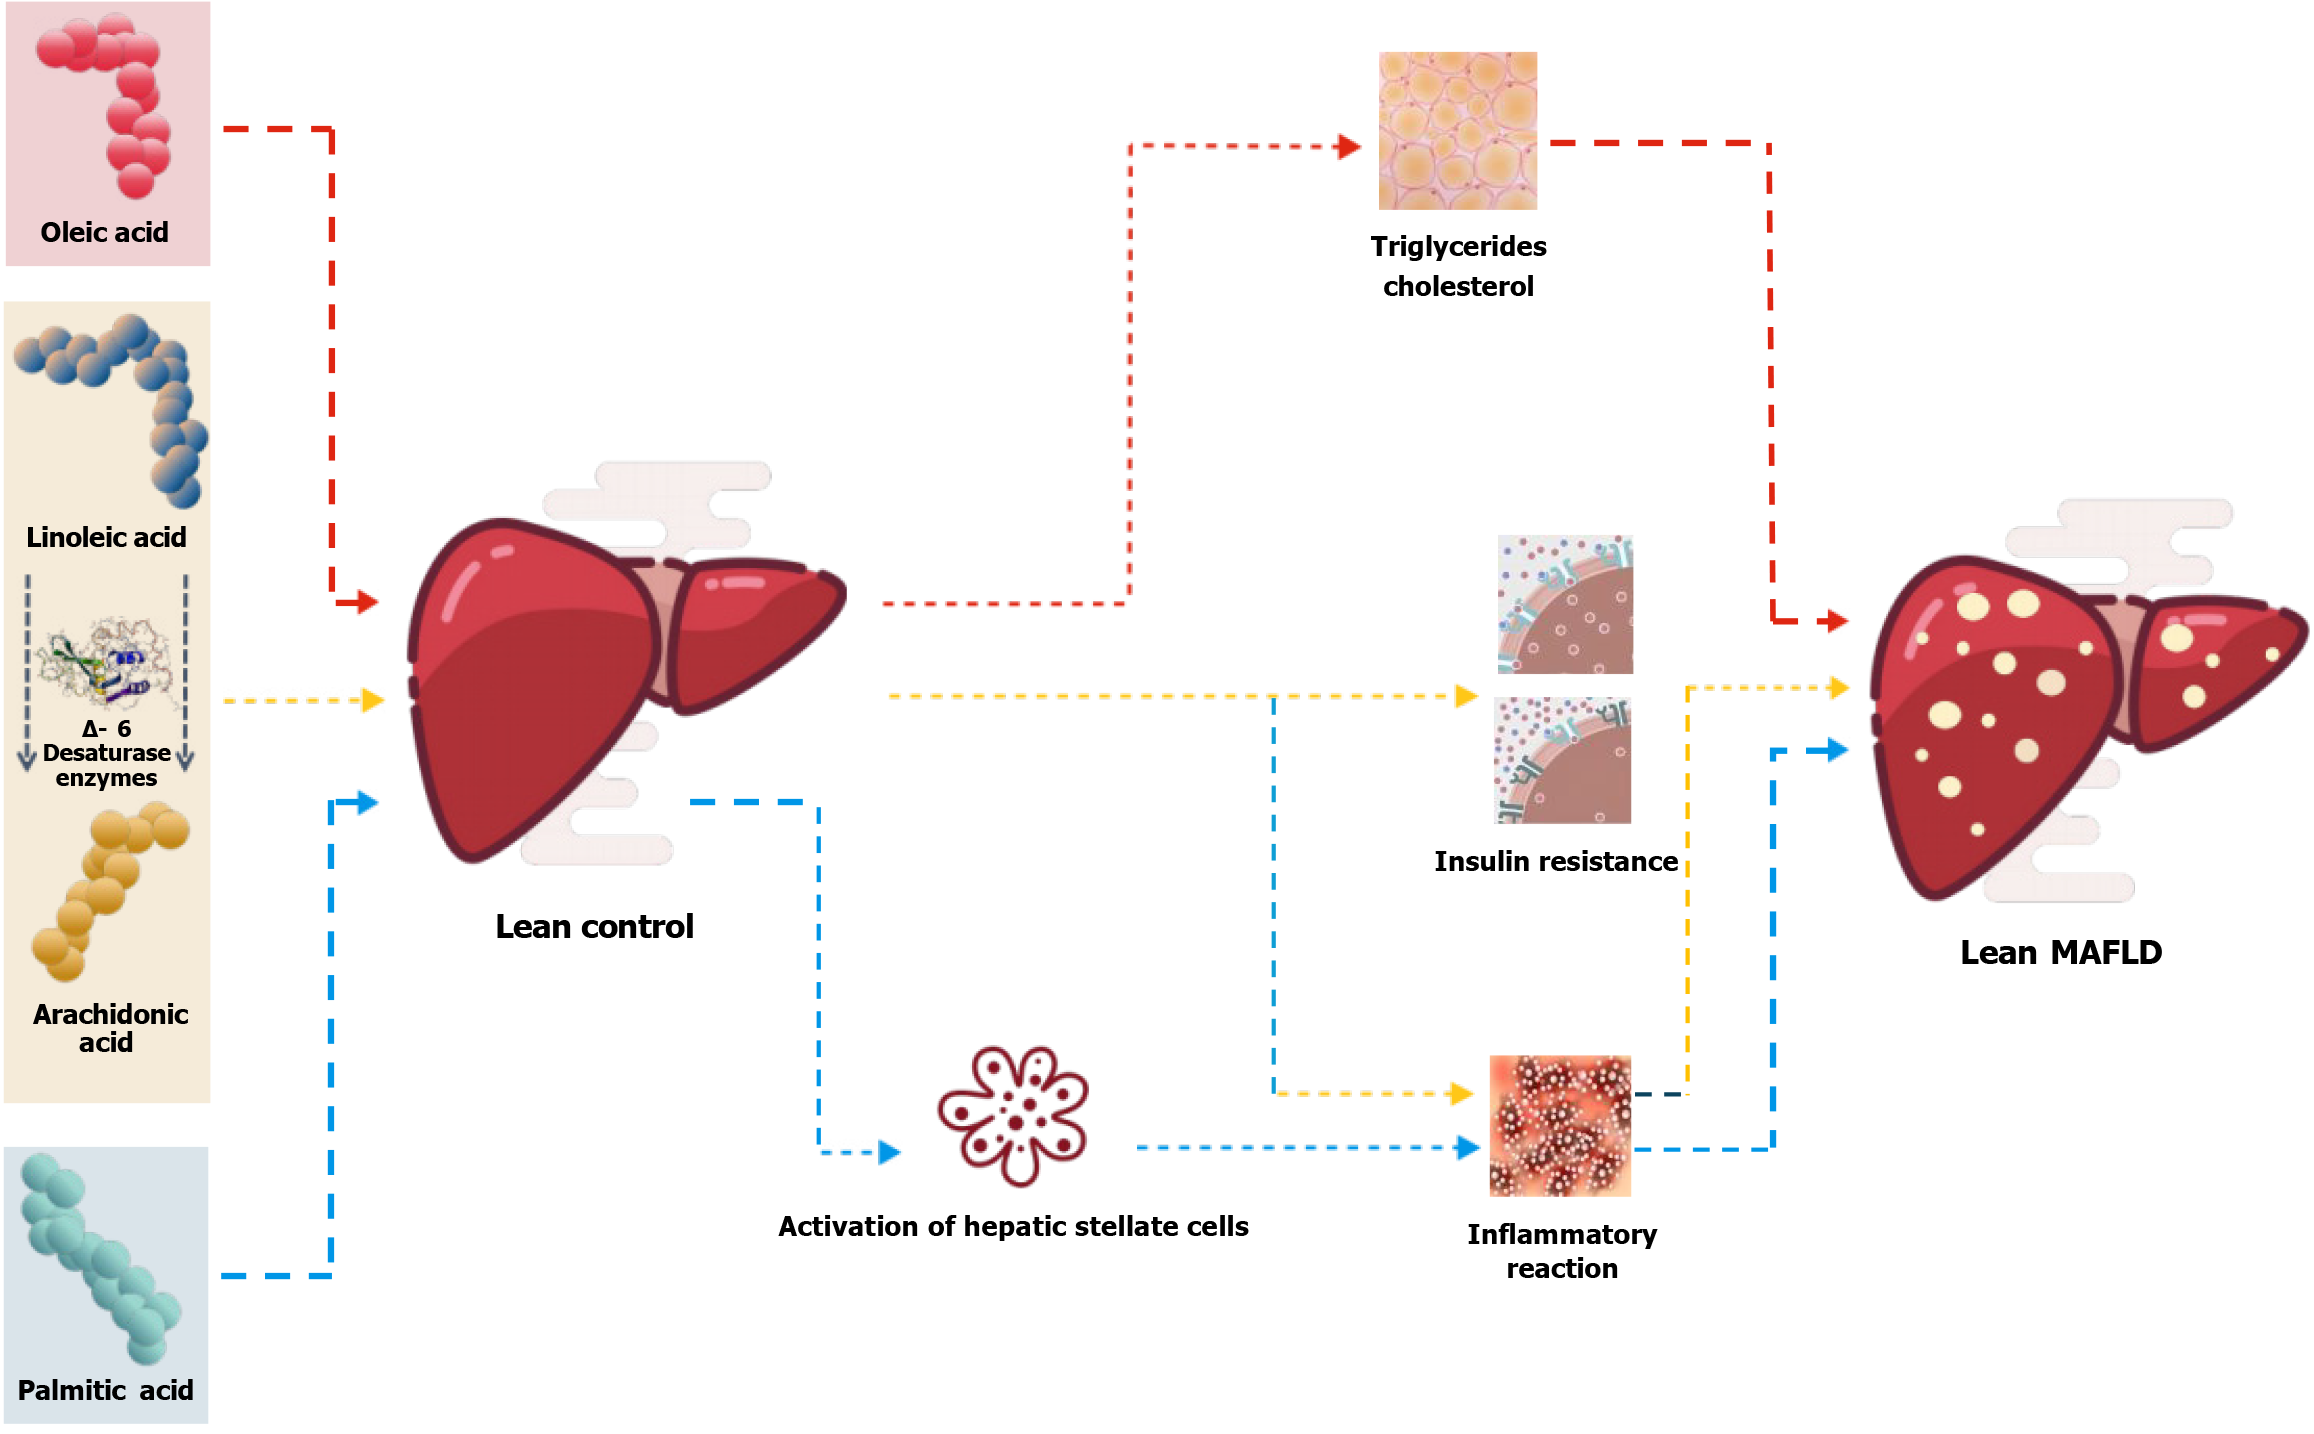
AA is a fatty-acid present in the cell membrane and is involved in cellular signal transduction during various inflammatory responses[22]. Abnormalities of FA metabolism disrupt the balance between the release and uptake of FAs in serum, leading to increased FA generation and reduced re-esterification capability. This eventually causes the accumulation of serum FAs, resulting in lipotoxicity and subsequent damage to the cardiovascular, endocrine, and digestive systems[23]. These studies indicate that abnormal FA metabolism in lean-type MAFLD patients significantly increases the likelihood of developing metabolic disorders. Based on existing research, we believe that elevated serum levels of PA and OA are directly associated with the occurrence of lean-type MAFLD, and that increased LA and AA levels are linked to the progression of MAFLD. In addition, PA promotes hepatic stellate cell activation, increases extracellular matrix deposition in MAFLD rats[24], induces podocyte apoptosis[25], and contributes to inflammation[26]. OA is a monounsaturated FA and is the preferred substrate for synthesizing triglycerides and cholesterol esters, and can induce hepatic cell steatosis and enhance tumor invasiveness[27]. LA is an essential FA that cannot be synthesized in the body and must be obtained from dietary sources. LA is converted to AA enzymes, such as Δ-6 desaturase (Figure 8).
Serum-targeted metabolomics found that fatty-acid metabolism was impaired in lean-type MAFLD patients. The biomarkers identified in this study potentially provide insights into the treatment of lean-type MAFLD. The study results warrant further investigation but are limited by the small sample size.
Special thanks to each of the authors for their contributions to this manuscript.
| 1. | Fan JG. Epidemiology of alcoholic and nonalcoholic fatty liver disease in China. J Gastroenterol Hepatol. 2013;28 Suppl 1:11-17. [RCA] [PubMed] [DOI] [Full Text] [Cited by in Crossref: 208] [Cited by in RCA: 213] [Article Influence: 17.8] [Reference Citation Analysis (2)] |
| 2. | Estes C, Anstee QM, Arias-Loste MT, Bantel H, Bellentani S, Caballeria J, Colombo M, Craxi A, Crespo J, Day CP, Eguchi Y, Geier A, Kondili LA, Kroy DC, Lazarus JV, Loomba R, Manns MP, Marchesini G, Nakajima A, Negro F, Petta S, Ratziu V, Romero-Gomez M, Sanyal A, Schattenberg JM, Tacke F, Tanaka J, Trautwein C, Wei L, Zeuzem S, Razavi H. Modeling NAFLD disease burden in China, France, Germany, Italy, Japan, Spain, United Kingdom, and United States for the period 2016-2030. J Hepatol. 2018;69:896-904. [RCA] [PubMed] [DOI] [Full Text] [Cited by in Crossref: 776] [Cited by in RCA: 1309] [Article Influence: 187.0] [Reference Citation Analysis (0)] |
| 3. | Hao XY, Zhang K, Huang XY, Yang F, Sun SY. Muscle strength and non-alcoholic fatty liver disease/metabolic-associated fatty liver disease. World J Gastroenterol. 2024;30:636-643. [RCA] [PubMed] [DOI] [Full Text] [Full Text (PDF)] [Cited by in CrossRef: 8] [Cited by in RCA: 9] [Article Influence: 9.0] [Reference Citation Analysis (0)] |
| 4. | Ke Y, Xu C, Lin J, Li Y. Role of Hepatokines in Non-alcoholic Fatty Liver Disease. J Transl Int Med. 2019;7:143-148. [RCA] [PubMed] [DOI] [Full Text] [Full Text (PDF)] [Cited by in Crossref: 34] [Cited by in RCA: 37] [Article Influence: 6.2] [Reference Citation Analysis (0)] |
| 5. | Castera L, Pinzani M. Non-invasive assessment of liver fibrosis: are we ready? Lancet. 2010;375:1419-1420. [RCA] [PubMed] [DOI] [Full Text] [Cited by in Crossref: 98] [Cited by in RCA: 95] [Article Influence: 6.3] [Reference Citation Analysis (0)] |
| 6. | Alkhouri N, Feldstein AE. Noninvasive diagnosis of nonalcoholic fatty liver disease: Are we there yet? Metabolism. 2016;65:1087-1095. [RCA] [PubMed] [DOI] [Full Text] [Cited by in Crossref: 48] [Cited by in RCA: 52] [Article Influence: 5.8] [Reference Citation Analysis (0)] |
| 7. | Kim D, Kim WR. Nonobese Fatty Liver Disease. Clin Gastroenterol Hepatol. 2017;15:474-485. [RCA] [PubMed] [DOI] [Full Text] [Cited by in Crossref: 278] [Cited by in RCA: 261] [Article Influence: 32.6] [Reference Citation Analysis (1)] |
| 8. | Liu CJ. Prevalence and risk factors for non-alcoholic fatty liver disease in Asian people who are not obese. J Gastroenterol Hepatol. 2012;27:1555-1560. [RCA] [PubMed] [DOI] [Full Text] [Cited by in Crossref: 136] [Cited by in RCA: 163] [Article Influence: 12.5] [Reference Citation Analysis (0)] |
| 9. | Alam S, Jahid Hasan M, Khan MAS, Alam M, Hasan N. Effect of Weight Reduction on Histological Activity and Fibrosis of Lean Nonalcoholic Steatohepatitis Patient. J Transl Int Med. 2019;7:106-114. [RCA] [PubMed] [DOI] [Full Text] [Full Text (PDF)] [Cited by in Crossref: 27] [Cited by in RCA: 28] [Article Influence: 4.7] [Reference Citation Analysis (0)] |
| 10. | Leung JC, Loong TC, Wei JL, Wong GL, Chan AW, Choi PC, Shu SS, Chim AM, Chan HL, Wong VW. Histological severity and clinical outcomes of nonalcoholic fatty liver disease in nonobese patients. Hepatology. 2017;65:54-64. [RCA] [PubMed] [DOI] [Full Text] [Cited by in Crossref: 195] [Cited by in RCA: 276] [Article Influence: 34.5] [Reference Citation Analysis (0)] |
| 11. | Sookoian S, Pirola CJ. Systematic review with meta-analysis: risk factors for non-alcoholic fatty liver disease suggest a shared altered metabolic and cardiovascular profile between lean and obese patients. Aliment Pharmacol Ther. 2017;46:85-95. [RCA] [PubMed] [DOI] [Full Text] [Cited by in Crossref: 114] [Cited by in RCA: 173] [Article Influence: 21.6] [Reference Citation Analysis (0)] |
| 12. | Qiu S, Cai Y, Yao H, Lin C, Xie Y, Tang S, Zhang A. Small molecule metabolites: discovery of biomarkers and therapeutic targets. Signal Transduct Target Ther. 2023;8:132. [RCA] [PubMed] [DOI] [Full Text] [Full Text (PDF)] [Cited by in Crossref: 168] [Cited by in RCA: 338] [Article Influence: 169.0] [Reference Citation Analysis (0)] |
| 13. | Wang AY, Dhaliwal J, Mouzaki M. Lean non-alcoholic fatty liver disease. Clin Nutr. 2019;38:975-981. [RCA] [PubMed] [DOI] [Full Text] [Cited by in Crossref: 53] [Cited by in RCA: 79] [Article Influence: 11.3] [Reference Citation Analysis (0)] |
| 14. | Ye Q, Zou B, Yeo YH, Li J, Huang DQ, Wu Y, Yang H, Liu C, Kam LY, Tan XXE, Chien N, Trinh S, Henry L, Stave CD, Hosaka T, Cheung RC, Nguyen MH. Global prevalence, incidence, and outcomes of non-obese or lean non-alcoholic fatty liver disease: a systematic review and meta-analysis. Lancet Gastroenterol Hepatol. 2020;5:739-752. [RCA] [PubMed] [DOI] [Full Text] [Cited by in Crossref: 289] [Cited by in RCA: 569] [Article Influence: 113.8] [Reference Citation Analysis (0)] |
| 15. | Ma D, Liu W, Wang Y. ApoA-I or ABCA1 expression suppresses fatty acid synthesis by reducing 27-hydroxycholesterol levels. Biochimie. 2014;103:101-108. [RCA] [PubMed] [DOI] [Full Text] [Cited by in Crossref: 23] [Cited by in RCA: 29] [Article Influence: 2.6] [Reference Citation Analysis (0)] |
| 16. | Li CX, Chen LL, Li XC, Ng KT, Yang XX, Lo CM, Guan XY, Man K. ApoA-1 accelerates regeneration of small-for-size fatty liver graft after transplantation. Life Sci. 2018;215:128-135. [RCA] [PubMed] [DOI] [Full Text] [Cited by in Crossref: 16] [Cited by in RCA: 12] [Article Influence: 1.7] [Reference Citation Analysis (0)] |
| 17. | Katoh S, Peltonen M, Wada T, Zeniya M, Sakamoto Y, Utsunomiya K, Tuomilehto J. Fatty liver and serum cholinesterase are independently correlated with HbA1c levels: cross-sectional analysis of 5384 people. J Int Med Res. 2014;42:542-553. [RCA] [PubMed] [DOI] [Full Text] [Cited by in Crossref: 8] [Cited by in RCA: 15] [Article Influence: 1.4] [Reference Citation Analysis (0)] |
| 18. | Tvrzicka E, Kremmyda LS, Stankova B, Zak A. Fatty acids as biocompounds: their role in human metabolism, health and disease--a review. Part 1: classification, dietary sources and biological functions. Biomed Pap Med Fac Univ Palacky Olomouc Czech Repub. 2011;155:117-130. [RCA] [PubMed] [DOI] [Full Text] [Cited by in Crossref: 176] [Cited by in RCA: 232] [Article Influence: 17.8] [Reference Citation Analysis (0)] |
| 19. | Park H, Hasegawa G, Shima T, Fukui M, Nakamura N, Yamaguchi K, Mitsuyoshi H, Minami M, Yasui K, Itoh Y, Yoshikawa T, Kitawaki J, Ohta M, Obayashi H, Okanoue T. The fatty acid composition of plasma cholesteryl esters and estimated desaturase activities in patients with nonalcoholic fatty liver disease and the effect of long-term ezetimibe therapy on these levels. Clin Chim Acta. 2010;411:1735-1740. [RCA] [PubMed] [DOI] [Full Text] [Cited by in Crossref: 32] [Cited by in RCA: 36] [Article Influence: 2.4] [Reference Citation Analysis (0)] |
| 20. | Gambino R, Bugianesi E, Rosso C, Mezzabotta L, Pinach S, Alemanno N, Saba F, Cassader M. Different Serum Free Fatty Acid Profiles in NAFLD Subjects and Healthy Controls after Oral Fat Load. Int J Mol Sci. 2016;17:479. [RCA] [PubMed] [DOI] [Full Text] [Full Text (PDF)] [Cited by in Crossref: 55] [Cited by in RCA: 80] [Article Influence: 8.9] [Reference Citation Analysis (0)] |
| 21. | Puri P, Wiest MM, Cheung O, Mirshahi F, Sargeant C, Min HK, Contos MJ, Sterling RK, Fuchs M, Zhou H, Watkins SM, Sanyal AJ. The plasma lipidomic signature of nonalcoholic steatohepatitis. Hepatology. 2009;50:1827-1838. [RCA] [PubMed] [DOI] [Full Text] [Cited by in Crossref: 463] [Cited by in RCA: 521] [Article Influence: 32.6] [Reference Citation Analysis (0)] |
| 22. | Tallima H, El Ridi R. Arachidonic acid: Physiological roles and potential health benefits - A review. J Adv Res. 2018;11:33-41. [RCA] [PubMed] [DOI] [Full Text] [Full Text (PDF)] [Cited by in Crossref: 226] [Cited by in RCA: 398] [Article Influence: 49.8] [Reference Citation Analysis (0)] |
| 23. | Pavithra N, Bannikoppa PS, Uthappa S, Kurpad AV, Mani I. Plasma Fatty Acid Composition and Estimated Desaturase Activities Reflect Dietary Patterns in Subjects with Metabolic Syndrome. Indian J Clin Biochem. 2018;33:290-296. [RCA] [PubMed] [DOI] [Full Text] [Cited by in Crossref: 1] [Cited by in RCA: 4] [Article Influence: 0.6] [Reference Citation Analysis (0)] |
| 24. | Hanayama M, Yamamoto Y, Utsunomiya H, Yoshida O, Liu S, Mogi M, Matsuura B, Takeshita E, Ikeda Y, Hiasa Y. The mechanism of increased intestinal palmitic acid absorption and its impact on hepatic stellate cell activation in nonalcoholic steatohepatitis. Sci Rep. 2021;11:13380. [RCA] [PubMed] [DOI] [Full Text] [Full Text (PDF)] [Cited by in Crossref: 2] [Cited by in RCA: 9] [Article Influence: 2.3] [Reference Citation Analysis (0)] |
| 25. | Xiang XY, Liu T, Wu Y, Jiang XS, He JL, Chen XM, Du XG. Berberine alleviates palmitic acidinduced podocyte apoptosis by reducing reactive oxygen speciesmediated endoplasmic reticulum stress. Mol Med Rep. 2021;23. [RCA] [PubMed] [DOI] [Full Text] [Full Text (PDF)] [Cited by in Crossref: 4] [Cited by in RCA: 19] [Article Influence: 3.8] [Reference Citation Analysis (0)] |
| 26. | Chen J, Li L, Zhou Y, Zhang J, Chen L. Gambogic acid ameliorates high glucose- and palmitic acid-induced inflammatory response in ARPE-19 cells via activating Nrf2 signaling pathway: ex vivo. Cell Stress Chaperones. 2021;26:367-375. [RCA] [PubMed] [DOI] [Full Text] [Cited by in Crossref: 17] [Cited by in RCA: 21] [Article Influence: 5.3] [Reference Citation Analysis (0)] |
| 27. | Song H, Yang R, Zhang J, Sun P, Xing X, Wang L, Sairijima T, Hu Y, Liu Y, Cheng H, Zhang Q, Li L. Oleic acid-induced steatosis model establishment in LMH cells and its effect on lipid metabolism. Poult Sci. 2023;102:102297. [RCA] [PubMed] [DOI] [Full Text] [Full Text (PDF)] [Cited by in Crossref: 1] [Cited by in RCA: 10] [Article Influence: 5.0] [Reference Citation Analysis (0)] |


