Published online Dec 21, 2021. doi: 10.3748/wjg.v27.i47.8156
Peer-review started: April 18, 2021
First decision: June 13, 2021
Revised: June 15, 2021
Accepted: September 19, 2021
Article in press: September 19, 2021
Published online: December 21, 2021
Processing time: 242 Days and 20.3 Hours
Bile duct ligation (BDL) in animals is a classical method for mimicking cholestatic fibrosis. Although different surgical techniques have been described in rats and rabbits, mouse models can be more cost-effective and reproducible for investigating cholestatic fibrosis. Magnetic resonance imaging (MRI) has made great advances for noninvasive assessment of liver fibrosis. More comprehensive liver fibrotic features of BDL on MRI are important. However, the utility of multi
To evaluate the correlation between the pathological changes and multiparameter MRI characteristics of liver fibrosis in a BDL mouse model.
Twenty-eight healthy adult male balb/c mice were randomly divided into four groups: sham, week 2 BDL, week 4 BDL, and week 6 BDL. Multiparameter MRI sequences, included magnetic resonance cholangiopancreatography, T1-weighted, T2-weighted, T2 mapping, and pre- and post-enhanced T1 mapping, were performed after sham and BDL surgery. Peripheral blood and liver tissue were collected after MRI. For statistical analysis, Student’s t-test and Pearson’s correlation coefficient were used.
Four mice died after BDL surgery; seven, six, five and six mice were included separately from the four groups. Signal intensities of liver parenchyma showed no difference on TI- and T2-weighted images. Bile duct volume, ΔT1 value, T2 value, and the rate of liver fibrosis increased steadily in week 2 BDL, week 4 BDL and week 6 BDL groups compared with those in the sham group (P < 0.01). Alanine aminotransferase and aspartate transaminase levels initially surged after surgery, followed by a gradual decline over time. Strong correlations were found between bile duct volume (r = 0.84), T2 value (r = 0.78), ΔT1 value (r = 0.62), and hepatic fibrosis rate (all P < 0.01) in the BDL groups.
The BDL mouse model induces changes that can be observed on MRI. The MRI parameters correlate with the hepatic fibrosis rate and allow for detection of cholestatic fibrosis.
Core tip: Magnetic resonance imaging (MRI) is promising for the noninvasive assessment of liver fibrosis, but the utility of multiparameter MRI in the bile duct ligation (BDL) mouse model has not been assessed. We established an experimental BDL mouse model that mimicked various aspects of cholestatic fibrosis and evaluated the potential of multiparameter MRI for the assessment of cholestatic fibrosis. We found that the BDL mouse model induced a complex cascade of changes that were observed clearly on MRI. The T2 and ΔT1 values were well correlated with the hepatic fibrosis rate and may allow for the detection of cholestatic fibrosis.
- Citation: Liu JY, Ding ZY, Zhou ZY, Dai SZ, Zhang J, Li H, Du Q, Cai YY, Shang QL, Luo YH, Xiao EH. Multiparameter magnetic resonance imaging of liver fibrosis in a bile duct ligation mouse model. World J Gastroenterol 2021; 27(47): 8156-8165
- URL: https://www.wjgnet.com/1007-9327/full/v27/i47/8156.htm
- DOI: https://dx.doi.org/10.3748/wjg.v27.i47.8156
An appropriate animal model and a reliable detection tool are crucial for investigating liver fibrosis. Cholestatic fibrosis, one of the main types of liver fibrosis, is a widespread disease with broad etiologies including genetics, immunity, infection, calculi, and tumors[1]. Obstruction of the biliary system induces a complex cascade of pathological and functional changes that leads to cholestatic fibrosis. Therefore, bile duct ligation (BDL) in animals has become a classical method for mimicking cholestatic fibrosis. In recent years, different surgical techniques have been described in rats and rabbits[2-4]. However, long-term experiments with rats or rabbits require a considerable work force, materials, and financial resources. The mouse has become the most popular experimental animal because of its higher genetic similarity with humans, lower cost, and more human-like responses to pathophysiological changes[5]. With careful surgical technique and the 3R rule for laboratory animals, the BDL mouse model can be more cost-effective and reproducible when subjected to the same conditions as the rat or rabbit models. The BDL mouse model may be the better choice for investigating cholestatic fibrosis.
Liver biopsy, with its invasiveness and subsequent related complications, is not suitable for screening and long-term monitoring in experimental animals[6]. Magnetic resonance imaging (MRI) is a promising tool for noninvasive assessment of liver fibrosis[7]. During the past decade, MRI has made great advances, and many versatile and powerful MRI sequences and methods have been widely applied, such as T1 mapping[8] and T2 mapping[9]. However, more comprehensive liver fibrotic features on MR images, including radiological, quantitative and analytical aspects, are important. To the best of our knowledge, this has not been described in the BDL mouse model. Thus, it is appropriate to seek an effective way to evaluate the relationship between BDL mouse models and reliable MRI techniques accurately, particularly for noninvasive monitoring of liver fibrosis.
We hypothesized that the BDL mouse model can be noninvasively characterized radiologically using an MR imager and further validated with radiological, quantitative and analytical aspects. Accordingly, the purpose of our study was to establish and characterize the BDL mouse model and evaluate the correlation between the characteristics of hepatic fibrosis seen in MR images with both the pathological changes of liver fibrosis and the biochemical results matched with the histological specimens.
The protocol of our study was approved by the Animal Care and Use Committee of the Second Xiangya Hospital of Central South University (2020495). All experiments were conducted in strict accordance with the Chinese law and institutional guidelines.
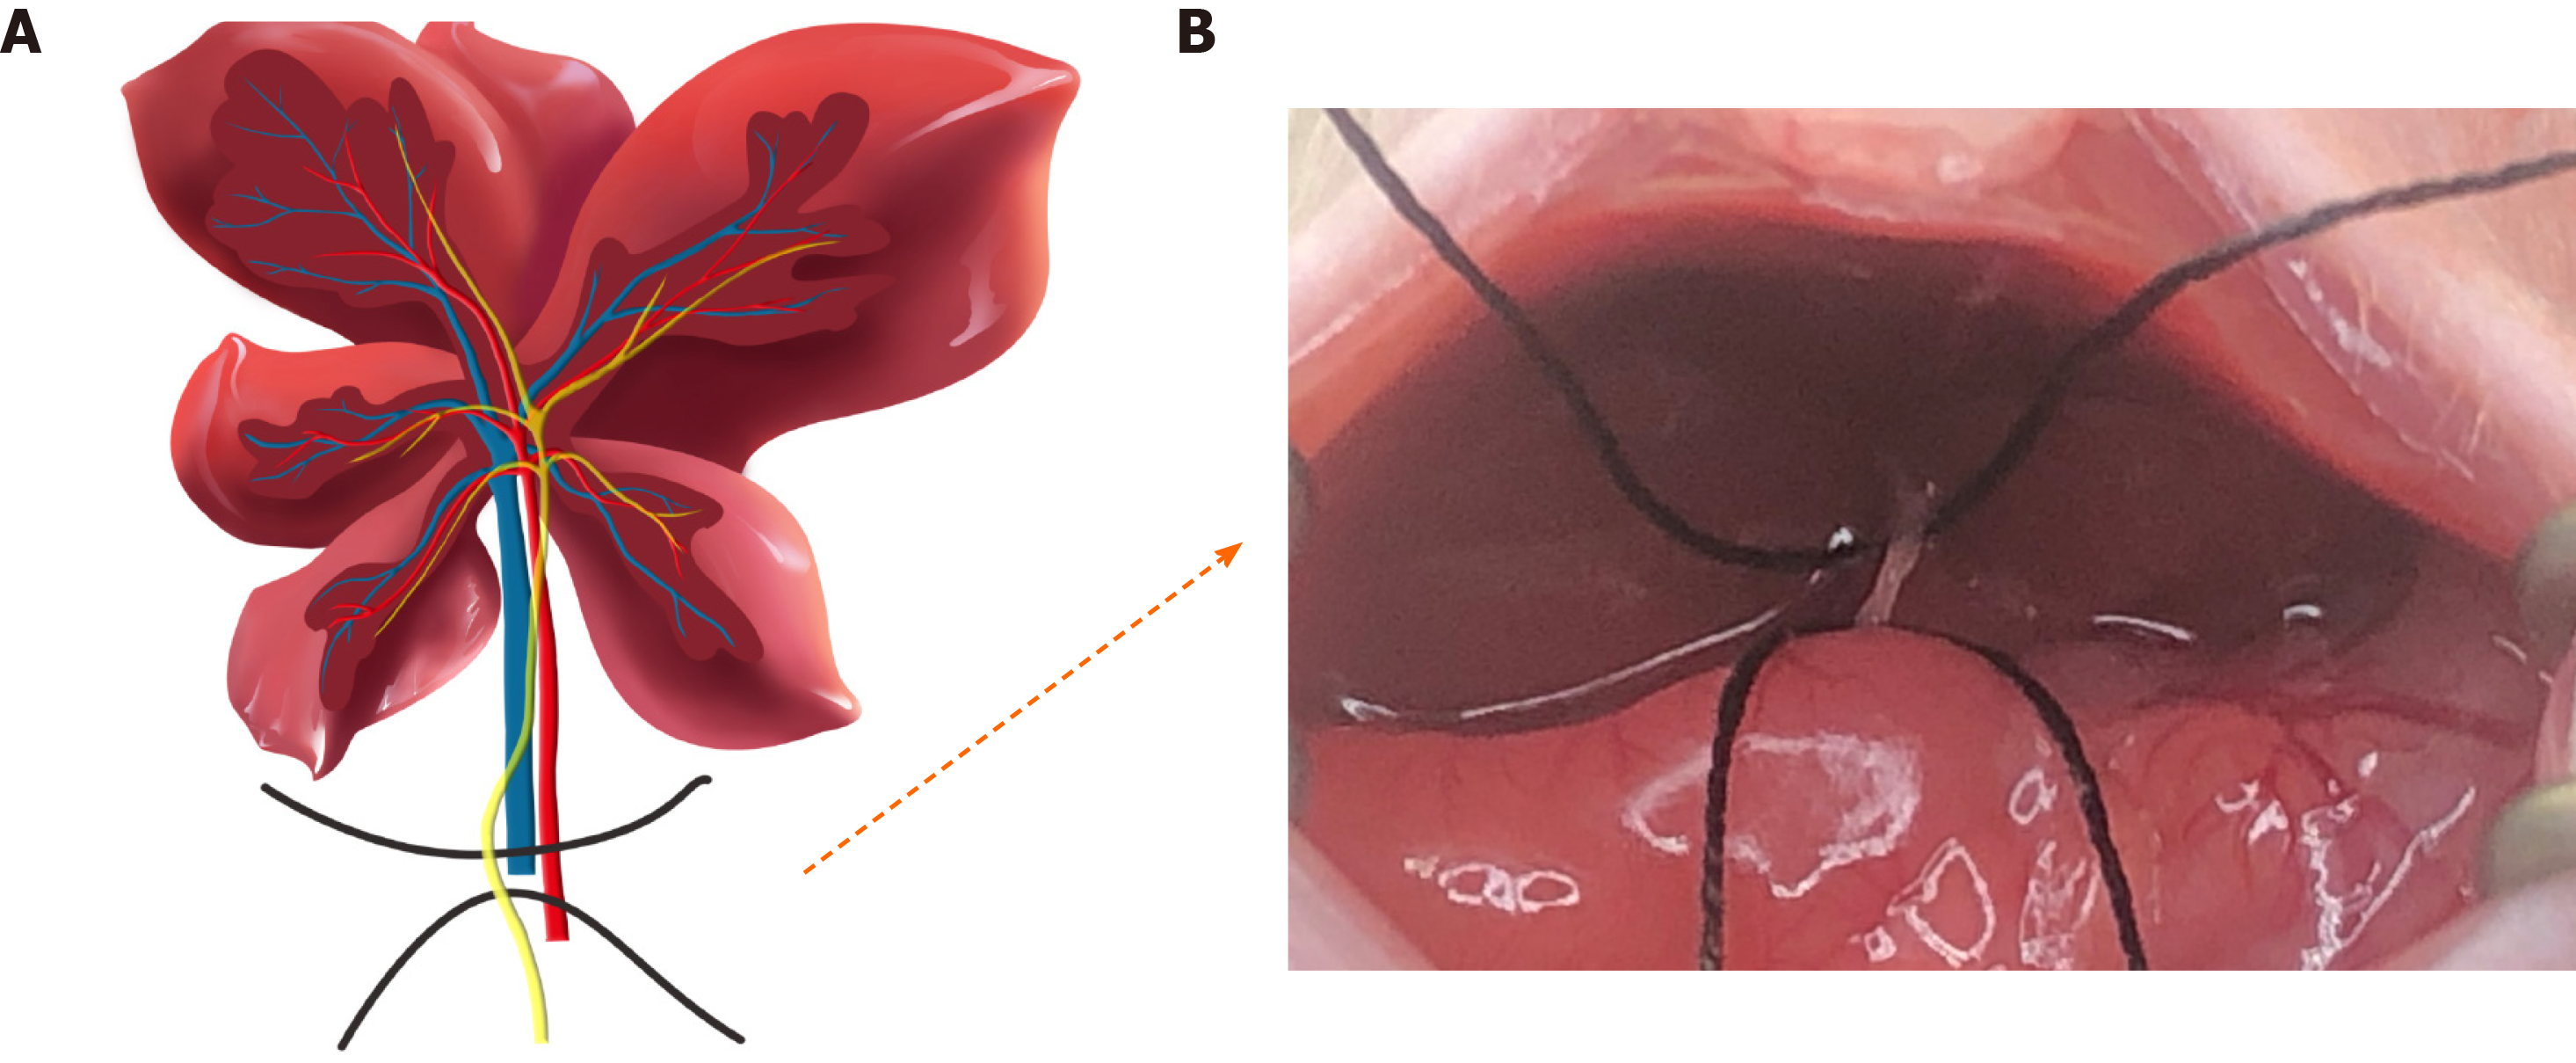
Twenty-eight 7–8-wk-old male balb/c mice that initially weighed 28–30 g were used. The animals were exposed to a regular light–dark cycle and housed in an air-conditioned room at 26°C. Food and water were available at all times. Before surgery, all mice were randomly divided into sham and BDL groups and anesthetized with an intraperitoneal injection of 45 mg/kg pentobarbital sodium. After losing reflexes in response to a toe pinch, they were fixed on a mouse fixator in the supine position, and the skin on the chest and abdomen was prepared. For sham surgery procedures, only an upper abdominal incision with a length of ~2 cm was made before the abdominal suture. For BDL surgery, the liver was lifted using a moisturized (normal saline) cotton swab so that the liver was stuck to the diaphragm, and the gut was caudally moved with a humidified cotton swab to better expose the bile duct. Subsequently, the 4-0 nonabsorbable suture was placed around the bile duct and secured by two surgical knots. After replacing the abdominal organs to their physiological positions and closing the abdominal layers with 6-0 absorbable sutures, the mice were moved to a warm cage until they were fully awake and active.
All MR images were obtained using a 3.0-T clinical MRI scanner (Magnetom Skyra; Siemens Medical Solutions, Erlangen, Germany) with a custom-built rodent receiver coil with an inner diameter of 7 cm (Zhongzhi Medical Technologies, Suzhou, China). Before imaging, the mice were anesthetized with an intraperitoneal injection of 45 mg/kg pentobarbital sodium solution, and the respiration rate was monitored by periodic visual inspection. Following the acquisition of magnetic resonance cholangiopancreatography (MRCP), T1-weighted, T2-weighted, T2 mapping, and pre- and post-enhanced T1 mapping images were obtained. The sequences and parameters were used as follows: (1) MRCP images were generated using a 3D multi-shot fast spin-echo sequence (repetition time (TR)/echo time (TE) = 4585.0/404.0 ms) to generate heavily T2-weighted 3D volumetric images; (2) Transverse T1-weighted sequence (TR/TE = 3.3/1.7 ms; voxel size, 0.9 mm × 0.9 mm × 0.7 mm; slice thickness, 0.7 mm; and total examination time, 5 min 58 s); (3) Transverse T2-weighted sequence (TR/TE = 5361/111 ms; voxel size, 0.4 mm × 0.4 mm × 1.0 mm; slice thickness, 1.0 mm; and total examination time, 3 min 57 s); (4) T1 mapping sequence (TR//TE = 8.5/3.7 ms; two flip angles = 5°/15°; scan time, 5 min 20 s; and five averages acquired); and (5) T2 mapping sequence (TR =1950 ms, a multiple TE equally spaced from 11.1 ms to 55.5 ms; flip angle, 180°). For contrast-enhanced T1 mapping imaging, the images were collected at the tenth minute after intravenous injection of 0.1 mL gadoxetate disodium.
Two radiologists (Q-L.S, and Y-H.L) with > 5 years of abdominal diagnostic experience independently recorded the image data and resolved any discrepancies by consensus. Both radiologists were blinded to the histopathological results.
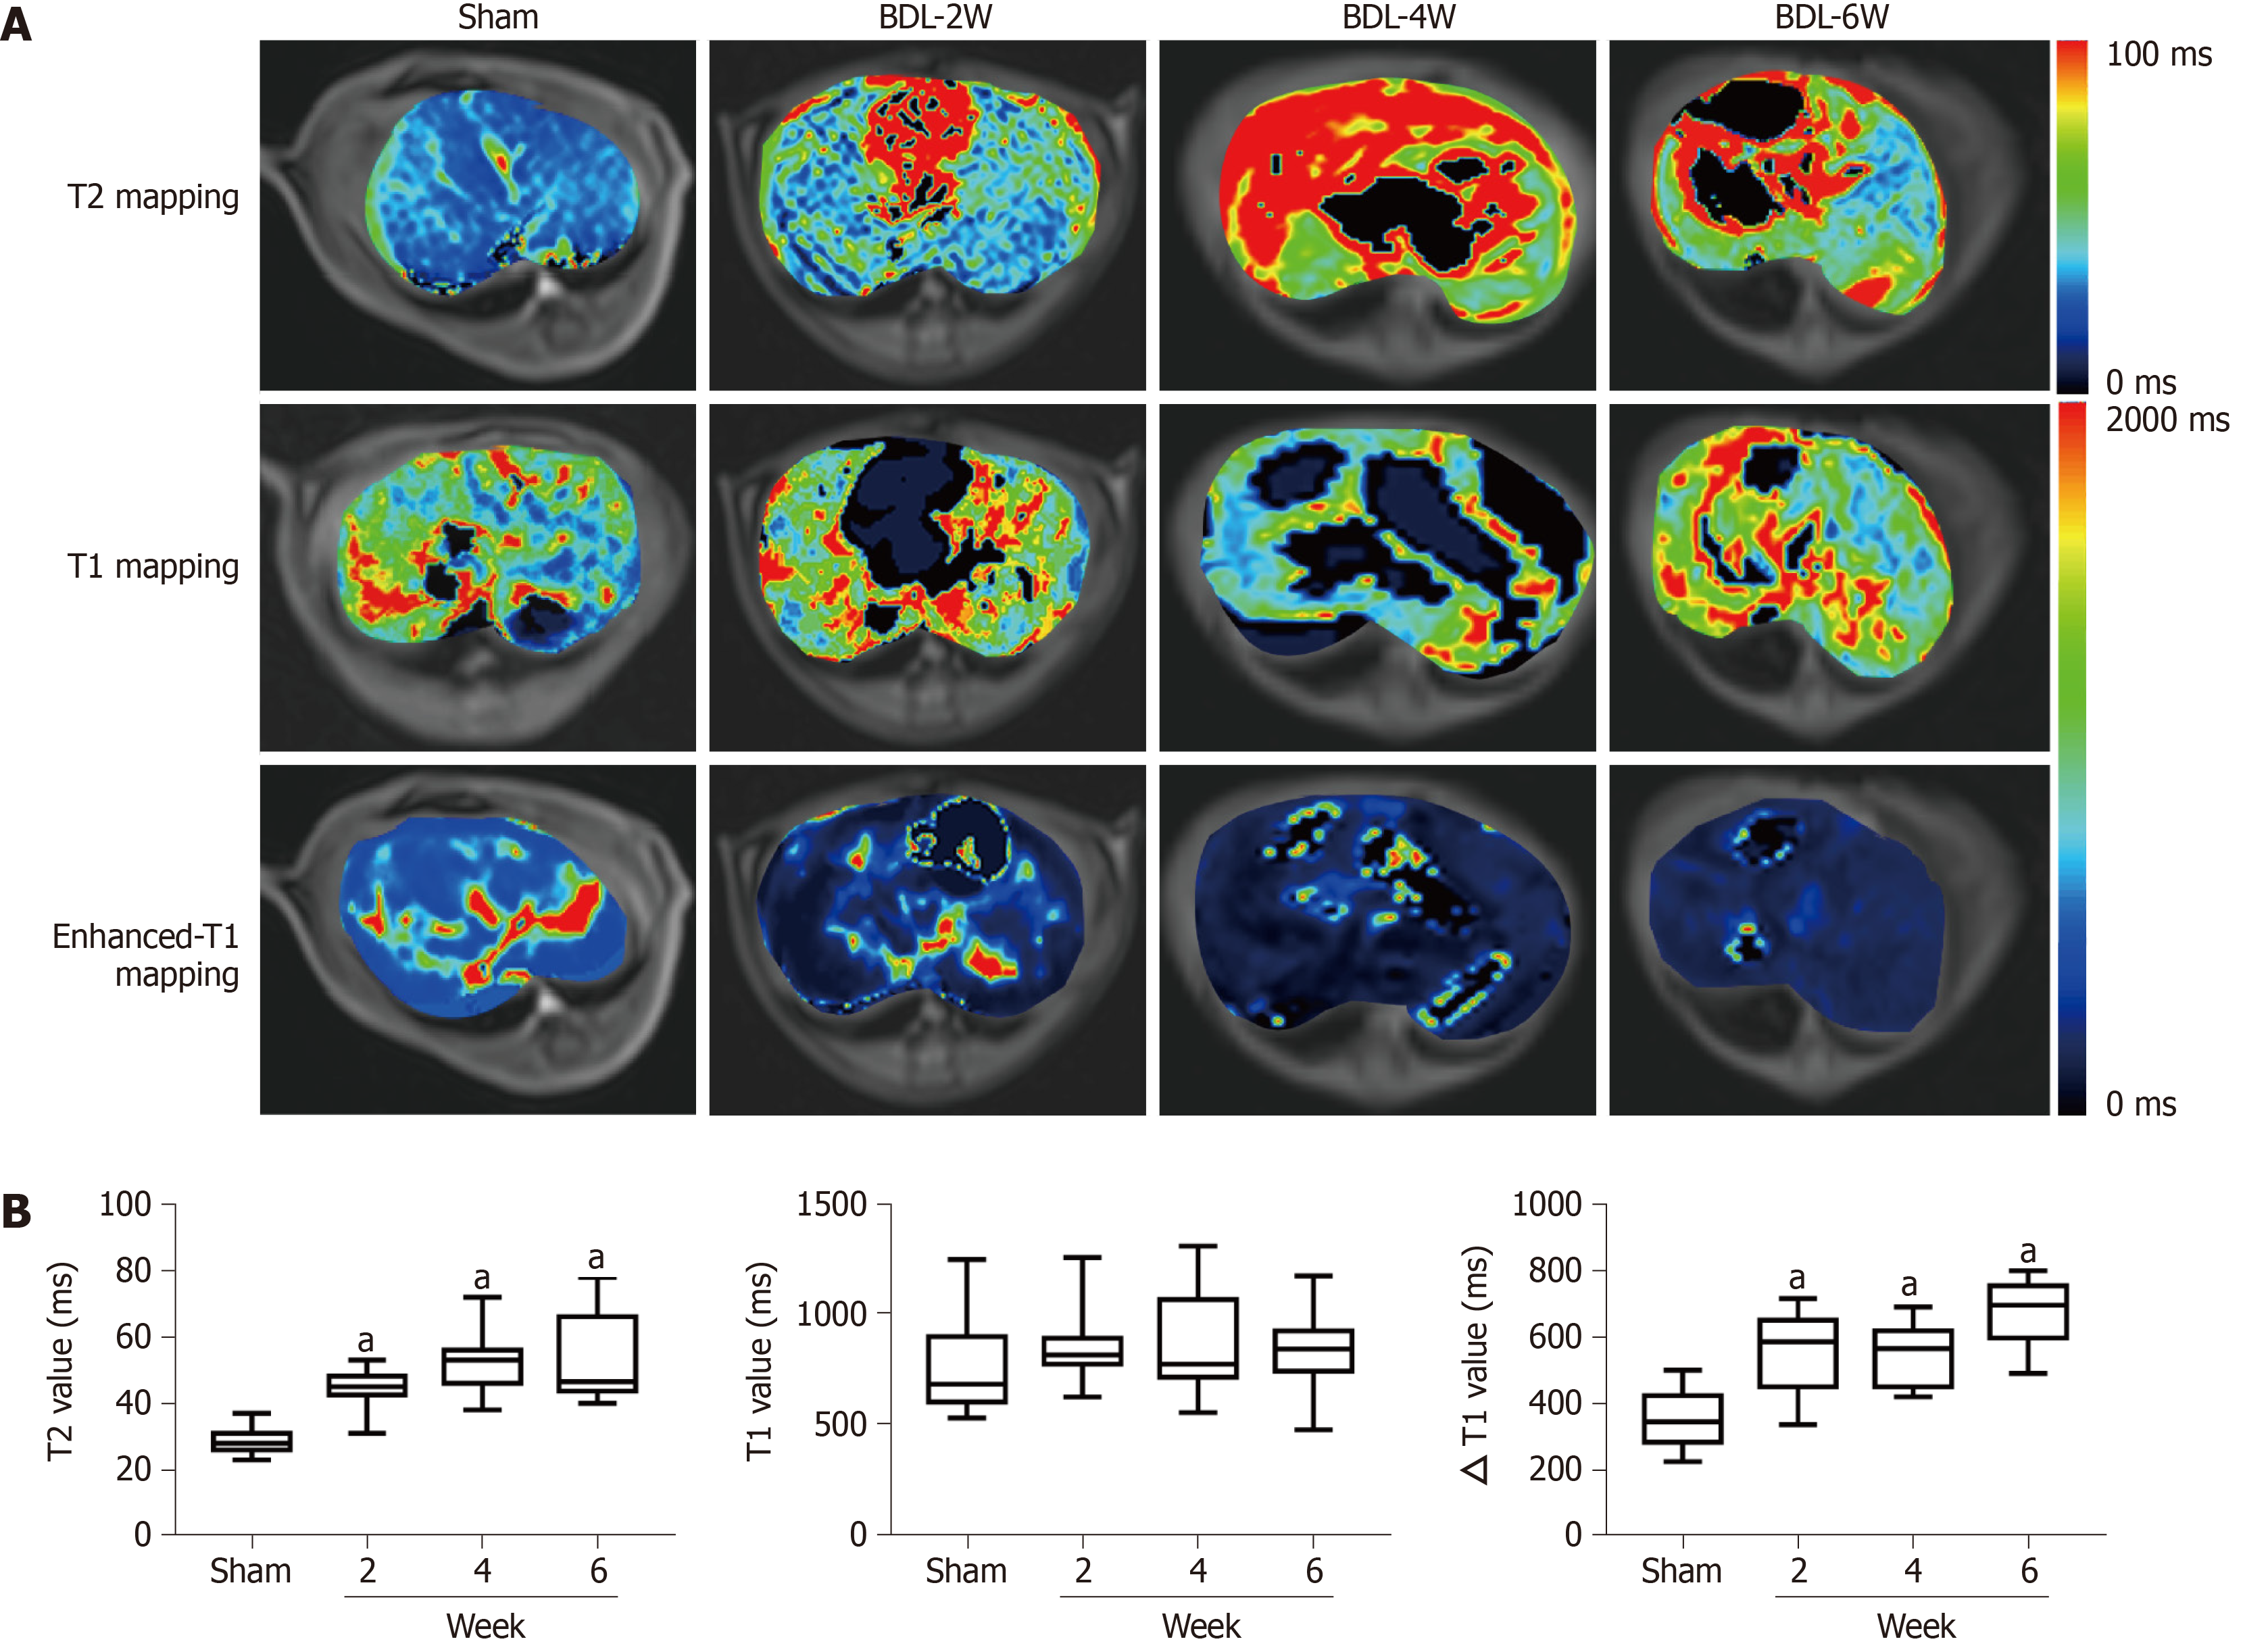
The MR data were imported into an image-processing workstation (Syngo; Siemens Medical Solutions). At least three circular regions of interest (ROIs) were randomly placed manually in the liver lobes to measure the signal intensities of routine sequences and mean values of the quantitative parameters. Care was taken to avoid moving artifacts and large vessels. Quantitative parameters for the liver, including T1 and T2 values, were extracted from relaxation pseudocolor maps in T1 and T2 mapping separately. ΔT1 value = (pre-enhanced T1 value) – (post-enhanced T1 value). The semiquantitative parameter, bile duct volume, was segmented by manually delineating each 2D slice and was estimated by adding up the individual voxel volumes inside the ROI.
All mice were killed under general anesthesia after MRI examination to procure their livers and collect blood at defined time points, as mentioned above. Blood was collected to measure clinical chemistry parameters, including alanine aminotransferase (ALT) and aspartate transaminase (AST) levels. Liver specimens were soaked in a 4% phosphate-buffered formaldehyde solution for 48 h, fixed using paraffin, and transversely sectioned. Liver tissue sections were soaked in a water bath and baked for 1 h at 70°C. The baked sections were then stained with the Masson’s Trichrome Staining Kit (G1006; Servicebio, Wuhan, China) and observed under an Olympus microscope (DP72; Olympus Corporation, Tokyo, Japan). The rate of liver fibrosis and fibrotic thickness of the bile duct were analyzed using ImageJ software, which was defined by the area of positive staining with blue color divided by the total area of the background.
Statistical analysis was performed using SPSS 22.0, and GraphPad Prism 7.0. Student’s t-test was used to determine the differences in average values between the sham and surgically treated groups. The relationships between radiological and histological findings were investigated using Pearson’s linear correlations. Statistical significance was set at P < 0.05. Statistical review of the study was performed by a biomedical statistician.
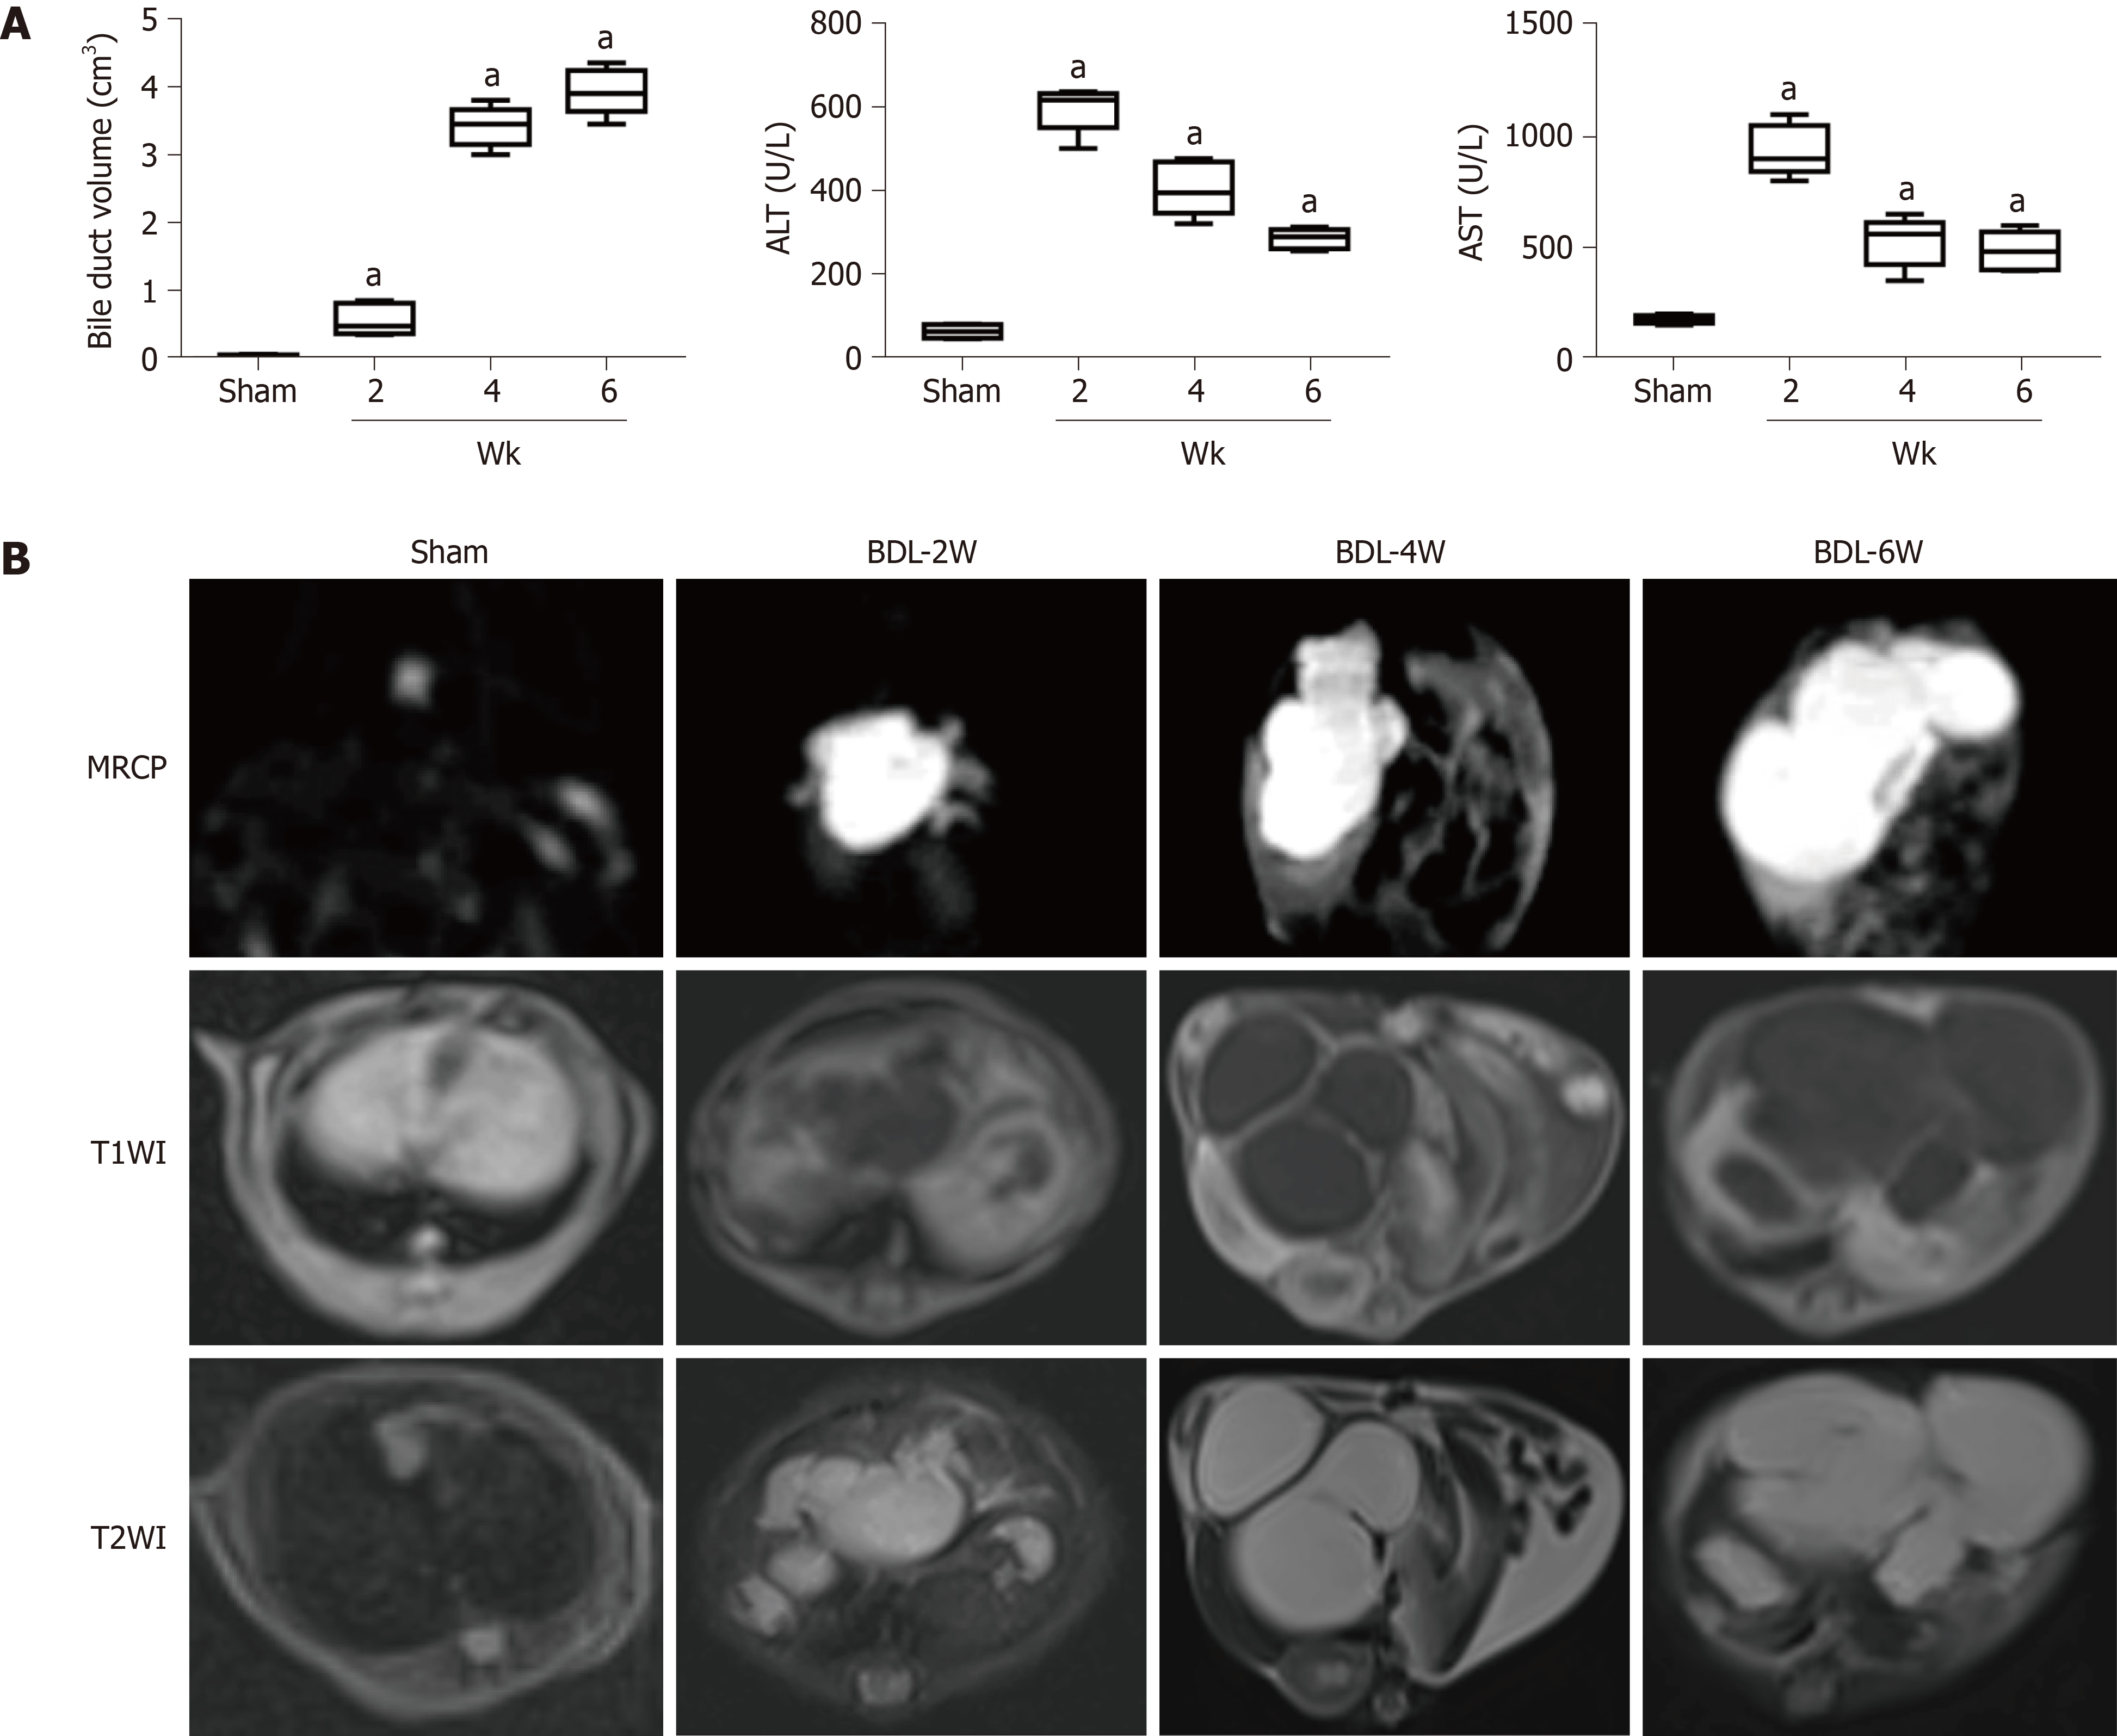
A schematic diagram of BDL is shown in Figure 1. Of the 28 mice, four in the liver fibrosis group died after BDL surgery. Finally, seven, six, five and six mice were included separately from the sham group, week 2 BDL, week 4 BDL and week 6 BDL groups. The bile duct volume (P < 0.01) grew dramatically from 0.04 cm3 in the sham group to 3.92 cm3 in the week 4 BDL group after BDL surgery (Figure 2A). The mean levels of ALT and AST, biomarkers of hepatocellular injury, in the week 6 BDL group were lower than those in the week 2 BDL group (P < 0.01). The BDL mice showed good adaptability after the second week of BDL (Figure 2B).
Morphological changes in Figure 2B are demarcated on the MR images obtained with all sequences. Swollen bile ducts showed signal intensities similar to that of water on MRCP, and TI-weighted and T2-weighted images. The volume of the bile duct had an obvious rise from 0.04 to 3.92 cm3 over time after BDL surgery. However, the signal intensities of the liver parenchyma did not show obvious differences upon perusal of the TI-weighted and T2-weighted images.
In MR functional sequences, dynamic documented pseudocolor maps qualitatively and quantitatively showed functional parameter changes (Figure 3A). T2 value increased with aggravation of liver fibrosis between the sham and BDL subgroups (P < 0.01, Figure 3B) from 28.9 to 52.1 ms. Aside from this, ΔT1 value for the sham group was lower than that of the week 6 BDL group with 352.1 and 675.8 ms, respectively (P < 0.01). In contrast, the pre-enhanced T1 values did not show a significant difference among the four groups.
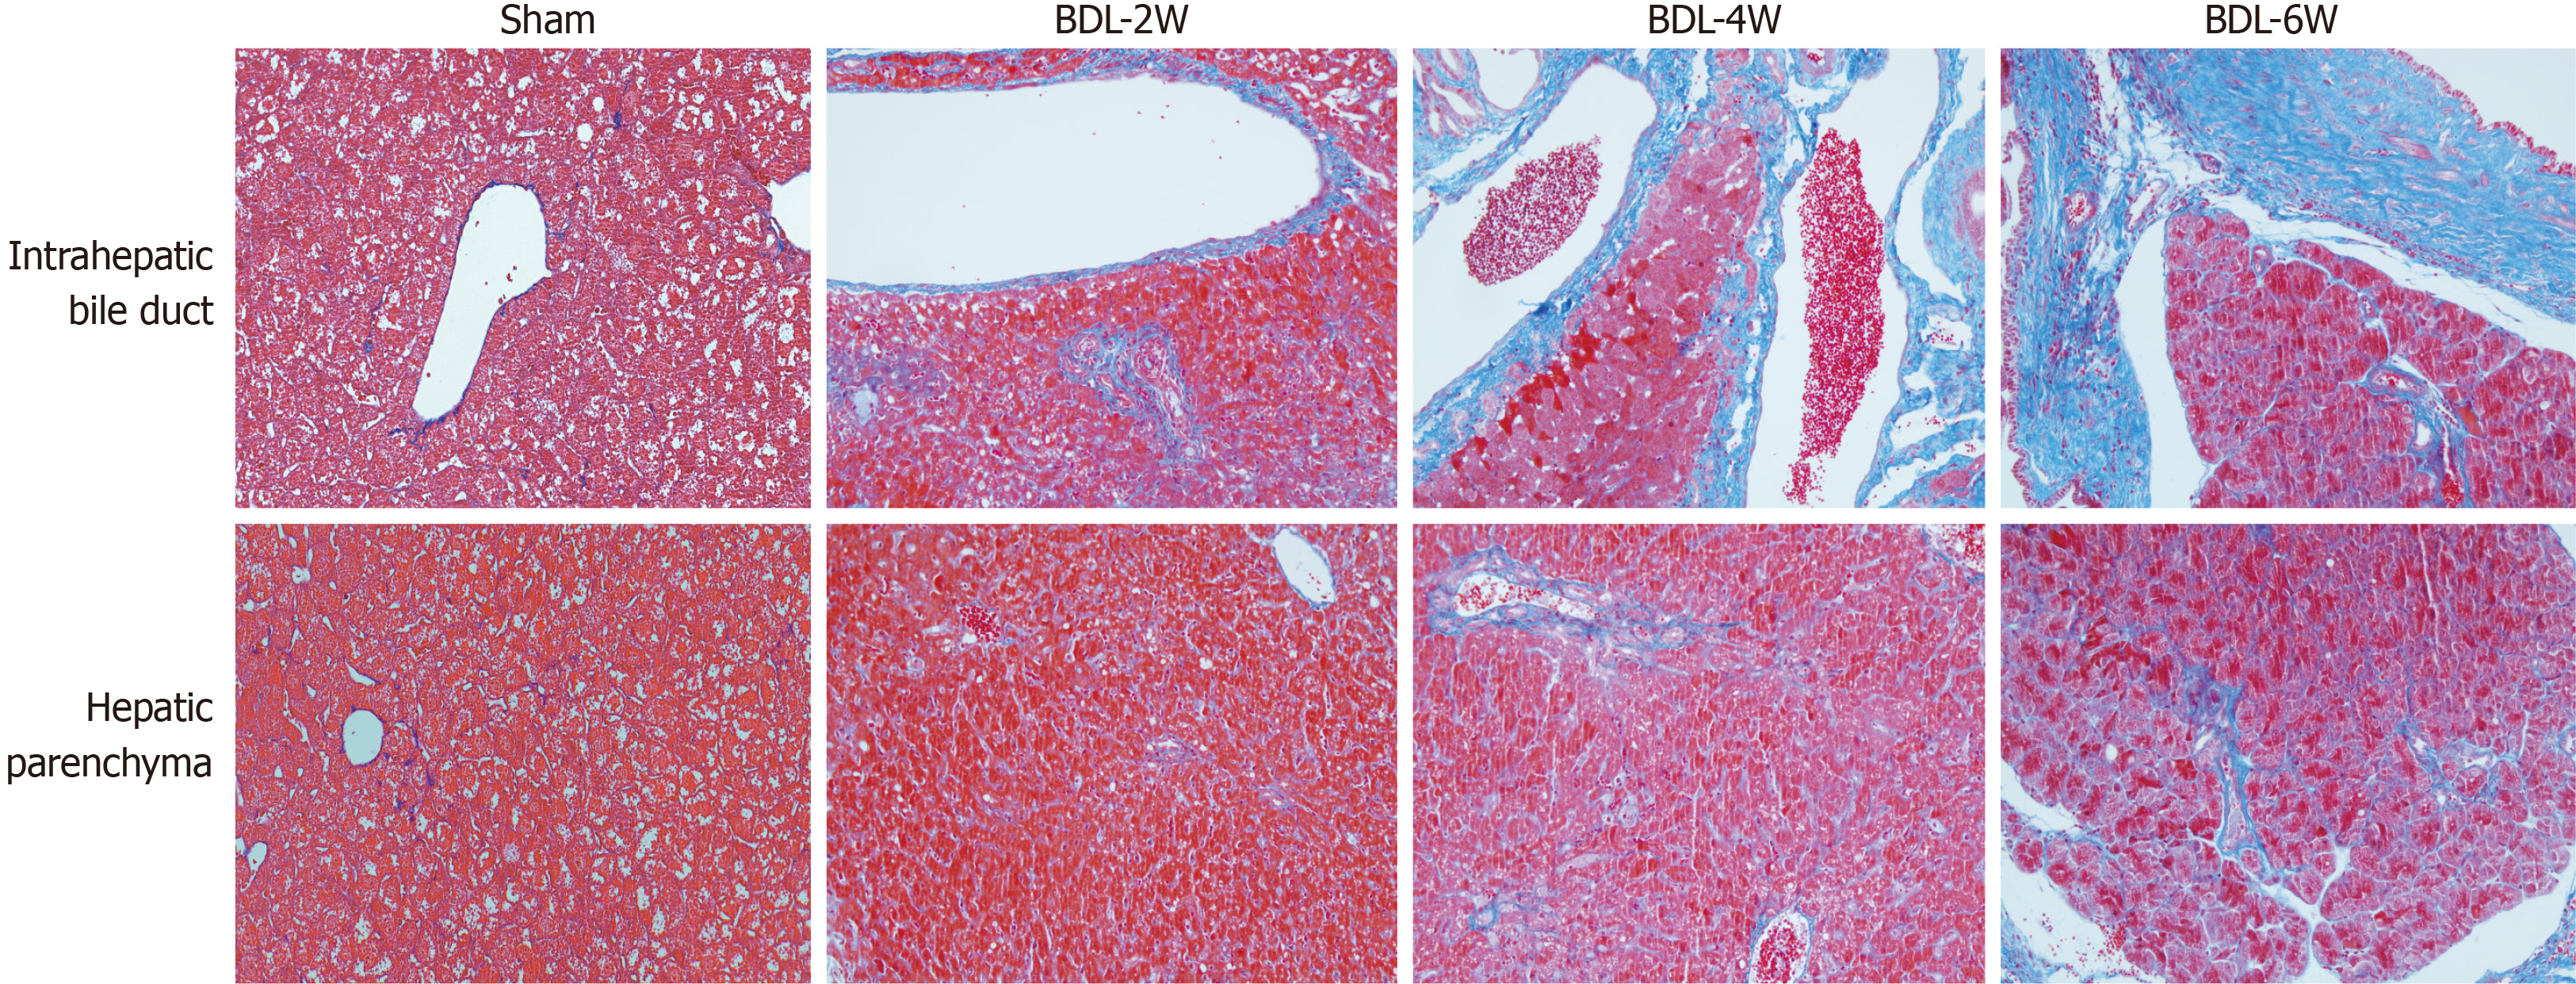
The different areas for measurement of liver fibrosis, including intrahepatic bile duct and hepatic parenchyma, were compared with respect to the model duration (Figure 4). The area of hepatic fibrosis and fibrotic thickness of the bile duct increased significantly over time. The highest proportion of hepatic fibrosis (12.58%) was found in the week 6 BDL group, which exceeded that in the remaining groups (P < 0.01). The fibrotic thickness of the bile duct was highest (54.73 mm) in the week 6 BDL group, compared with that of the other groups (P < 0.01).
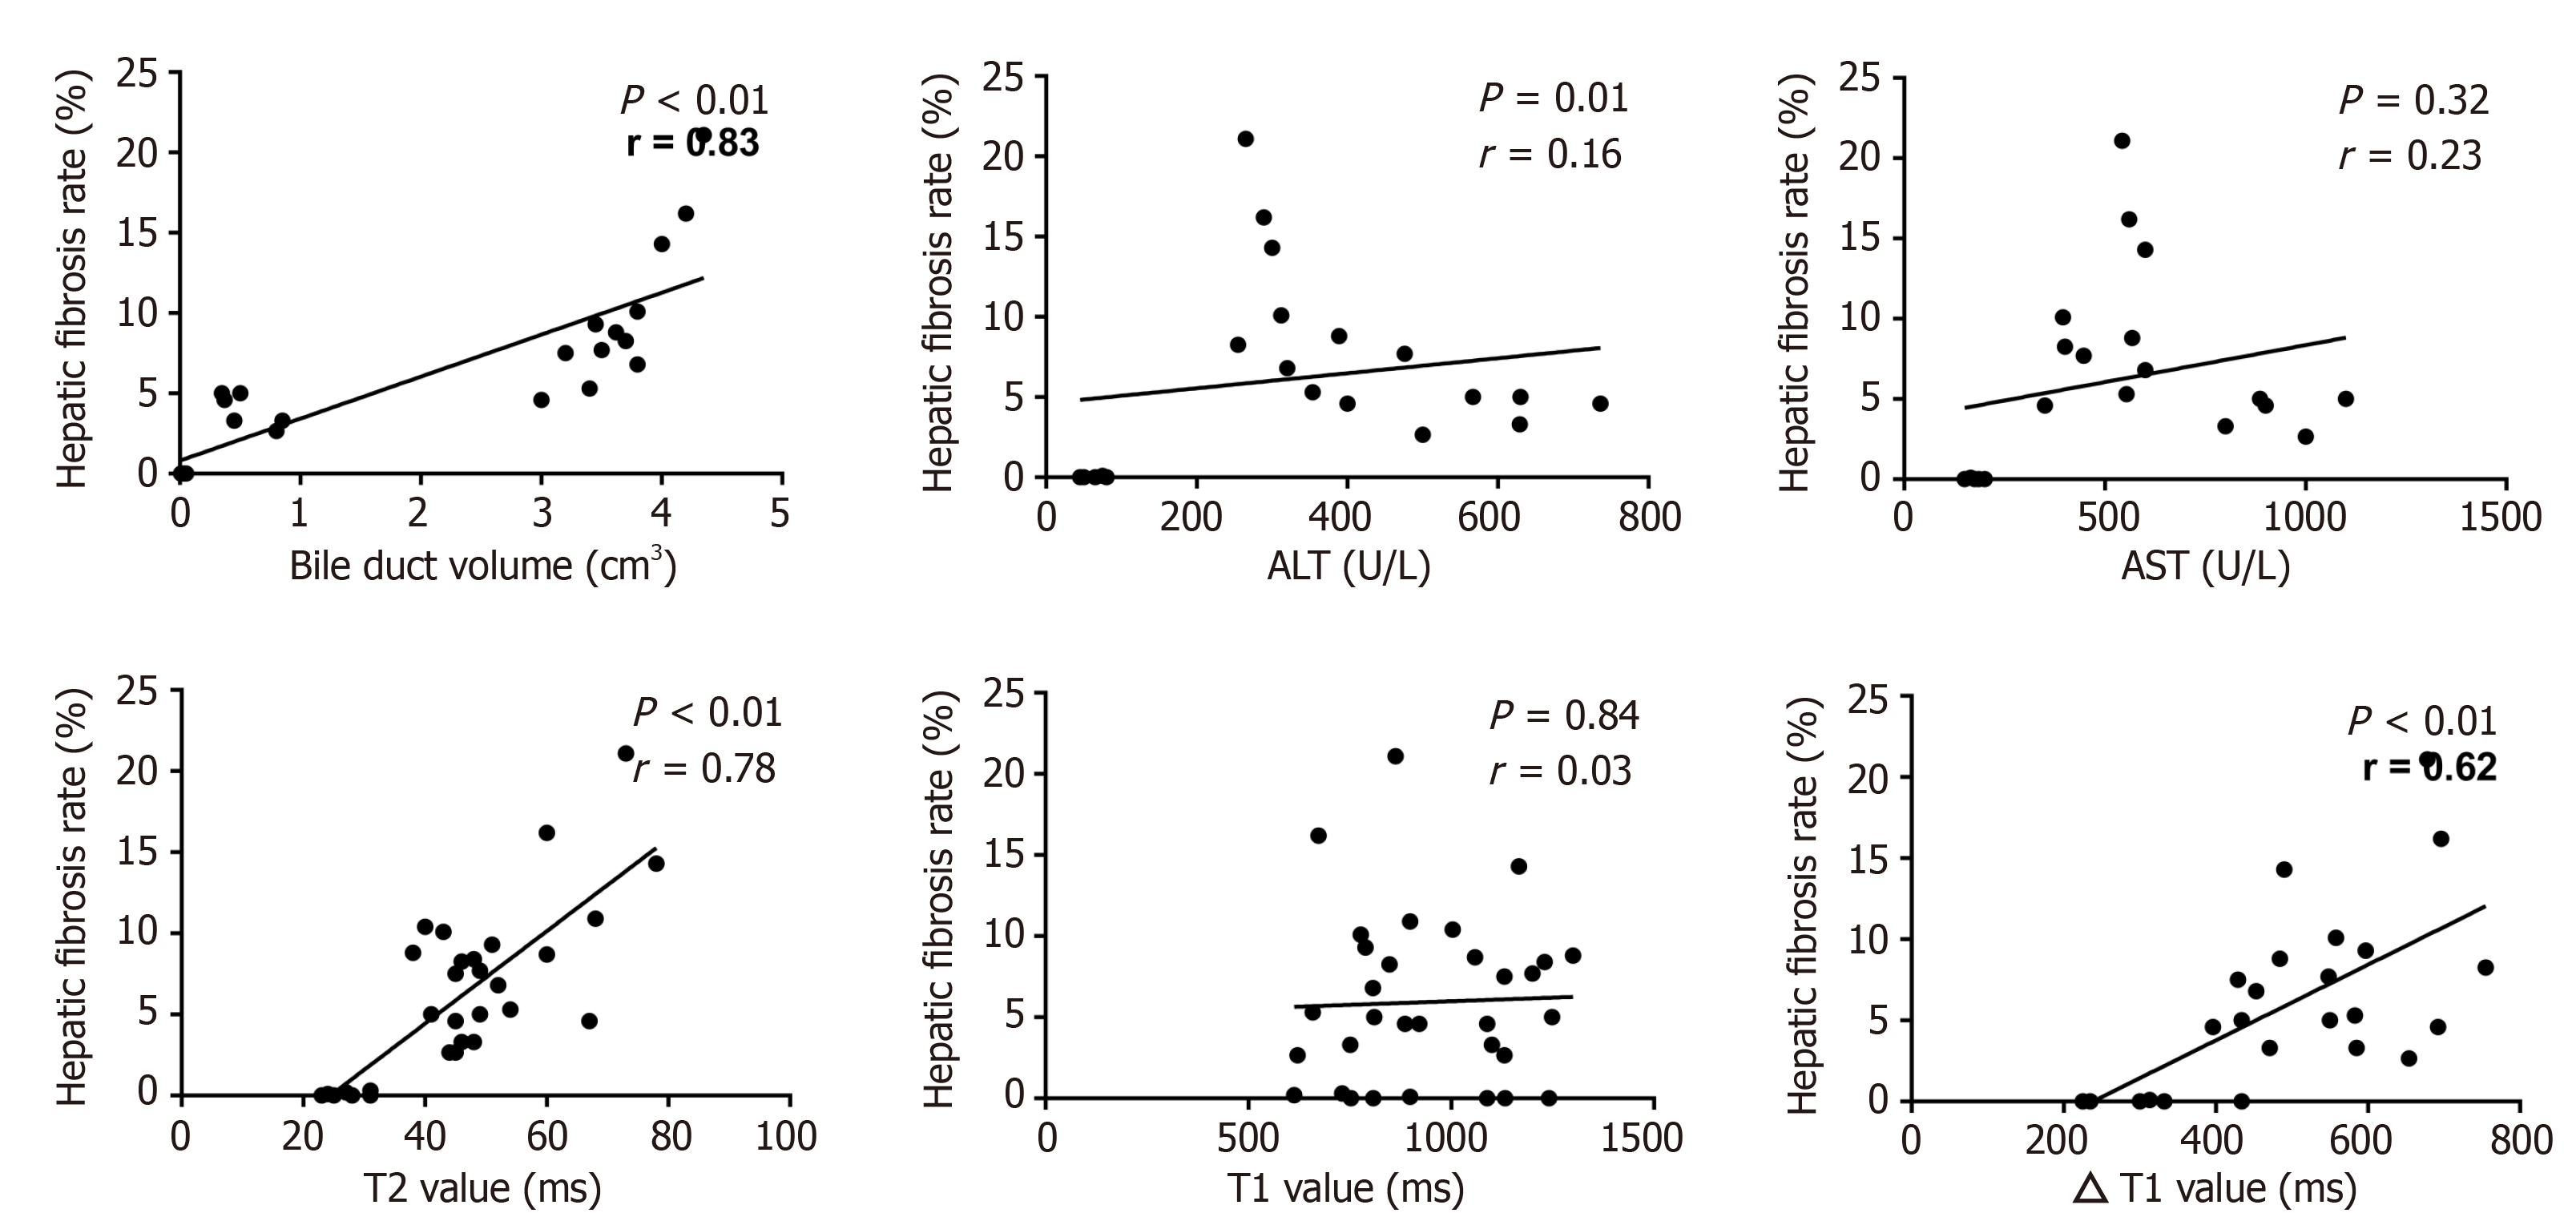
Correlation analysis between the tested parameters and the area of liver fibrosis was calculated (Figure 5). Histopathological examination revealed that the area of hepatic fibrosis showed steady growth. In the tested parameters, the changes in bile duct volume, T2 value, and ΔT1 value were in line with those of hepatic fibrosis. Also, the related coefficients of bile duct volume, T2 value, and ΔT1 value showed the manifest correlation with 0.84 (P < 0.01), 0.78 (P < 0.01) and 0.62 (P < 0.01), respectively. The levels of ALT and AST dramatically surged 2 wk after BDL surgery, followed by a gradual decline to the lowest values at week 6. The changes in ALT and AST levels differed from those in hepatic fibrosis. Thus, the correlation coefficients did not show valuable results (P > 0.05).
This study established an experimental BDL mouse model that mimicked various aspects of cholestatic fibrosis and evaluated the potential of multiparameter MRI for the noninvasive assessment of cholestatic fibrosis in the BDL mouse model.
The BDL model has been widely used to study cholestatic liver injury and the subsequent fibrosis. Surgical BDL can induce strong proliferation of bile duct cells, while the variable activation of oval cells (i.e. hepatic progenitor cells) depends on additional liver damage, leading to extensive bile duct reactions, cholestasis, portal inflammation, and rapid establishment of bile duct fibrosis[2-4]. This model was first established in rats and then successfully applied to rabbits and mice[5]. Unlike the BDL rabbit or rat model, the BDL mouse model may face more challenges, such as accurate operation, postoperative infections, and accidental injuries. In our study, standardized protocols with strict guidelines were followed, thereby enabling us to establish a mouse model of BDL, successfully.
Noninvasive liver fibrosis evaluation, including serum tests, ultrasound elasto
Multiparameter MRI sequences including MRCP, T1-weighted, T2-weighted, T2 mapping, and pre- and post-enhanced T1 mapping were performed in the sham and BDL groups. The results from the present study revealed that: (1) Pre-enhanced sequences including MRCP, T1-weighted, and T2-weighted clearly showed the morphological changes in the BDL mouse model; (2) Compared with the sham group, T2 and ΔT1 values showed significant differences in the BDL groups; and (3) Bile duct volume, T2 value, and ΔT1 value also demonstrated a higher correlation with the hepatic fibrosis rate.
The T2 value in our study showed a significant increase with time after BDL surgery and a good correlation between the T2 value and the rate of liver fibrosis in the BDL mouse model. Zhang et al[11] have also shown that the T2 value increases with the development of fibrosis, and has a close relationship between inflammation, edema, and liver fibrosis in rat models. Similarly, Luetkens et al[9] indicated that T2 values correlated not only with stages of fibrosis but also with total collagen protein and transcription of collagen type I. It is reasonable to conclude that the prolonged T2 value may be attributable to collagen deposition and inflammation.
Owing to the characteristics of MRI data acquisition, the signal intensity obtained from contrast-enhanced MR images is affected by many technical parameters[12]. The signal intensity is not proportional to the gadolinium concentration and cannot be directly compared between sequences collected at different time points. In recent years, increasing attention has been paid to the measurement of T1 relaxation time from T1 mapping images[13]. The T1 value, which is proportional to the concentration of contrast medium in vivo, is more objective and reliable than direct measurement of the liver signal[2]. In the present study, an upward trend was observed in the ΔT1 value from the sham group to the BDL group. However, the findings of the current study do not support previous research[14]. This discrepancy could be attributed to the partial obstruction of hepatic arteries as a result of a steady rise in bile duct volume such that the excretion time of the contrast would take longer than that of normal hepatic arteries. These factors may result in a greater amount of intracellular remnant in the form of the contrast agent and a decreased T1 value at 10 min after intravenous injection. Furthermore, a moderate correlation between the ΔT1 value and fibrosis rate was found in our study. This combination of findings provides some support for the conceptual premise that T1 mapping is a reliable tool for discriminating liver fibrosis.
This study had several limitations. First, because of the limited number of mice, it was difficult to avoid selection bias and carry out a subgroup analysis. Second, many advanced sequences such as MRE[15] and intravoxel incoherent motion imaging[16] could not be used in our study because of technological limitations in clinical MRI. Third, it is difficult to use the breath-holding technique in mice, and the subsequent respiratory movement in the abdomen might have degraded image quality and caused bias in measurements. Fourth, steatosis is a common hepatic lesion that occurs before the formation of fibrosis in biliary cirrhosis. This could have been a potential confounding factor in the pathological changes.
BDL induces a complex cascade of changes that can be clearly observed on MRI. To our knowledge, this is the first study to assess the utility of multiparameter MRI in a BDL mouse model. The results showed moderate to high correlations between ΔT1 value, T2 value, and liver fibrosis, indicating that T1 mapping and T2 mapping could be useful tools for the detection of liver fibrosis in the BDL mouse model. In the future, advanced MR techniques will have great potential for widespread application in both preclinical and clinical fields.
Bile duct ligation (BDL) is a classical method for mimicking cholestatic fibrosis in animals. Magnetic resonance imaging (MRI) has enabled significant advances in noninvasive assessment of liver fibrosis. More comprehensive liver fibrotic features of BDL on MRI are important. However, the utility of multiparameter MRI to detect liver fibrosis in a BDL mouse model has not been assessed.
We hypothesized that the BDL mouse model can be characterized radiologically using MRI, which is a noninvasive method. The model can be further validated regarding radiological, quantitative, and analytical aspects.
Using a BDL mouse model to evaluate the correlation between the pathological changes and several parameters of MRI characteristics of liver fibrosis.
Twenty-eight healthy adult male balb/c mice were included. They were randomly divided into four groups: Sham group and week 2 BDL, week 4 BDL and week 6 BDL groups. The MRI sequences included the following parameters: Magnetic resonance cholangiopancreatography (MRCP), T1-weighted, T2-weighted, T2 mapping, and pre- and post-enhanced T1 mapping. All these were performed after sham and BDL surgery. Peripheral blood and liver tissue were collected after the MRI.
The bile duct volume, ΔT1 value, T2 value, and the rate of liver fibrosis increased steadily in the week 2 BDL, week 4 BDL and week 6 BDL groups compared to those in the sham group (P < 0.01). Strong correlations were found between bile duct volume, T2 value, ΔT1 value, and hepatic fibrosis rate (all P < 0.01) in all BDL groups.
The BDL mouse model induces changes that are easily observed using MRI. The MRI parameters correlate with the hepatic fibrosis rate and enable the detection of cholestatic fibrosis.
We believe that advanced MR techniques have considerable potential for widespread application in preclinical and clinical fields.
Provenance and peer review: Unsolicited article; Externally peer reviewed.
Specialty type: Gastroenterology and hepatology
Country/Territory of origin: China
Peer-review report’s scientific quality classification
Grade A (Excellent): 0
Grade B (Very good): B
Grade C (Good): 0
Grade D (Fair): 0
Grade E (Poor): 0
P-Reviewer: Hasan A S-Editor: Wang LL L-Editor: Kerr C P-Editor: Li JH
| 1. | Lleo A, Wang GQ, Gershwin ME, Hirschfield GM. Primary biliary cholangitis. Lancet. 2020;396:1915-1926. [RCA] [PubMed] [DOI] [Full Text] [Cited by in Crossref: 163] [Cited by in RCA: 157] [Article Influence: 31.4] [Reference Citation Analysis (0)] |
| 2. | Farrar CT, DePeralta DK, Day H, Rietz TA, Wei L, Lauwers GY, Keil B, Subramaniam A, Sinskey AJ, Tanabe KK, Fuchs BC, Caravan P. 3D molecular MR imaging of liver fibrosis and response to rapamycin therapy in a bile duct ligation rat model. J Hepatol. 2015;63:689-696. [RCA] [PubMed] [DOI] [Full Text] [Cited by in Crossref: 52] [Cited by in RCA: 62] [Article Influence: 6.2] [Reference Citation Analysis (0)] |
| 3. | Ji Y, Zhang C, Huang Z, Wang X, Yue L, Gao M, Hu H, Su Q, Han Y, Liu B, Yang D, Su Z, Zhang Z. Gd-EOB-DTPA DCE-MRI biomarkers in a rabbit model of liver fibrosis. Am J Transl Res. 2018;10:2949-2957. [PubMed] |
| 4. | Koon CM, Zhang X, Chen W, Chu ES, San Lau CB, Wáng YX. Black blood T1rho MR imaging may diagnose early stage liver fibrosis: a proof-of-principle study with rat biliary duct ligation model. Quant Imaging Med Surg. 2016;6:353-363. [RCA] [PubMed] [DOI] [Full Text] [Cited by in Crossref: 16] [Cited by in RCA: 22] [Article Influence: 2.4] [Reference Citation Analysis (0)] |
| 5. | Li J, Dawson PA. Animal models to study bile acid metabolism. Biochim Biophys Acta Mol Basis Dis. 2019;1865:895-911. [RCA] [PubMed] [DOI] [Full Text] [Cited by in Crossref: 72] [Cited by in RCA: 156] [Article Influence: 22.3] [Reference Citation Analysis (0)] |
| 6. | Préfontaine L, Hélie P, Vachon P. Postoperative pain in Sprague Dawley rats after liver biopsy by laparotomy vs laparoscopy. Lab Anim (NY). 2015;44:174-178. [RCA] [DOI] [Full Text] [Cited by in Crossref: 10] [Cited by in RCA: 11] [Article Influence: 1.1] [Reference Citation Analysis (0)] |
| 7. | Dulai PS, Sirlin CB, Loomba R. MRI and MRE for non-invasive quantitative assessment of hepatic steatosis and fibrosis in NAFLD and NASH: Clinical trials to clinical practice. J Hepatol. 2016;65:1006-1016. [RCA] [PubMed] [DOI] [Full Text] [Cited by in Crossref: 259] [Cited by in RCA: 265] [Article Influence: 29.4] [Reference Citation Analysis (0)] |
| 8. | Yoon JH, Lee JM, Kim E, Okuaki T, Han JK. Quantitative Liver Function Analysis: Volumetric T1 Mapping with Fast Multisection B1 Inhomogeneity Correction in Hepatocyte-specific Contrast-enhanced Liver MR Imaging. Radiology. 2017;282:408-417. [RCA] [PubMed] [DOI] [Full Text] [Cited by in Crossref: 44] [Cited by in RCA: 62] [Article Influence: 6.9] [Reference Citation Analysis (0)] |
| 9. | Luetkens JA, Klein S, Träber F, Schmeel FC, Sprinkart AM, Kuetting DLR, Block W, Uschner FE, Schierwagen R, Hittatiya K, Kristiansen G, Gieseke J, Schild HH, Trebicka J, Kukuk GM. Quantification of Liver Fibrosis at T1 and T2 Mapping with Extracellular Volume Fraction MRI: Preclinical Results. Radiology. 2018;288:748-754. [RCA] [PubMed] [DOI] [Full Text] [Cited by in Crossref: 67] [Cited by in RCA: 111] [Article Influence: 15.9] [Reference Citation Analysis (0)] |
| 10. | Loomba R, Adams LA. Advances in non-invasive assessment of hepatic fibrosis. Gut. 2020;69:1343-1352. [RCA] [PubMed] [DOI] [Full Text] [Cited by in Crossref: 110] [Cited by in RCA: 232] [Article Influence: 46.4] [Reference Citation Analysis (0)] |
| 11. | Zhang H, Yang Q, Yu T, Chen X, Huang J, Tan C, Liang B, Guo H. Comparison of T2, T1rho, and diffusion metrics in assessment of liver fibrosis in rats. J Magn Reson Imaging. 2017;45:741-750. [RCA] [PubMed] [DOI] [Full Text] [Cited by in Crossref: 28] [Cited by in RCA: 30] [Article Influence: 3.3] [Reference Citation Analysis (0)] |
| 12. | Liu HF, Wang Q, Du YN, Zhu ZH, Li YF, Zou LQ, Xing W. Dynamic contrast-enhanced MRI with Gd-EOB-DTPA for the quantitative assessment of early-stage liver fibrosis induced by carbon tetrachloride in rabbits. Magn Reson Imaging. 2020;70:57-63. [RCA] [PubMed] [DOI] [Full Text] [Cited by in Crossref: 6] [Cited by in RCA: 8] [Article Influence: 1.6] [Reference Citation Analysis (0)] |
| 13. | Yoon JH, Lee JM, Paek M, Han JK, Choi BI. Quantitative assessment of hepatic function: modified look-locker inversion recovery (MOLLI) sequence for T1 mapping on Gd-EOB-DTPA-enhanced liver MR imaging. Eur Radiol. 2016;26:1775-1782. [RCA] [PubMed] [DOI] [Full Text] [Cited by in Crossref: 55] [Cited by in RCA: 60] [Article Influence: 6.0] [Reference Citation Analysis (0)] |
| 14. | Sheng RF, Wang HQ, Yang L, Jin KP, Xie YH, Fu CX, Zeng MS. Assessment of liver fibrosis using T1 mapping on Gd-EOB-DTPA-enhanced magnetic resonance. Dig Liver Dis. 2017;49:789-795. [RCA] [PubMed] [DOI] [Full Text] [Cited by in Crossref: 19] [Cited by in RCA: 26] [Article Influence: 3.3] [Reference Citation Analysis (0)] |
| 15. | Kromrey ML, Le Bihan D, Ichikawa S, Motosugi U. Diffusion-weighted MRI-based Virtual Elastography for the Assessment of Liver Fibrosis. Radiology. 2020;295:127-135. [RCA] [PubMed] [DOI] [Full Text] [Cited by in Crossref: 18] [Cited by in RCA: 18] [Article Influence: 3.6] [Reference Citation Analysis (0)] |
| 16. | Ye Z, Wei Y, Chen J, Yao S, Song B. Value of intravoxel incoherent motion in detecting and staging liver fibrosis: A meta-analysis. World J Gastroenterol. 2020;26:3304-3317. [RCA] [PubMed] [DOI] [Full Text] [Full Text (PDF)] [Cited by in CrossRef: 13] [Cited by in RCA: 14] [Article Influence: 2.8] [Reference Citation Analysis (0)] |


