Published online Jul 28, 2021. doi: 10.3748/wjg.v27.i28.4667
Peer-review started: March 19, 2021
First decision: June 3, 2021
Revised: June 4, 2021
Accepted: June 22, 2021
Article in press: June 22, 2021
Published online: July 28, 2021
Processing time: 129 Days and 7.7 Hours
Sorafenib is the first-line treatment for patients with advanced hepatocellular carcinoma (HCC). Y-box binding protein 1 (YB-1) is closely correlated with tumors and drug resistance. However, the relationship between YB-1 and sorafenib resistance and the underlying mechanism in HCC remain unknown.
To explore the role and related mechanisms of YB-1 in mediating sorafenib resistance in HCC.
The protein expression levels of YB-1 were assessed in human HCC tissues and adjacent nontumor tissues. Next, we constructed YB-1 overexpression and knockdown hepatocarcinoma cell lines with lentiviruses and stimulated these cell lines with different concentrations of sorafenib. Then, we detected the proliferation and apoptosis in these cells by terminal deoxynucleotidyl transferase dUTP nick end labeling, flow cytometry and Western blotting assays. We also constructed a xenograft tumor model to explore the effect of YB-1 on the efficacy of sorafenib in vivo. Moreover, we studied and verified the specific molecular mechanism of YB-1 mediating sorafenib resistance in hepatoma cells by digital gene expression sequencing (DGE-seq).
YB-1 protein levels were found to be higher in HCC tissues than in corresponding nontumor tissues. YB-1 suppressed the effect of sorafenib on cell proliferation and apoptosis. Consistently, the efficacy of sorafenib in vivo was enhanced after YB-1 was knocked down. Furthermore, KEGG pathway enrichment analysis of DGE-seq demonstrated that the phosphoinositide-3-kinase (PI3K)/protein kinase B (Akt) signaling pathway was essential for the sorafenib resistance induced by YB-1. Subsequently, YB-1 interacted with two key proteins of the PI3K/Akt signaling pathway (Akt1 and PIK3R1) as shown by searching the BioGRID and HitPredict websites. Finally, YB-1 suppressed the inactivation of the PI3K/Akt signaling pathway induced by sorafenib, and the blockade of the PI3K/Akt signaling pathway by LY294002 mitigated YB-1-induced sorafenib resistance.
Overall, we concluded that YB-1 augments sorafenib resistance through the PI3K/Akt signaling pathway in HCC and suggest that YB-1 is a key drug resistance-related gene, which is of great significance for the application of sorafenib in advanced-stage HCC.
Core Tip: Y-box binding protein 1 (YB-1) was significantly increased in hepatocellular carcinoma (HCC), and it could increase the IC50 values of sorafenib in HCC cell lines. Meanwhile, YB-1 suppressed apoptosis and cell proliferation inhibition induced by sorafenib. Furthermore, we screened the phosphoinositide-3-kinase (PI3K)/protein kinase B (Akt) signaling pathway to explore the molecular mechanism of sorafenib resistance by the KEGG pathway enrichment analysis of the digital gene expression profiling-seq. And the blockade of PI3K/Akt signaling pathway by LY294002 mitigated YB-1-induced sorafenib resistance. Given that sorafenib is the first-line treatment for patients with advanced HCC, we proposed that the down-regulation of YB-1 is of great significance for the application of sorafenib in advanced HCC.
- Citation: Liu T, Xie XL, Zhou X, Chen SX, Wang YJ, Shi LP, Chen SJ, Wang YJ, Wang SL, Zhang JN, Dou SY, Jiang XY, Cui RL, Jiang HQ. Y-box binding protein 1 augments sorafenib resistance via the PI3K/Akt signaling pathway in hepatocellular carcinoma. World J Gastroenterol 2021; 27(28): 4667-4686
- URL: https://www.wjgnet.com/1007-9327/full/v27/i28/4667.htm
- DOI: https://dx.doi.org/10.3748/wjg.v27.i28.4667
Approximately 90% of liver cancer cases are hepatocellular carcinoma (HCC)[1,2]. Approximately 420,000 people die of HCC every year in China, a region with a high HCC incidence[3,4]. Although studies have tried to clarify the pathogenesis of HCC, our understanding of HCC remains limited[5,6], and treatments including resection, ablation or transplantation are only feasible for patients diagnosed early[2,7]. For those with advanced HCC, the best treatment options are still lacking. The Food and Drug Administration (FDA) has approved sorafenib, which is a multitarget tyrosine kinase inhibitor, as a first-line drug for patients with advanced HCC and provides circumscribed survival benefits[8-10]. Additionally, because HCC is prone to relapse and metastasis, the prognosis of this refractory disease remains frustrating[11]. Therefore, further deepening our understanding of the molecular mechanisms of HCC and developing new intervention strategies are critical.
Y-box binding protein 1 (YB-1) is a multifunctional protein of the Y-box binding protein family that is distributed in both the cytoplasm and nucleus[12]. Current research on the function of YB-1 mainly involves the following three aspects: (1) YB-1 promotes the proliferation of hepatoma cells via the Wnt (wingless/integrated)/β-catenin signaling pathway[13] and promotes human breast epithelial tumor cell proliferation by activating the endothelial growth factor receptor (EGFR)/protein kinase B (Akt) signaling pathway[14]; (2) YB-1 effectively inhibits the gene expression of fatty acid synthase (Fas), thereby preventing the occurrence of apoptosis[15], and binds to the key apoptotic factor p53 to form protein complexes, which also exert anti-apoptotic effects[16,17]; (3) YB-1 activates the expression of multidrug resistance (MDR) genes in multiple cancers, such as kidney cancer, breast cancer and colorectal cancer[18]. Additionally, the most recent research indicates that YB-1 augments gefitinib resistance by activating the Akt signaling pathway and epithelial-mesenchymal transition (EMT) by targeting major vault proteins in lung adenocarcinoma cells[19]. Furthermore, YB-1 is significantly increased in pancreatic cancer, breast cancer, colorectal cancer, melanoma and sarcoma[13,14,20]. Chao et al[13] proved that the YB-1 expression level is significantly elevated in HCC and closely related to drug resistance. However, the specific underlying molecular mechanism remains uncertain. Therefore, our study intends to elucidate the relationship between YB-1 and sorafenib resistance in HCC and further explore the specific molecular mechanism underlying sorafenib resistance.
HCC tissues and paired paracancerous tissues (normal) were surgically resected from 6 patients with HCC and were obtained from 09/2020 to 11/2020 at our hospital. Patients with HCC diagnosed according to clinical and histological diagnostic criteria for HCC in China[21] were included in this study, and patients with tumor recurrence or other organ tumors were excluded. The diagnosis of HCC and histological evaluation were performed by an experienced pathologist. After excision, the tissues were fixed with 4% paraformaldehyde (Shijiazhuang Huawo Kerui Biological Technology Co., Ltd., Hebei Province, China) or immediately placed at -80 °C. All the patients signed informed consent forms, and the Ethics Committee of the Second Hospital of Hebei Medical University approved our study (approval letter No. 2020-P025).
The human normal hepatic cell line (LO2) and human hepatocarcinoma cell lines (HepG2, Huh7, Bel7402, SMMC7721) were purchased from the American Type Culture Collection (ATCC; Manassas, VA, United States). Cells were cultured in Dulbecco’s modified Eagle’s medium (DMEM; Gibco BRL, Grand Island, NY, United States) supplemented with 10% fetal bovine serum (FBS, HyClone, South Logan, UT, United States), 100 μg/mL of streptomycin and 100 U/mL of penicillin (Gibco BRL). Overexpression was accomplished by transfection with lentivirus-YB-1 (Lv-YB-1) for 24 h (Shanghai GenePharma Co., Ltd., Shanghai, China, Supplementary Table S1). Sequences of the YB-1 siRNA are displayed in Supplementary Table S2. Lentiviral vectors harboring YB-1-specific shRNA (Lv-shYB-1) were used (Shanghai GenePharma Co., Ltd, Supplementary Table S1), and cells were transfected for 24 h. Hepatoma cells were then incubated with 2.5 or 5 μmol/L sorafenib (MedChemExpress, Monmouth Junction, NJ, United States) for 24-48 h. LY294002 [a broad-spectrum inhibitor of phosphoinositide-3-kinase (PI3K), 20 μmol/L, 24 h] (MedChemExpress) or vehicle was also used to incubate YB-1-overexpressing cells with sorafenib.
Cell Counting Kit-8 (CCK-8) assays (Shanghai Share-bio Biotechnology Co., Shanghai, China) were used to examine the half-inhibitory concentration (IC50). Briefly, the cells were seeded into 96-well plates at a density of 5 × 10³ cells/well and incubated with different concentrations of sorafenib. Next, CCK-8 (10 μL/well) was added (serum-free medium vs CCK-8 = 10:1) to a volume of 110 μL and incubated for 2 h. The optical density (OD) value was measured using a microplate reader (BioTek, Winooski, VT, United States) at 450 nm. For the cell cycle distribution analysis, the cells were cultured in six-well plates and collected when the cells were transfected and incubated for 24 h. Hereafter, we washed the cells with precooled phosphate-buffered saline (PBS; Solarbio Science and Technology Co., Ltd., Beijing, China), fixed the cells in 70% ethanol (Tianjin YongDa Chemical Reagent Co., Ltd., Tianjin, China), and subjected them to staining with PI/RNase Staining Solution (Beyotime Biotechnology Co., Shanghai, China) at 37 °C in the dark for 30 min. A FACSVerse flow cytometer (BD Biosciences, San Jose, CA, United States) was used to analyze the samples, and ModFit 5.0 software (BD Biosciences) was used to process the data.
Following treatment, we collected and washed the cells with precooled PBS and utilized the Annexin V Apoptosis Detection Kit (Invitrogen, Carlsbad, CA, United States) to detect apoptotic cells. Briefly, the cells were incubated with staining solution containing 2.5 μL of Annexin V-APC, 5 μL of propidium iodide (PI) buffer and 200 μL of binding buffer for 20 min in the dark at room temperature. A FACSVerse flow cytometer was applied to analyze the samples. Additionally, a one-step terminal deoxynucleotidyl transferase dUTP nick end labeling (TUNEL) apoptosis detection kit (Beyotime Biotechnology Co.) was employed to examine apoptosis according to the manufacturer’s instructions. TUNEL-positive cells were recorded as the measurement of cell apoptosis. A laser scanning confocal microscope (Olympus, Tokyo, Japan) was used to acquire representative images.
BALB/c nude mice were purchased from Beijing Vital River Laboratory Animal Technology Co., Ltd. Approximately 2 × 10⁶ Huh7 cells transfected with Lv-shNC or Lv-shYB-1 were subcutaneously injected into male BALB/c nude mice aged 4 wk. We measured the tumors every 2 d, and (length × width2)/2 was used to calculate the tumor volume. Next, we randomly divided the mice into designated groups (n = 6) when the average volume of the tumors reached approximately 100 mm3. The nude mice in the Lv-shNC + sorafenib and Lv-shYB-1 + sorafenib groups were treated with sorafenib by gavage at a dosage of 30 mg/kg/d for 14 d. We sacrificed the nude mice when the treatment was completed, and the tissues were fixed with 4% paraformaldehyde or immediately placed at -80 °C. The animal protocol was designed to minimize pain and discomfort to animals. The nude mice were acclimatized to laboratory conditions for 1 wk prior our experiment. Intragastric gavage administration was conducted by using straight gavage needles (22 gauge). All the animals in our study received humane care, and the ethics committee of the Second Hospital of Hebei Medical University approved our study (approval letter No. 2020-AE002).
We fixed human liver tissues and mouse xenograft tumors with 4% paraformaldehyde, embedded tissues in paraffin (Shanghai YiYang Instrument Co., Ltd., Shanghai, China), and sectioned them. The sections were then subjected to hematoxylin and eosin (HE, Beijing Legian Biotechnology Co., Ltd., Beijing, China) and immunohistochemical (IHC) staining using standard protocols as previously described[22]. YB-1 (diluted 1:200; catalog number: CY5462; Shanghai Abways Biotechnology Co., Ltd., Shanghai, China) and proliferating cell nuclear antigen (PCNA; diluted 1:200; catalog number: AB0051; Shanghai Abways Biotechnology Co., Ltd.) antibodies were used in our study, and IHC images were obtained using an upright microscope (Leica, Wetzlar, Germany). We utilized ImageJ software (National Institutes of Health, Bethesda, MD, United States) to morphometrically evaluate the percentage of positive areas on the micrographs.
Cells or tissues were lysed using radioimmunoprecipitation assay buffer [50 mmol/L Tris, 1 mmol/L ethylenediaminetetraacetic acid, 150 mmol/L NaCl, 0.1% sodium dodecyl sulfate (SDS), 1% Triton X-100, 1% sodium deoxycholate, 1 mmol/L phenylmethylsulfonyl fluoride] (Beyotime Biotechnology Co.) for total protein extraction after washing in PBS. Next, we quantified the protein concentrations by Coomassie blue staining (Solarbio Science and Technology Co., Ltd.) and denatured in SDS loading buffer (Beyotime Biotechnology Co.) by boiling for 10 min. The proteins from each sample were subjected to SDS-polyacrylamide gel electrophoresis (Shanghai Epizyme Biotechnology Co., Ltd., Shanghai, China) and transferred onto polyviny
Two samples of HepG2 cell lines (Lv-shNC + sorafenib and Lv-shYB-1 + sorafenib) with stable YB-1 knockdown and sorafenib treatment were used, and each sample was repeated 3 times. Next, we submitted the samples to Beijing Novogene Technology Co., Ltd. (Beijing, China) for digital gene expression profiling (DGE) sequencing analysis to screen out DEGs. The analysis process mainly included data quality control, reference genome comparison, quantitative analysis, significance analysis of differences and functional enrichment analysis. The DESeq2 R package (1.16.1) was employed to perform the differential expression analysis between the groups (three biological replicates per group). The Benjamini and Hochberg approach to control the false discovery rate was adopted to adjust the resulting P-values (padj). A padj less than 0.05 and an absolute value of the log2 (fold change) more than 0 were utilized as the thresholds to recognize the differentially expressed genes[23,24].
All the experiments were repeated three times. Normally distributed data were expressed as mean ± SD, and nonnormally distributed data were expressed as medians with interquartile range. The difference between two groups was analyzed by Student’s t-test. For differences among multiple groups, one-way ANOVA was performed. SPSS software version 19.0 (IBM, Armonk, NY, United States) was used to perform all statistical analyses. P values less than 0.05 were deemed statistically significant.
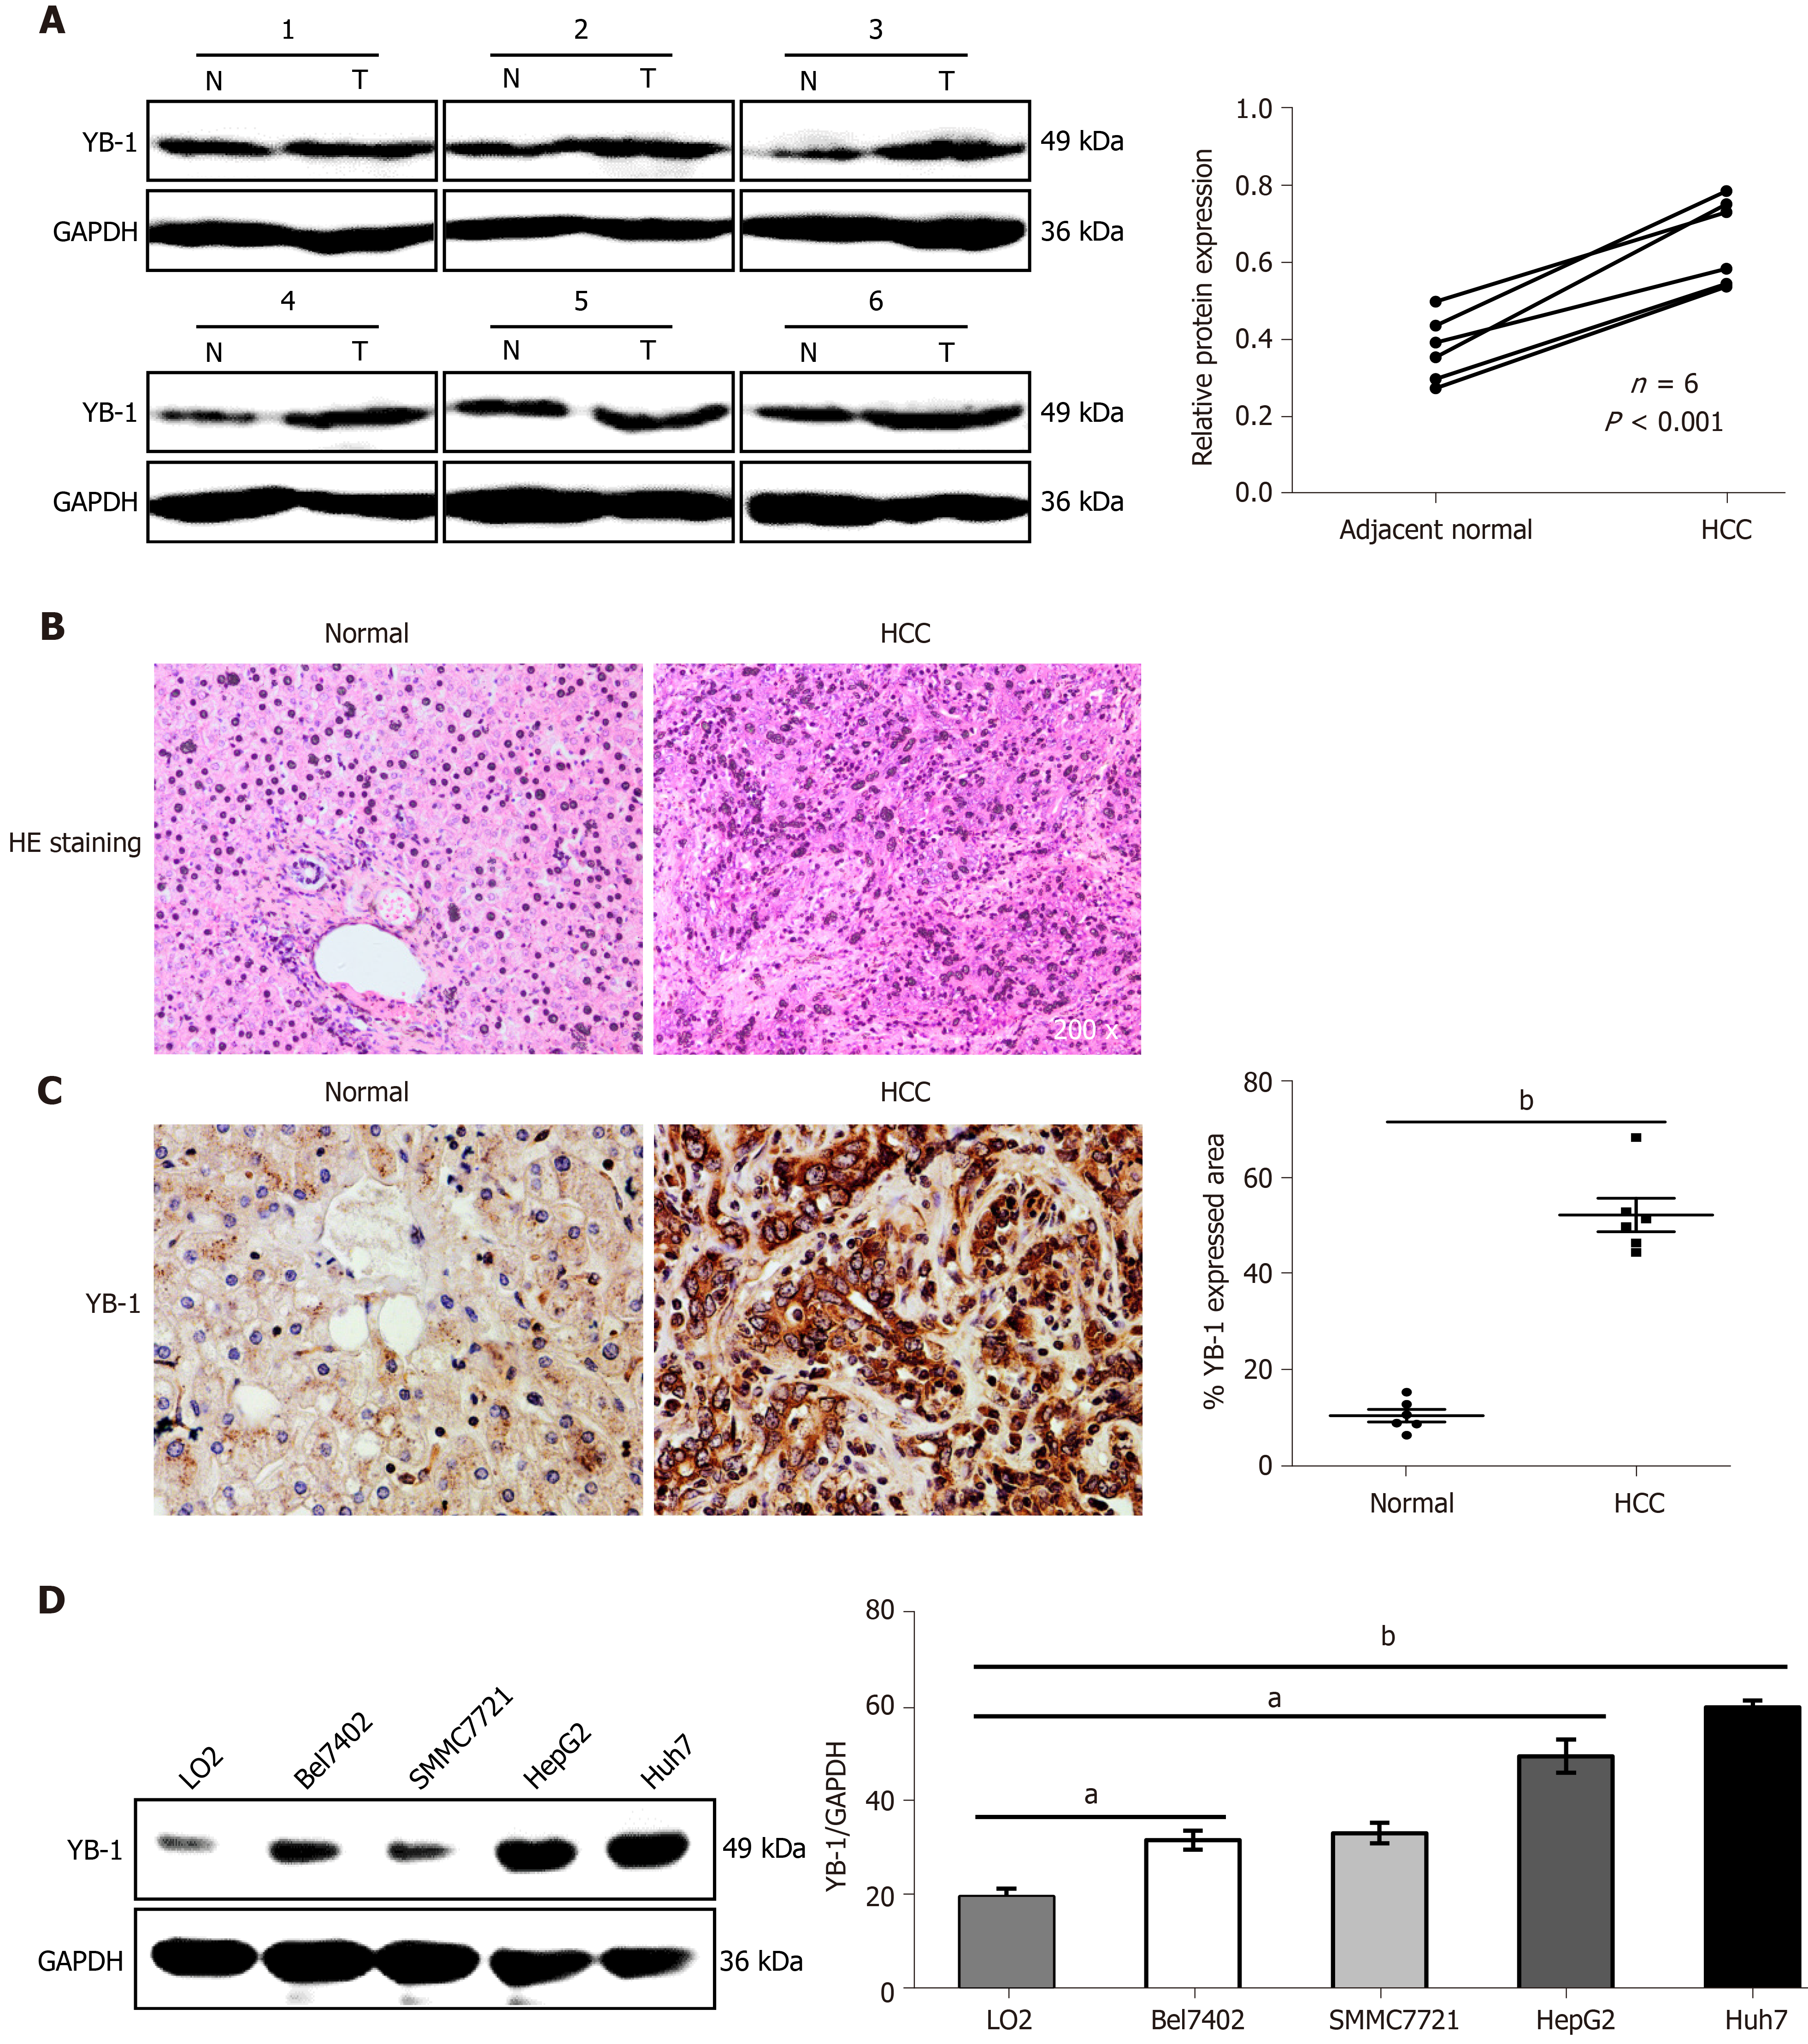
To determine the role of YB-1 in HCC, the expression of YB-1 in 6 paired HCC tissues and paracarcinoma tissues was detected by Western blot analysis. The YB-1 protein levels in HCC tissues were significantly elevated in all 6 patients (Figure 1A). To further verify the dysregulation of YB-1, we also performed IHC to detect YB-1 expression in the 6 paraffin-embedded HCC tissues and their paired adjacent liver tissues. The protein levels of YB-1 were also higher in HCC tissues than in nontumor tissues, and YB-1 was mainly located in the cytoplasm (Figure 1B, C). The expression of YB-1 was further detected in several hepatocarcinoma cell lines. Compared with the protein levels of YB-1 in LO2 cells, those in HepG2 and Huh7 cells were dramatically increased but slightly elevated in Bel7402 and SMMC7721 cells (P < 0.05) (Figure 1D). Taken together, YB-1 is elevated in HCC tissues and cell lines, implying that it might play a role in tumor progression.
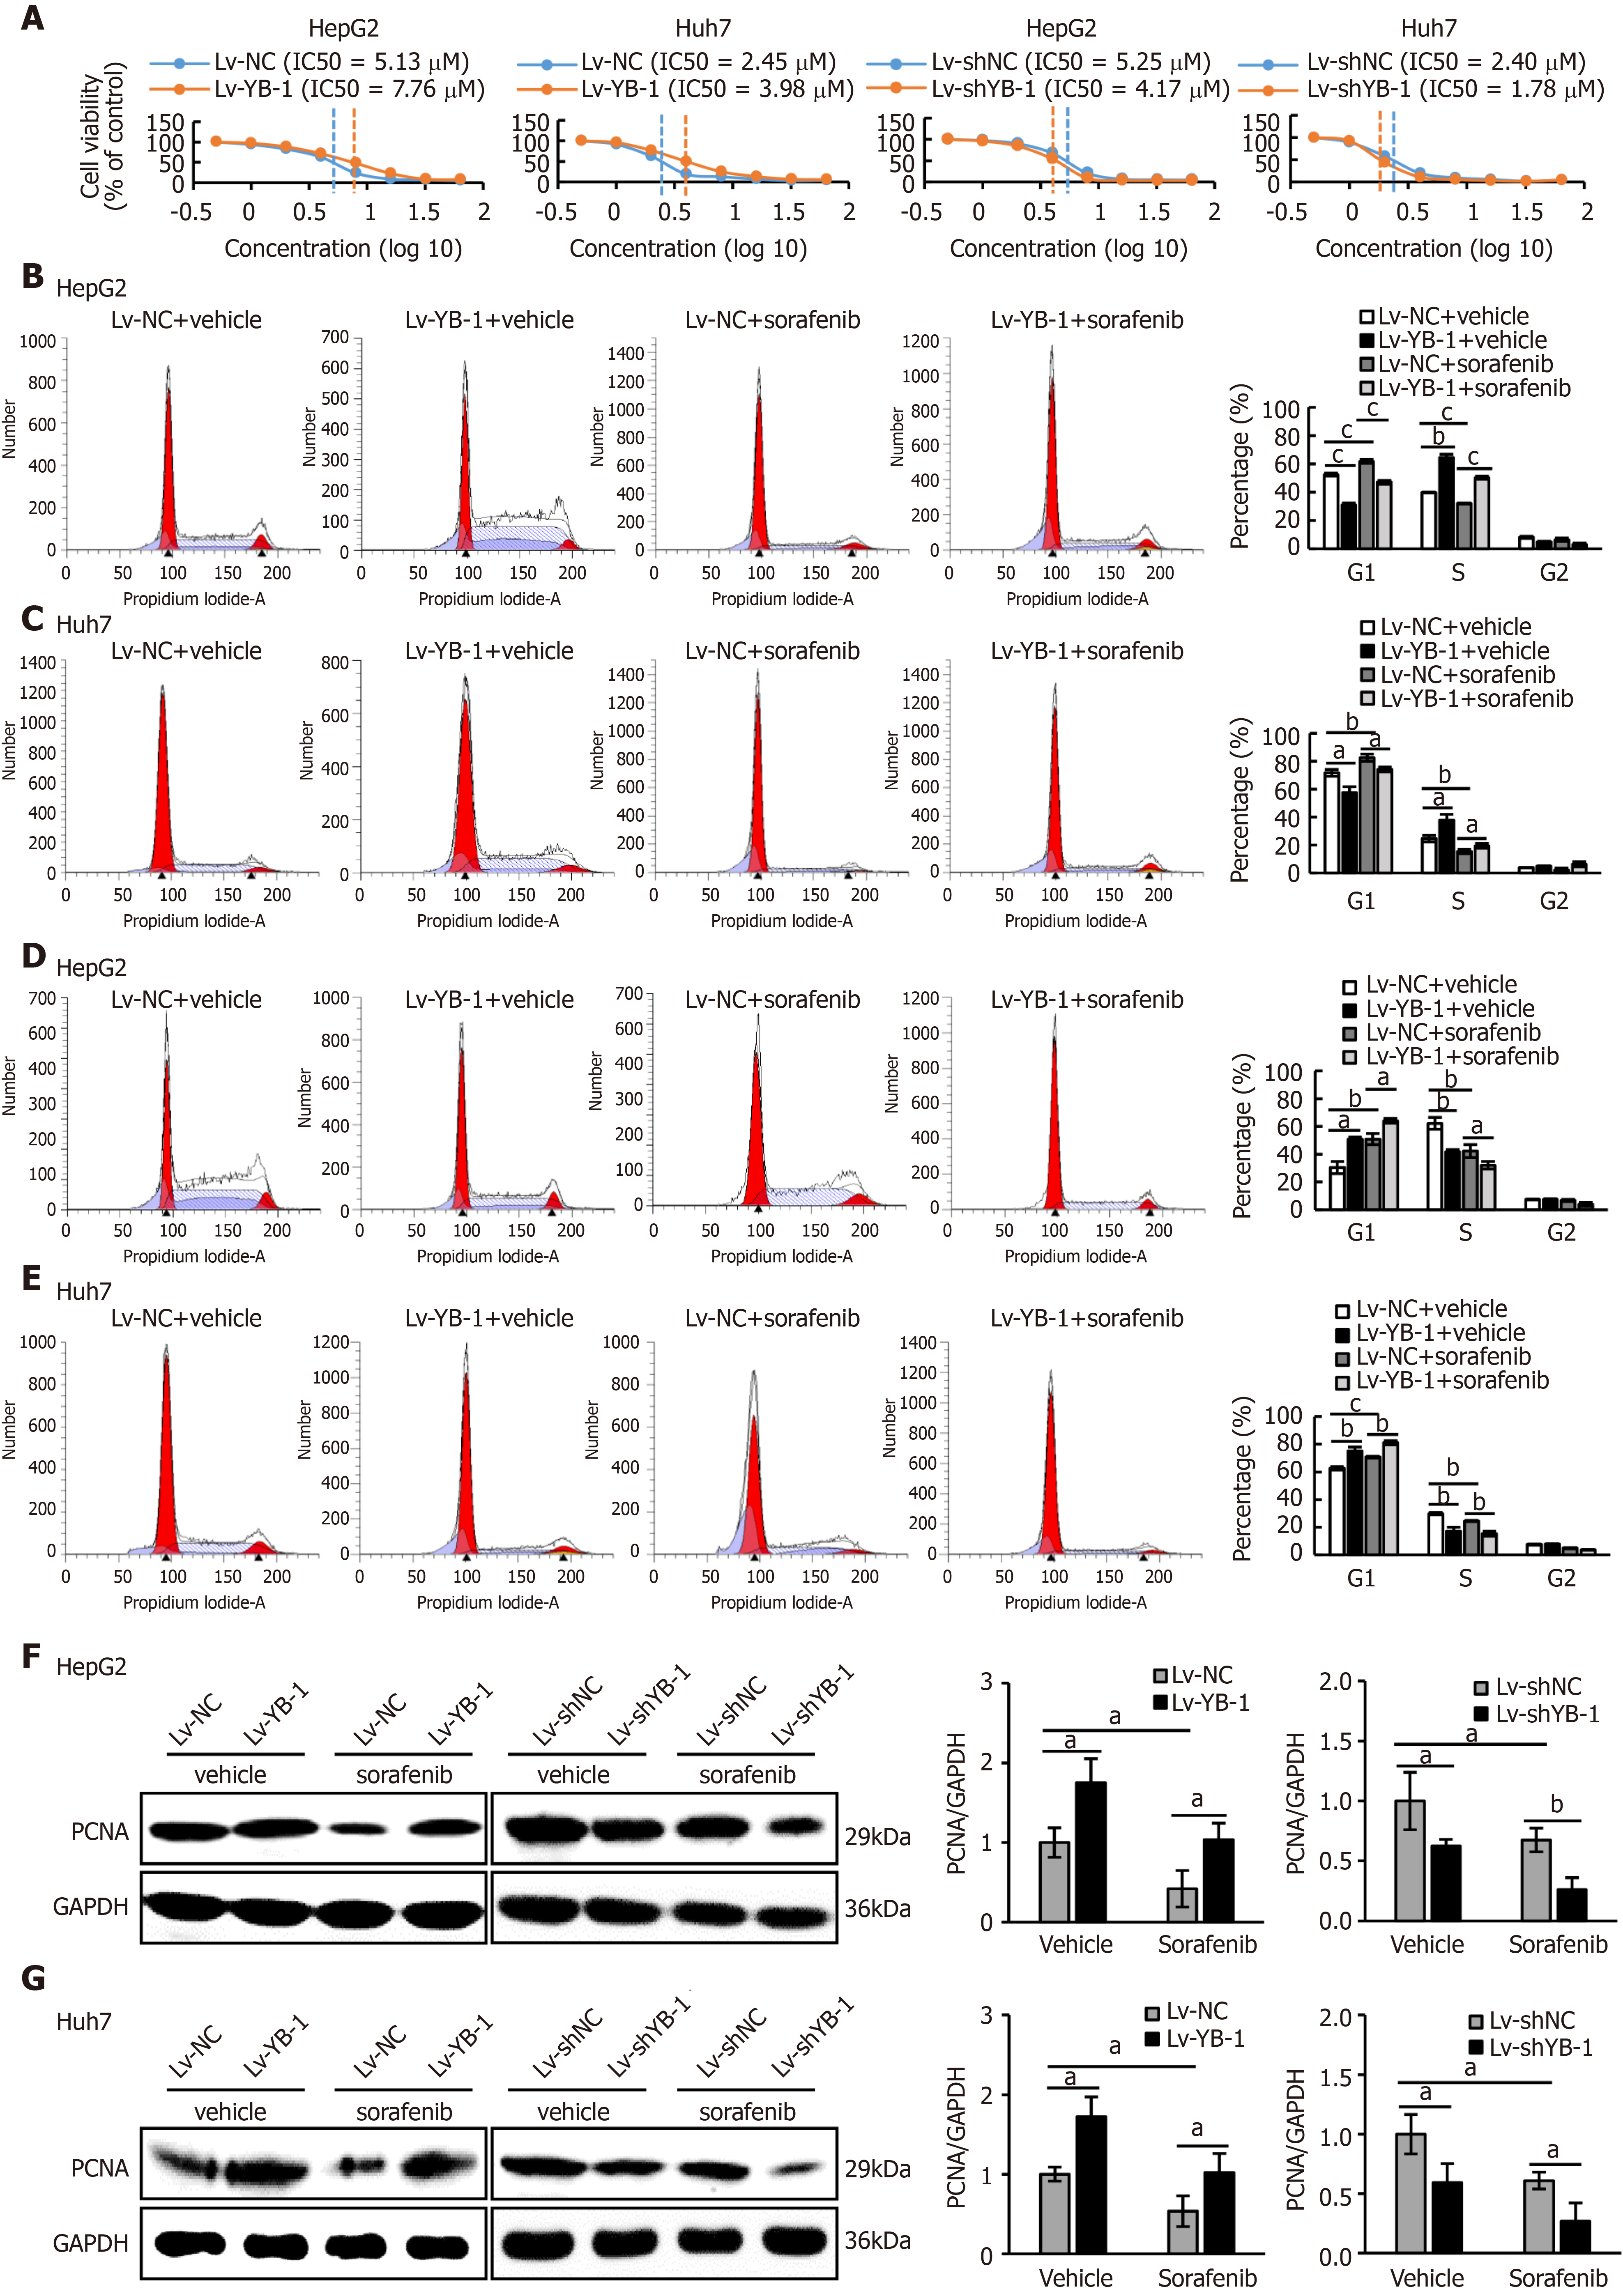
Recent studies have shown that YB-1 is related to anticancer drug resistance in multiple tumor types. The IC50 of sorafenib in HCC cell lines was tested, and the IC50 values of Bel7402, SMMC7721, HepG2 and Huh7 cells were 4.47 μmol/L, 3.98 μmol/L, 5.01 μmol/L, and 2.51 μmol/L, respectively (Supplementary Figure S1A). We also found that YB-1 protein levels were upregulated in Bel7402, SMMC7721, HepG2 and Huh7 cells 24 h after sorafenib treatment (Supplementary Figure S1B). The transfection efficiency of the YB-1 siRNA and lentivirus is displayed in Supplementary Figure S2. We further tested the IC50 values of sorafenib in HepG2 and Huh7 cells with overexpressed or knocked down YB-1. The IC50 values were increased after YB-1 overexpression, whereas they were lower in the two cell lines with Lv-shYB-1 (Figure 2A).
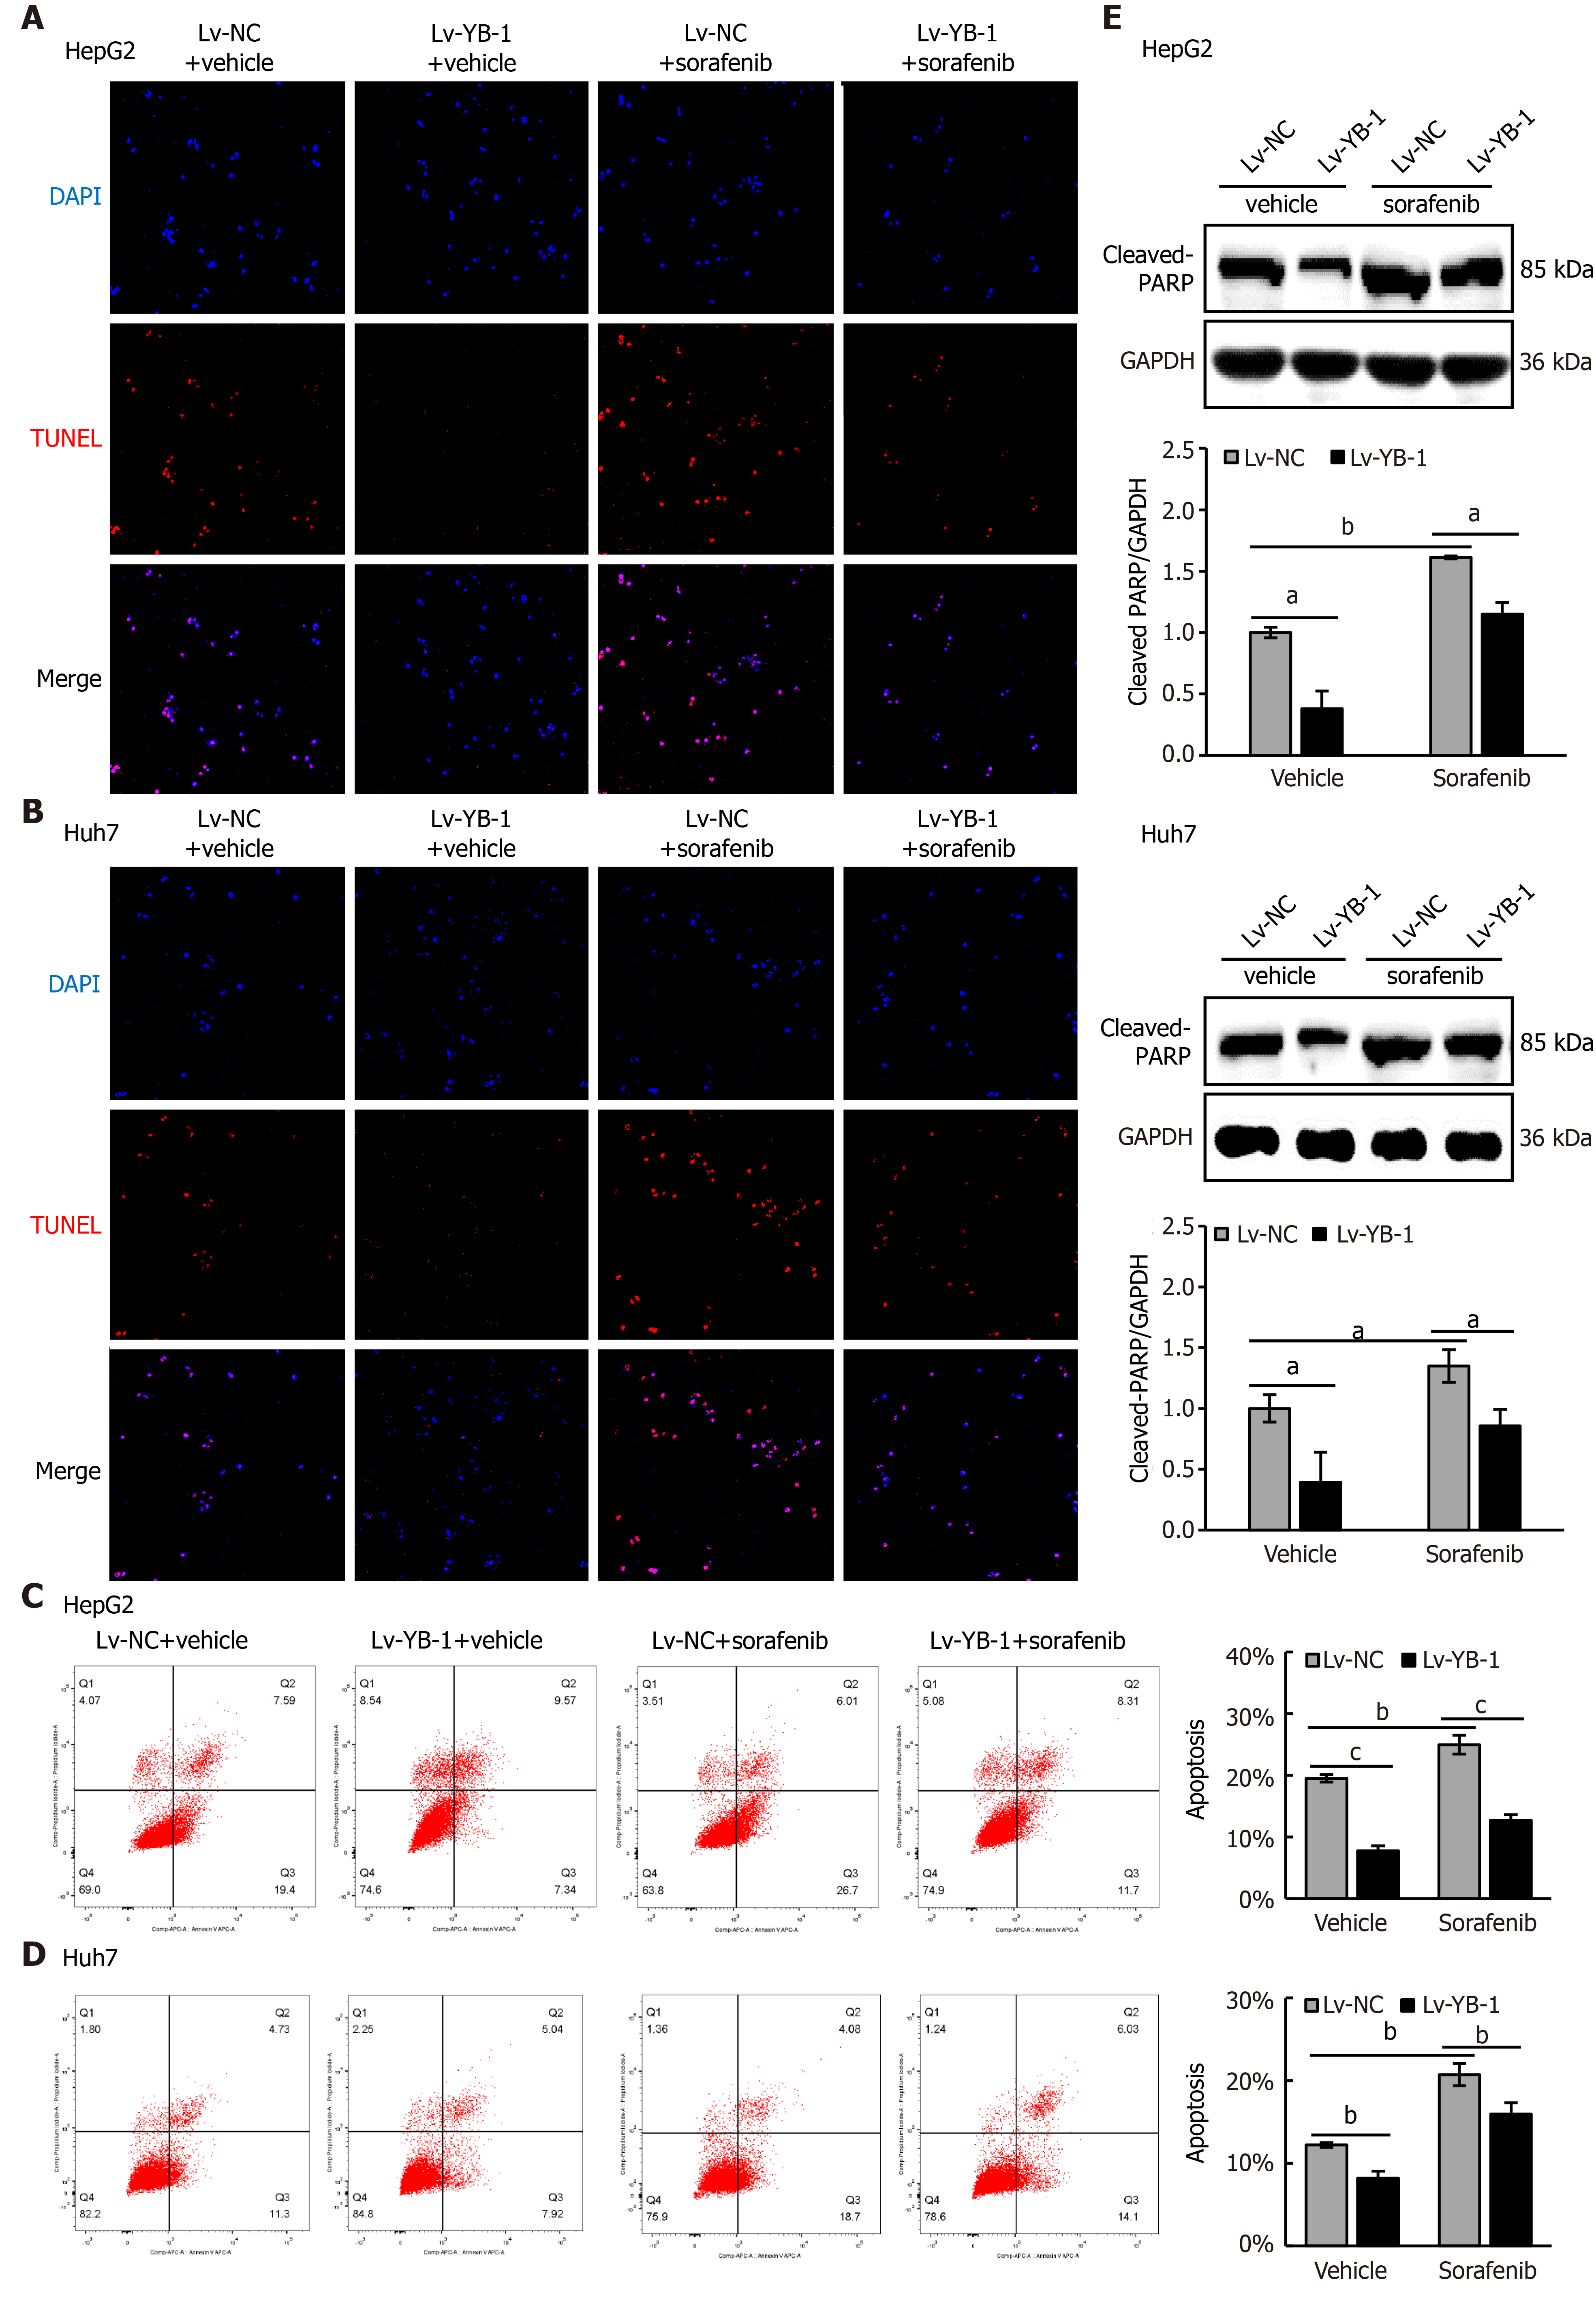
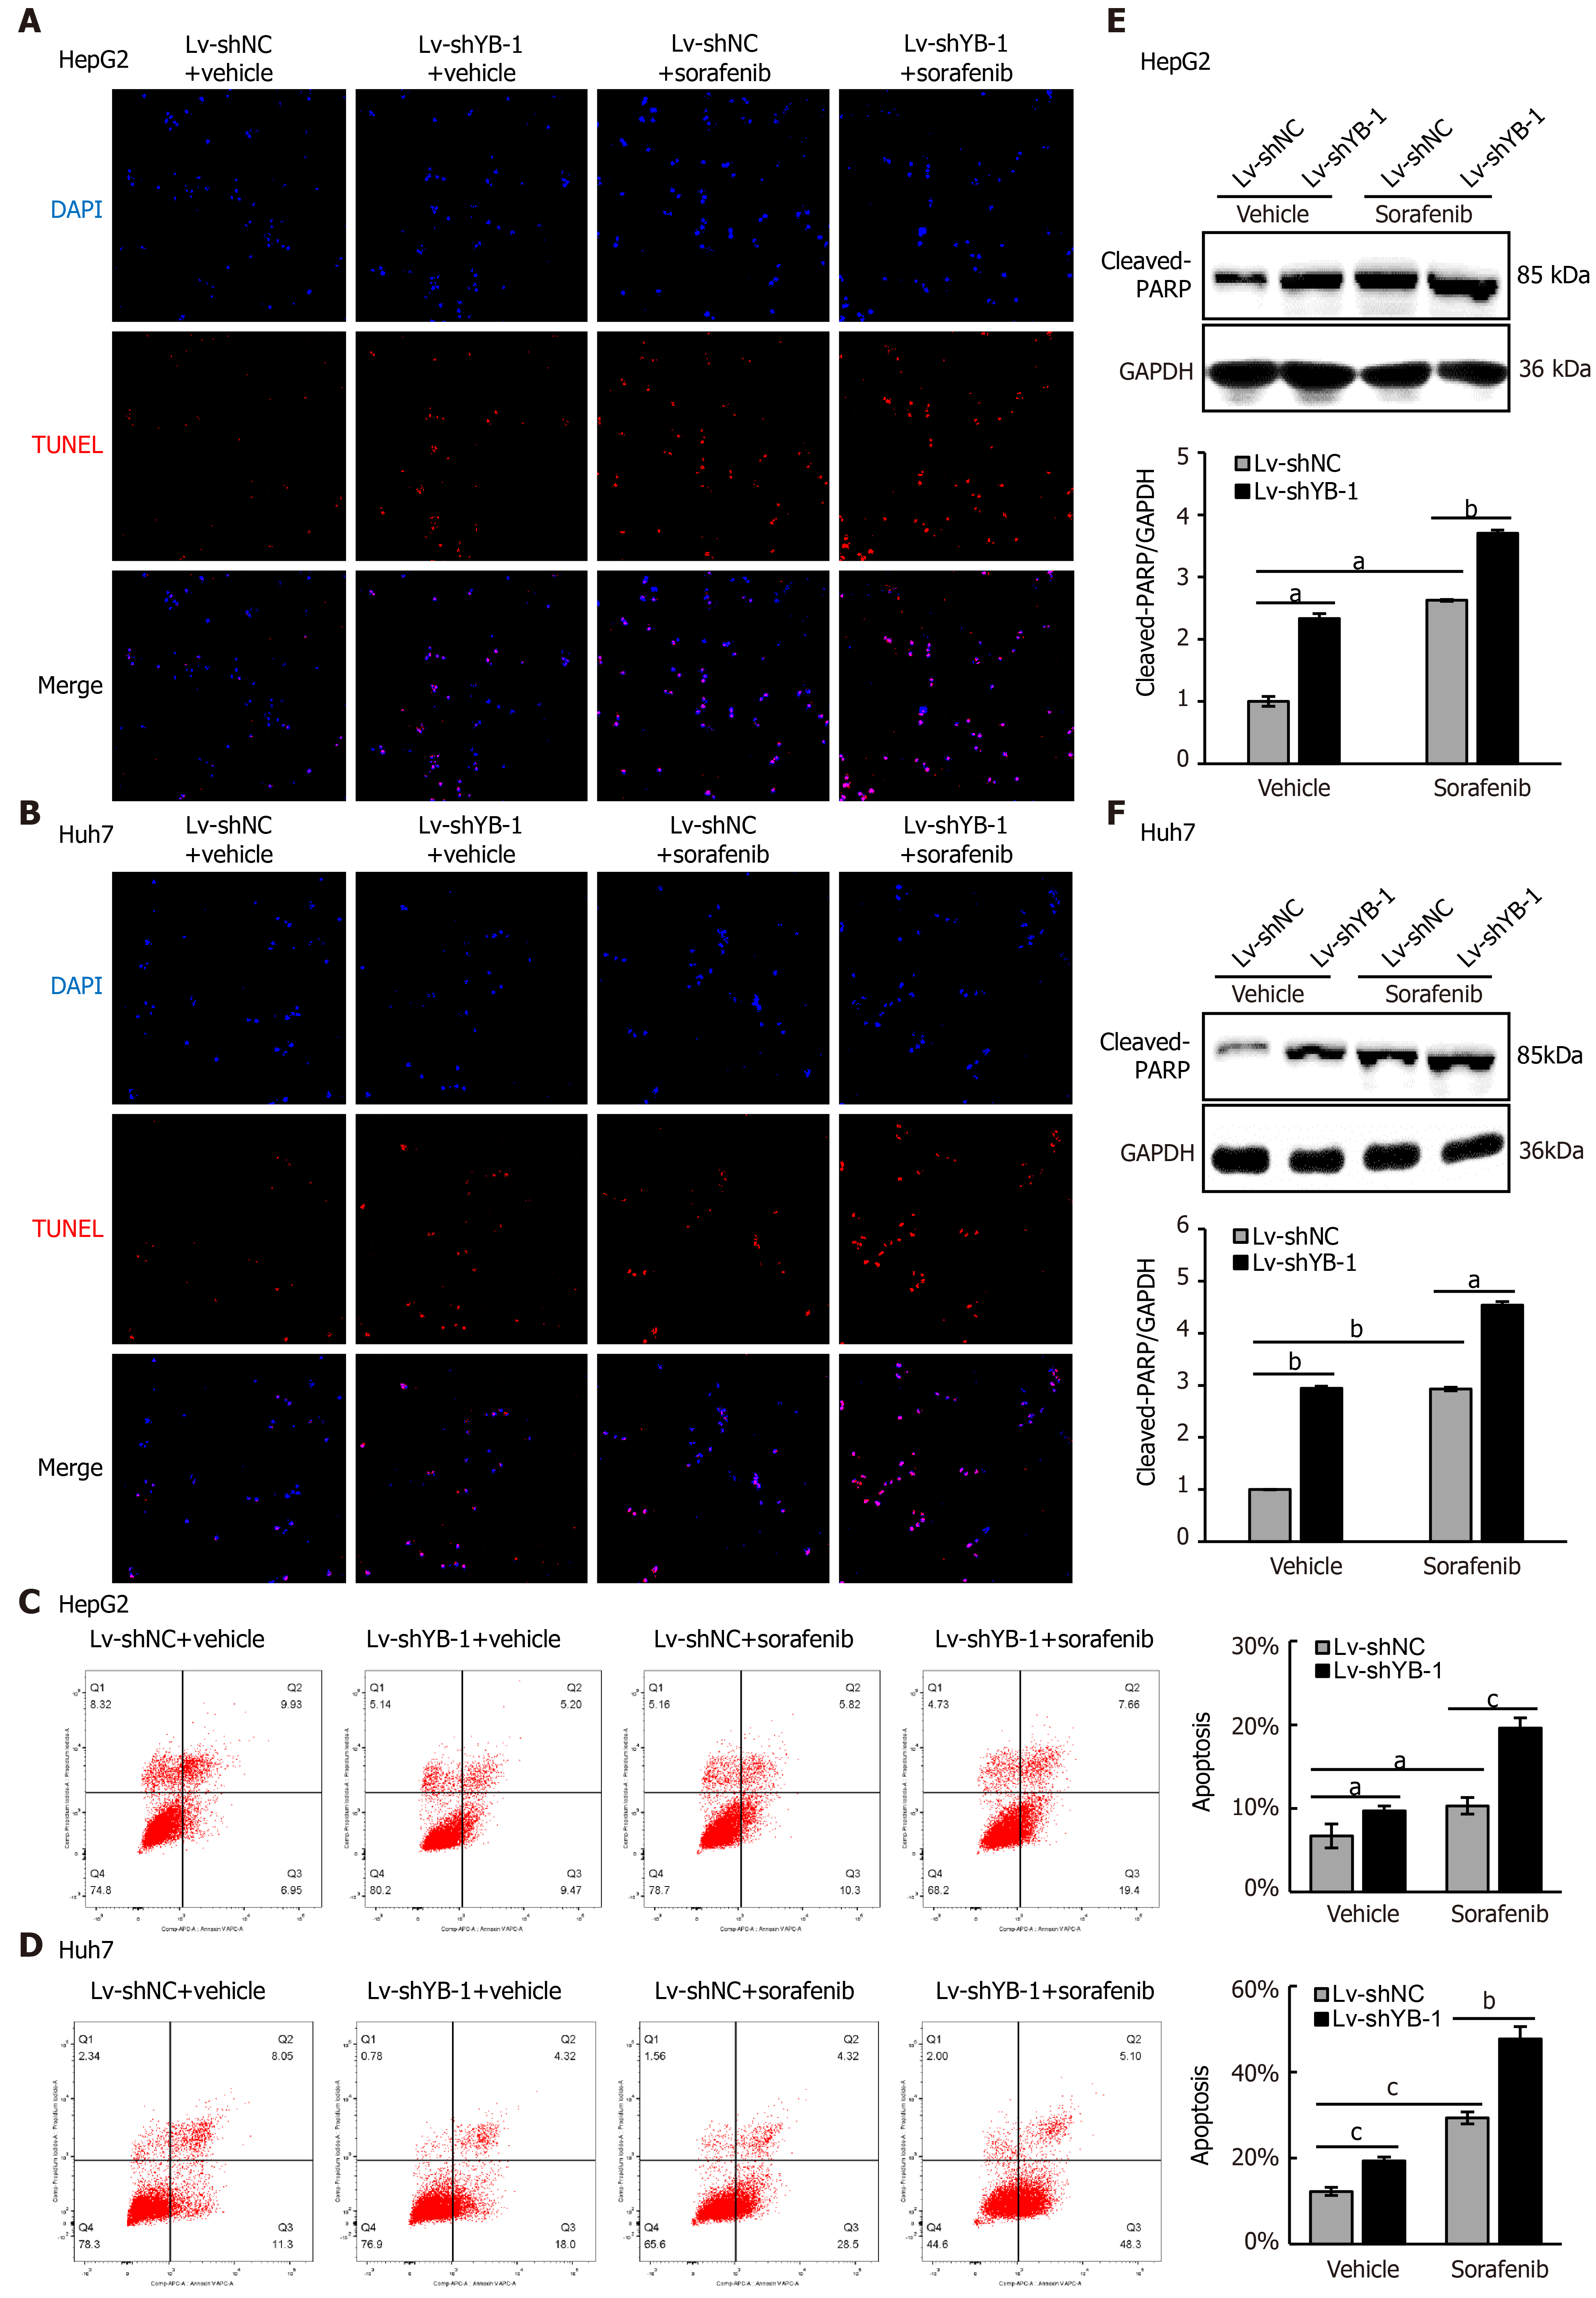
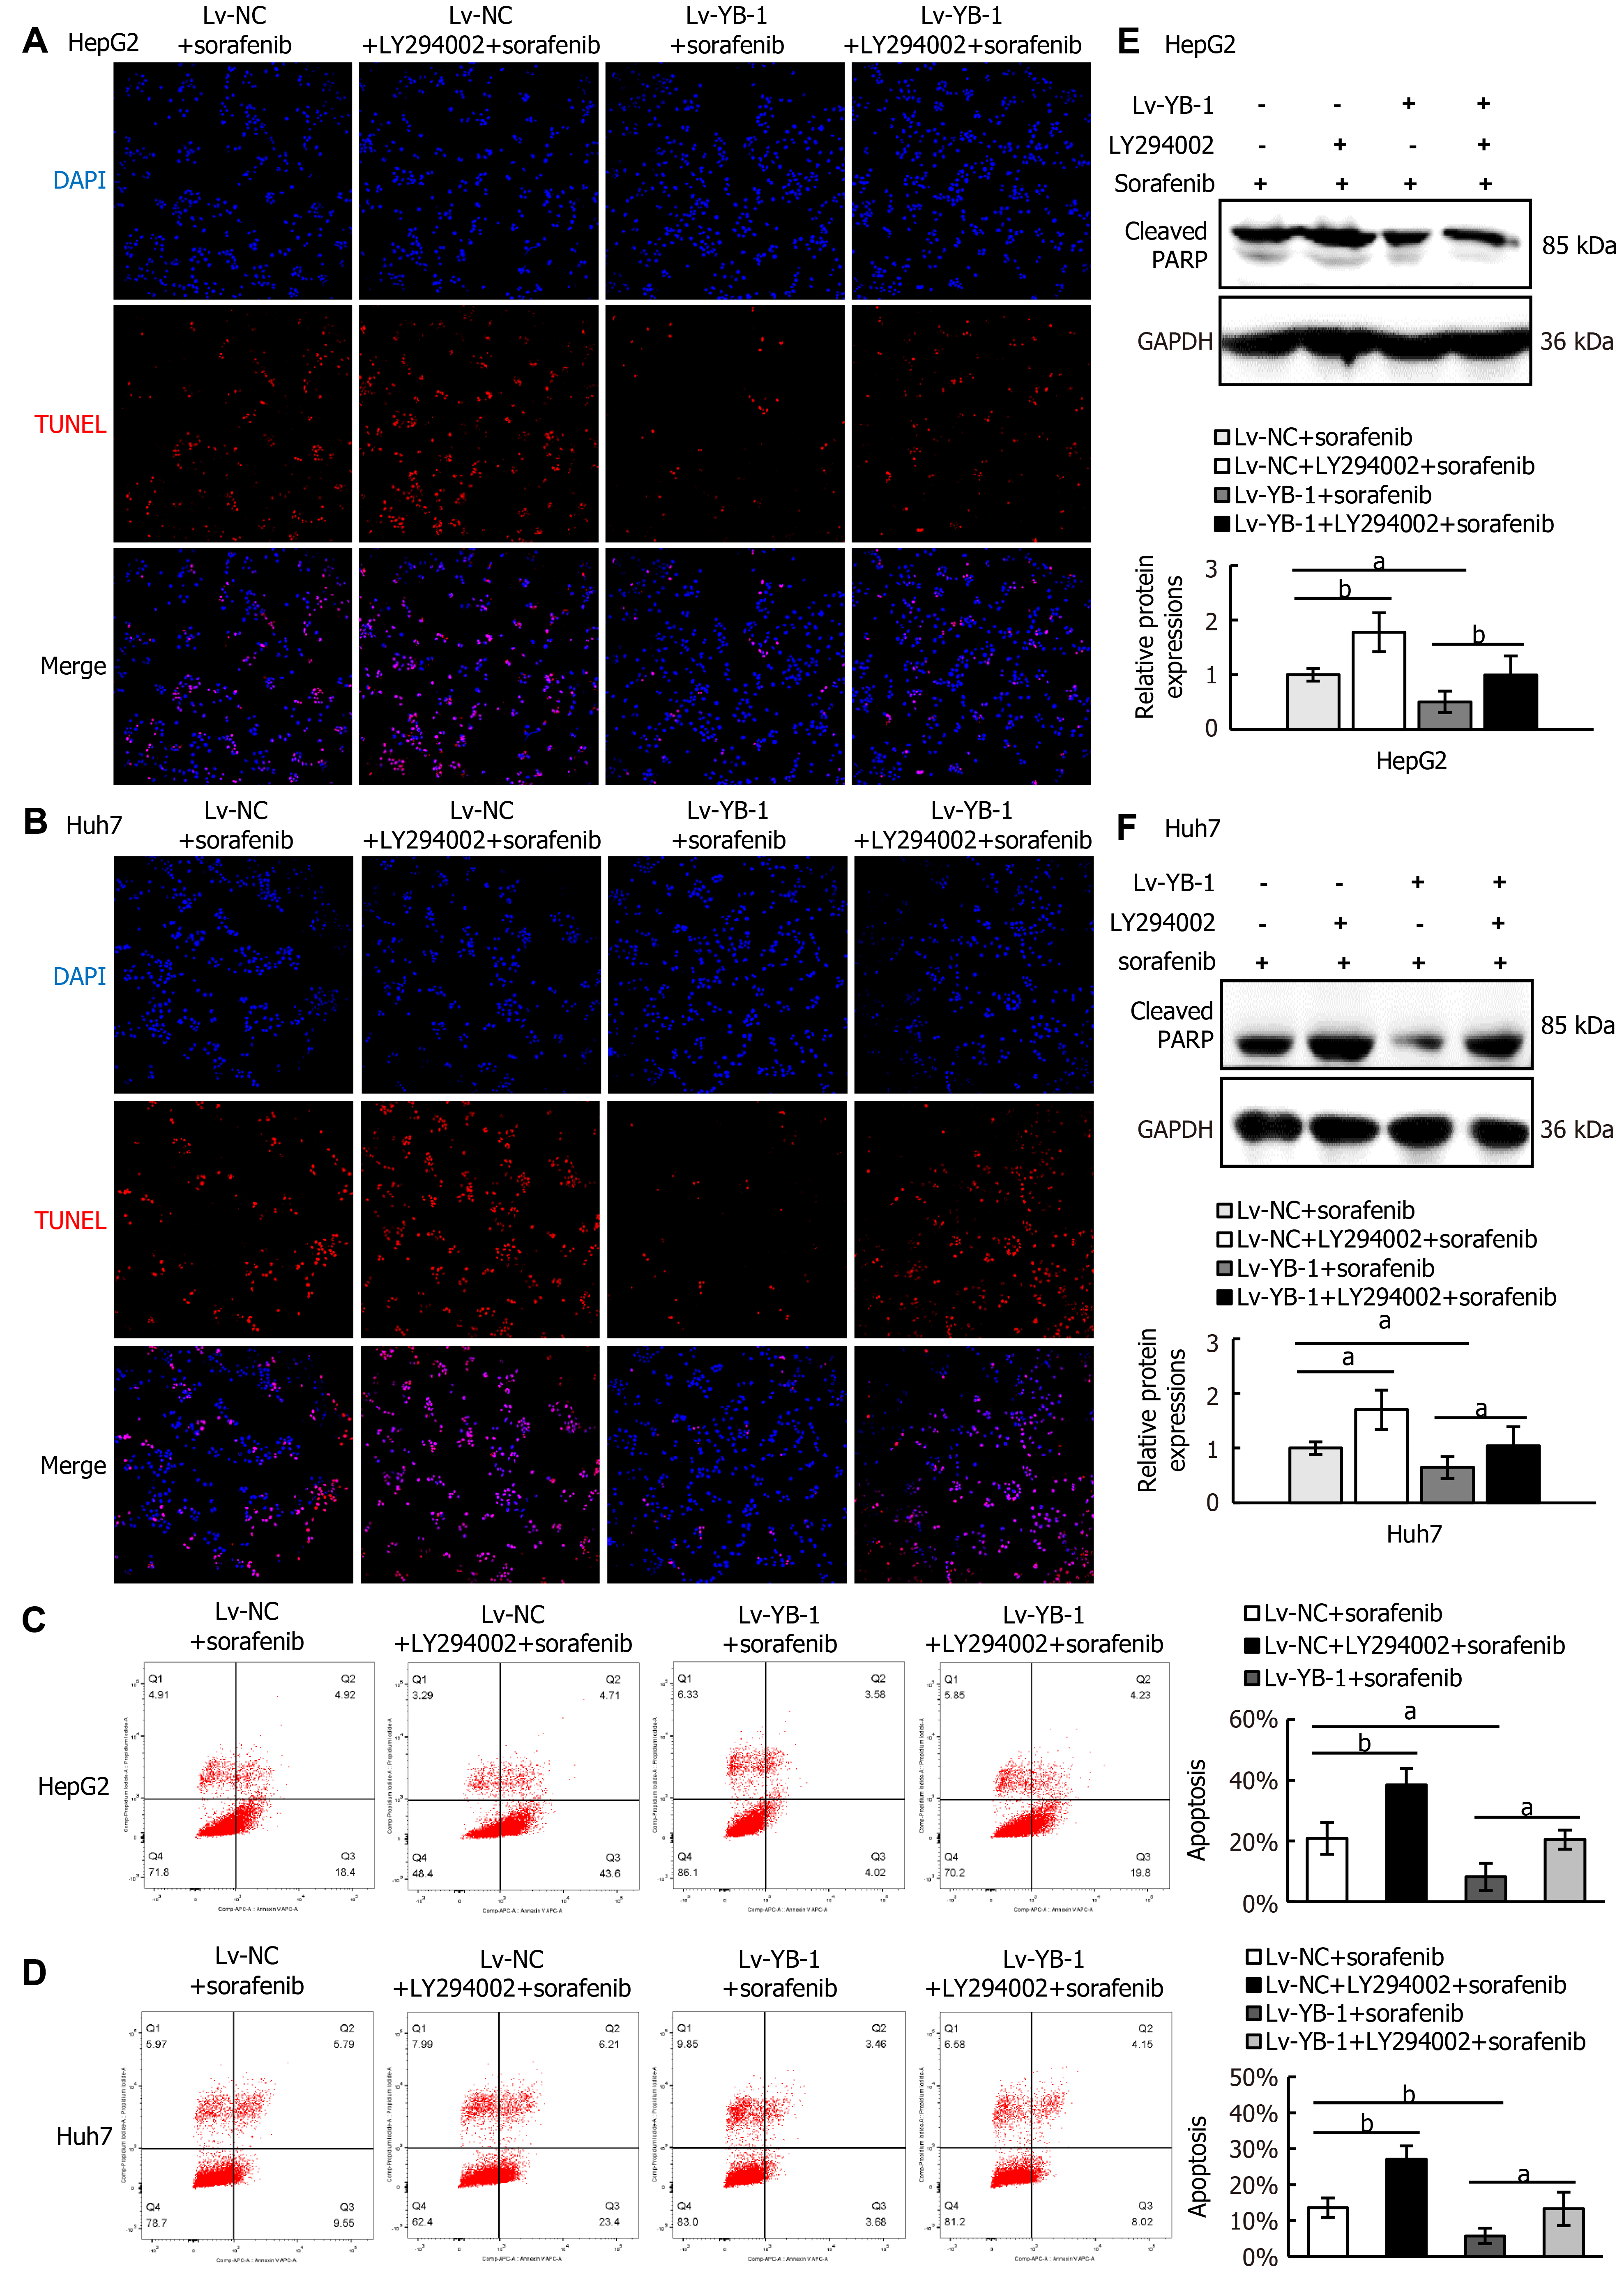
Hereafter, we elucidated the effects of YB-1 and sorafenib on cell proliferation and apoptosis in HepG2 and Huh7 cells. Overexpressing YB-1 decreased the number of G1-phase cells and increased the number of S-phase cells, and sorafenib restrained the increase in G1-phase cells and reduced the number of S-phase cells (Figure 2B, C). Simultaneously, YB-1 silencing resulted in increased G1-phase and reduced S-phase cells and enhanced the effect of sorafenib on G1-phase and S-phase cells (Figure 2D, E). Additionally, we examined the levels of PCNA and found that it was increased in cells with YB-1 overexpression that the YB-1 overexpression offset PCNA reduction caused by sorafenib and that the knockdown of YB-1 had opposite effects in HepG2 (Figure 2F) and Huh7 cells (Figure 2G). These results indicated that YB-1 played a very important role in the G1/S transition in sorafenib-resistant HCC cell lines. Next, apoptosis was analyzed by TUNEL and flow cytometric analysis in HepG2 and Huh7 cells. YB-1 overexpression decreased cell apoptosis and reduced apoptosis induced by sorafenib (Figure 3A-D), while YB-1 knockdown strengthened the effect of sorafenib in HepG2 and Huh7 cells (Figure 4A-D). Furthermore, the protein levels of cleaved PARP decreased after YB-1 overexpression, which reduced the sorafenib-induced protein expression of activated PARP (Figure 3E, F). However, YB-1 knockdown played an opposite role in HepG2 and Huh7 cells (Figure 4E, F). Overall, these data proved that YB-1 mediated sorafenib resistance in liver cancer cell lines.
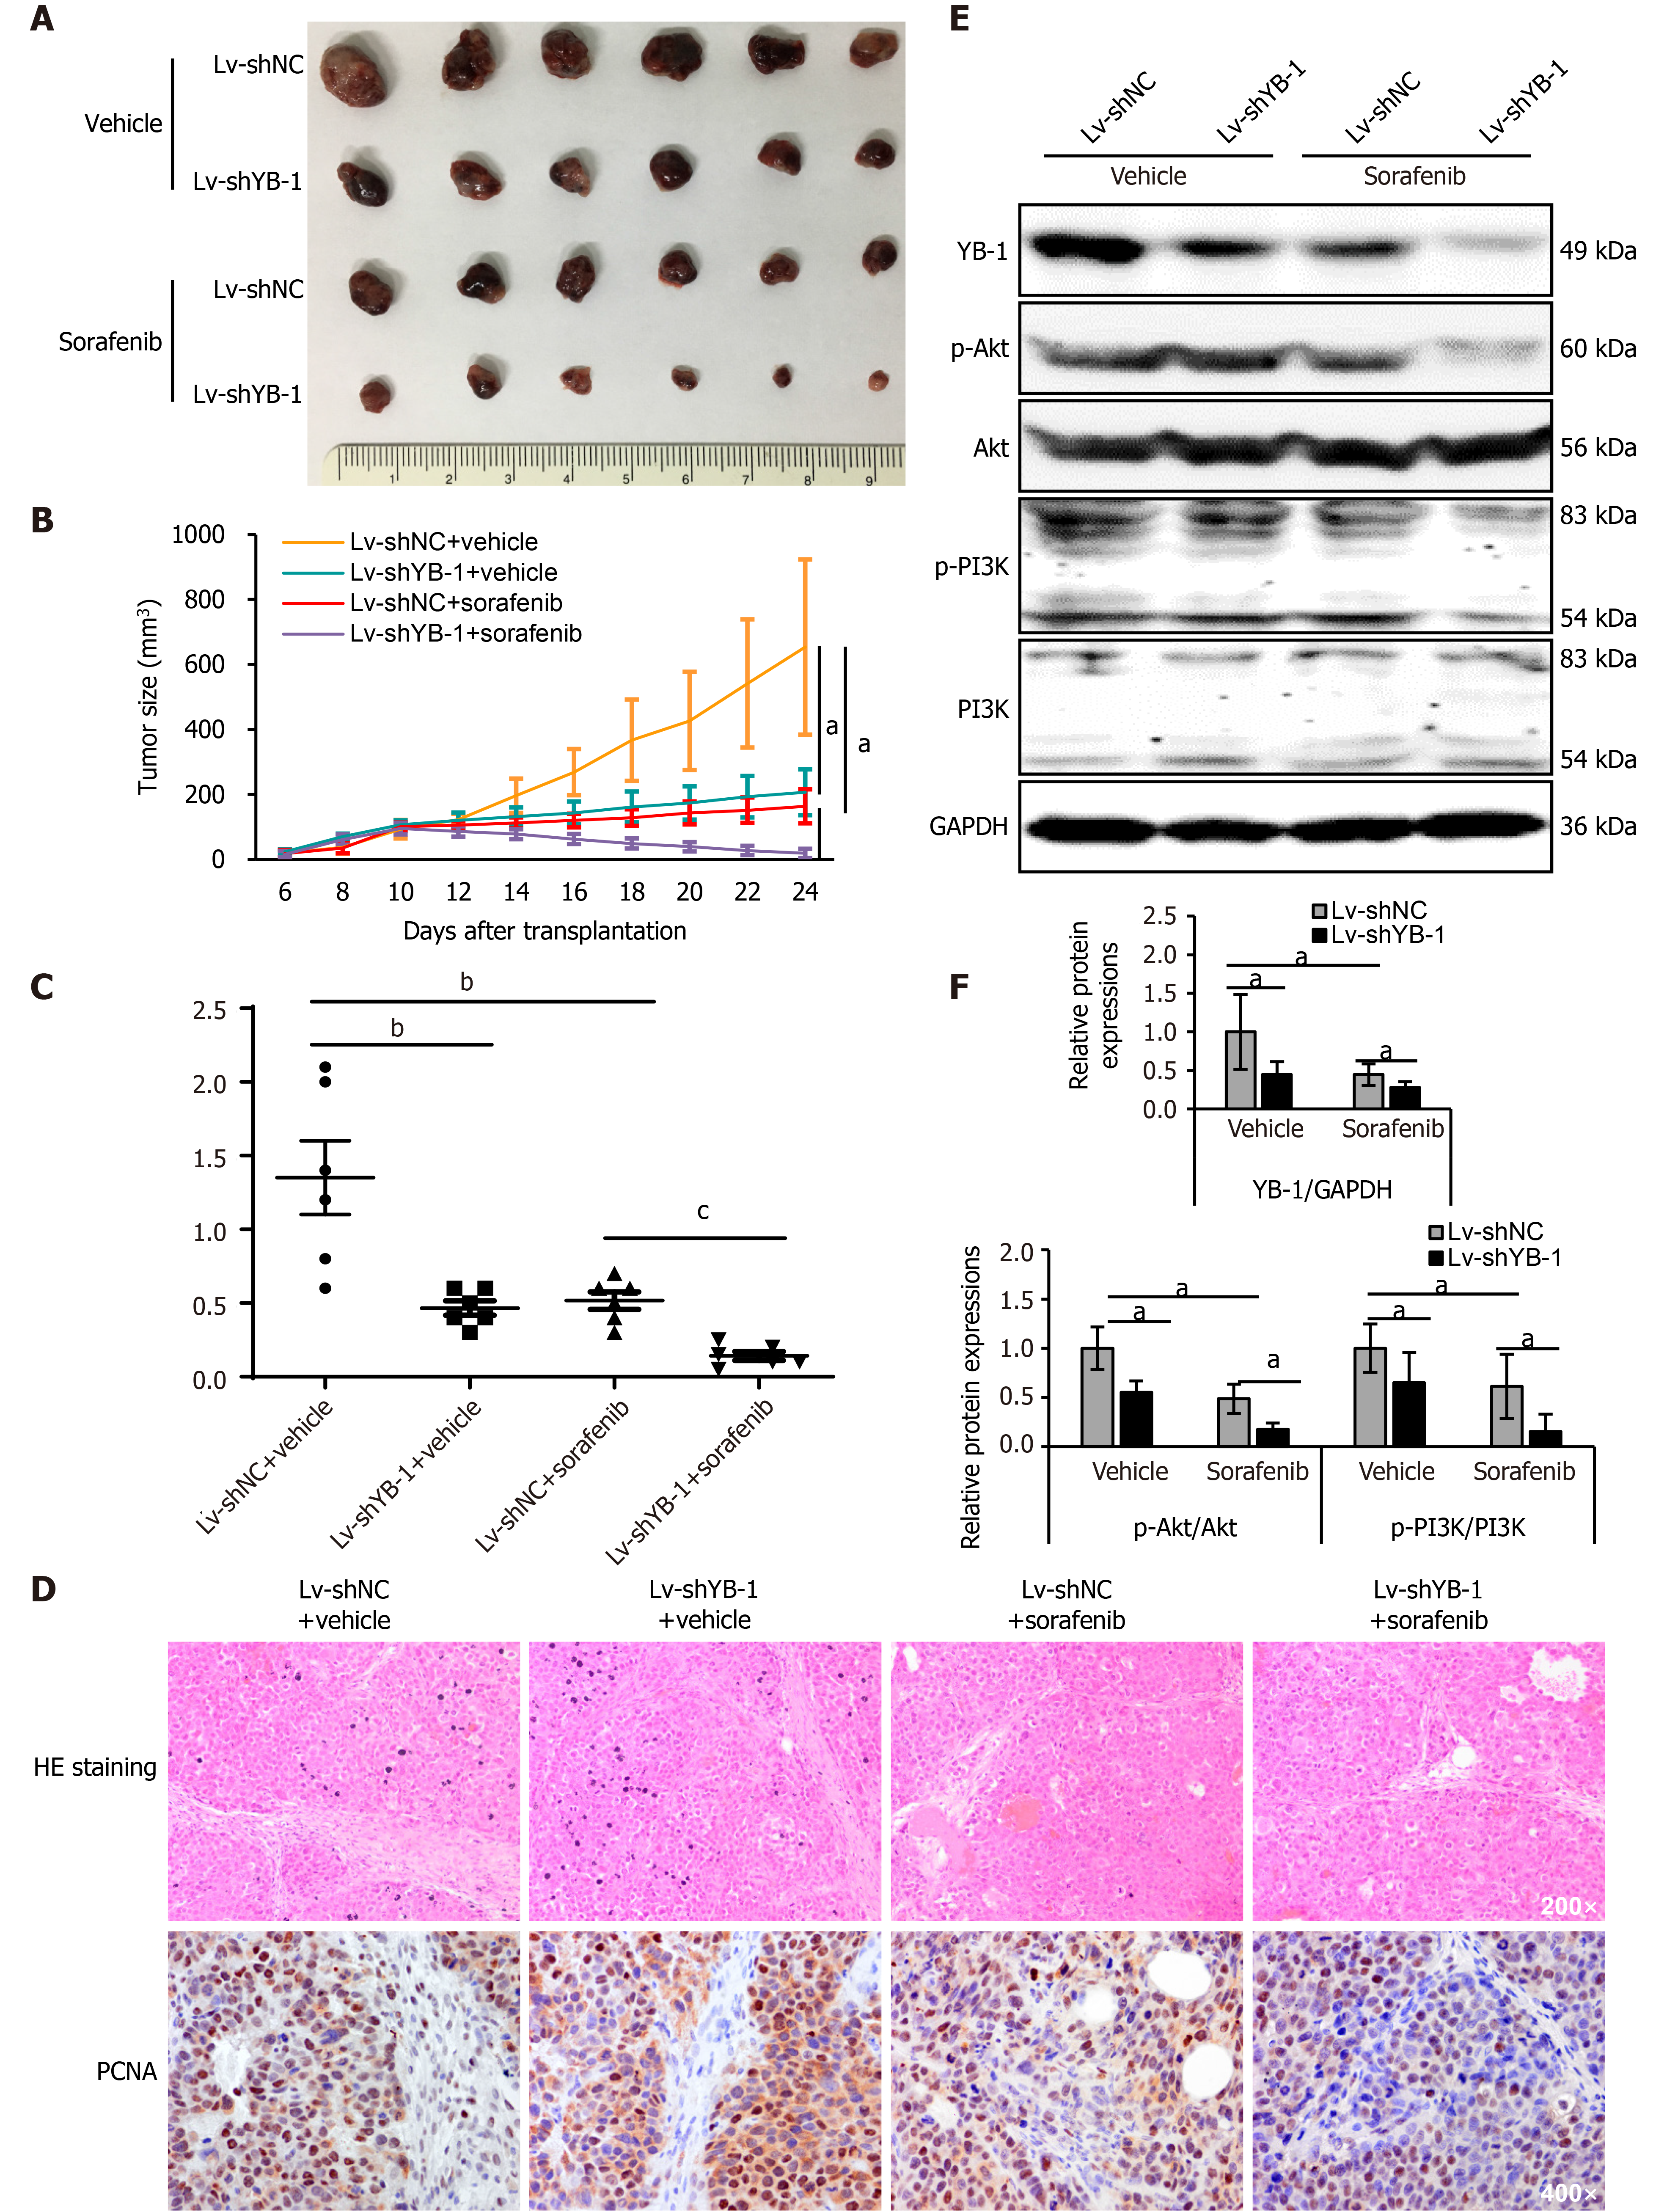
Xenograft tumor models were constructed using Huh7 cells with stable YB-1 knockdown. Tumor growth was suppressed both by YB-1 knockdown and sorafenib treatment. Nevertheless, the most obvious suppression was achieved by the amalgamation of YB-1 knockdown and sorafenib therapy (Figure 5A, B and Supplementary Figure S3). Additionally, YB-1 knockdown notably promoted the efficiency of sorafenib by examining tumor weights (Figure 5C). IHC staining also showed that the protein expression levels of PCNA in cells of the Lv-shYB-1 + sorafenib group were the lowest compared with those in cells with YB-1 knockdown or sorafenib treatment alone (Figure 5D). Furthermore, we extracted protein from xenograft tumors and found that the p-Akt and p-PI3K protein levels were downregulated after YB-1 knockdown or sorafenib treatment, and the most dramatic reduction occurred in the Lv-shYB-1 + sorafenib group (Figure 5E and F). Together, these results showed that YB-1 knockdown mitigated the resistance to sorafenib and reinforced the antitumor efficacy.
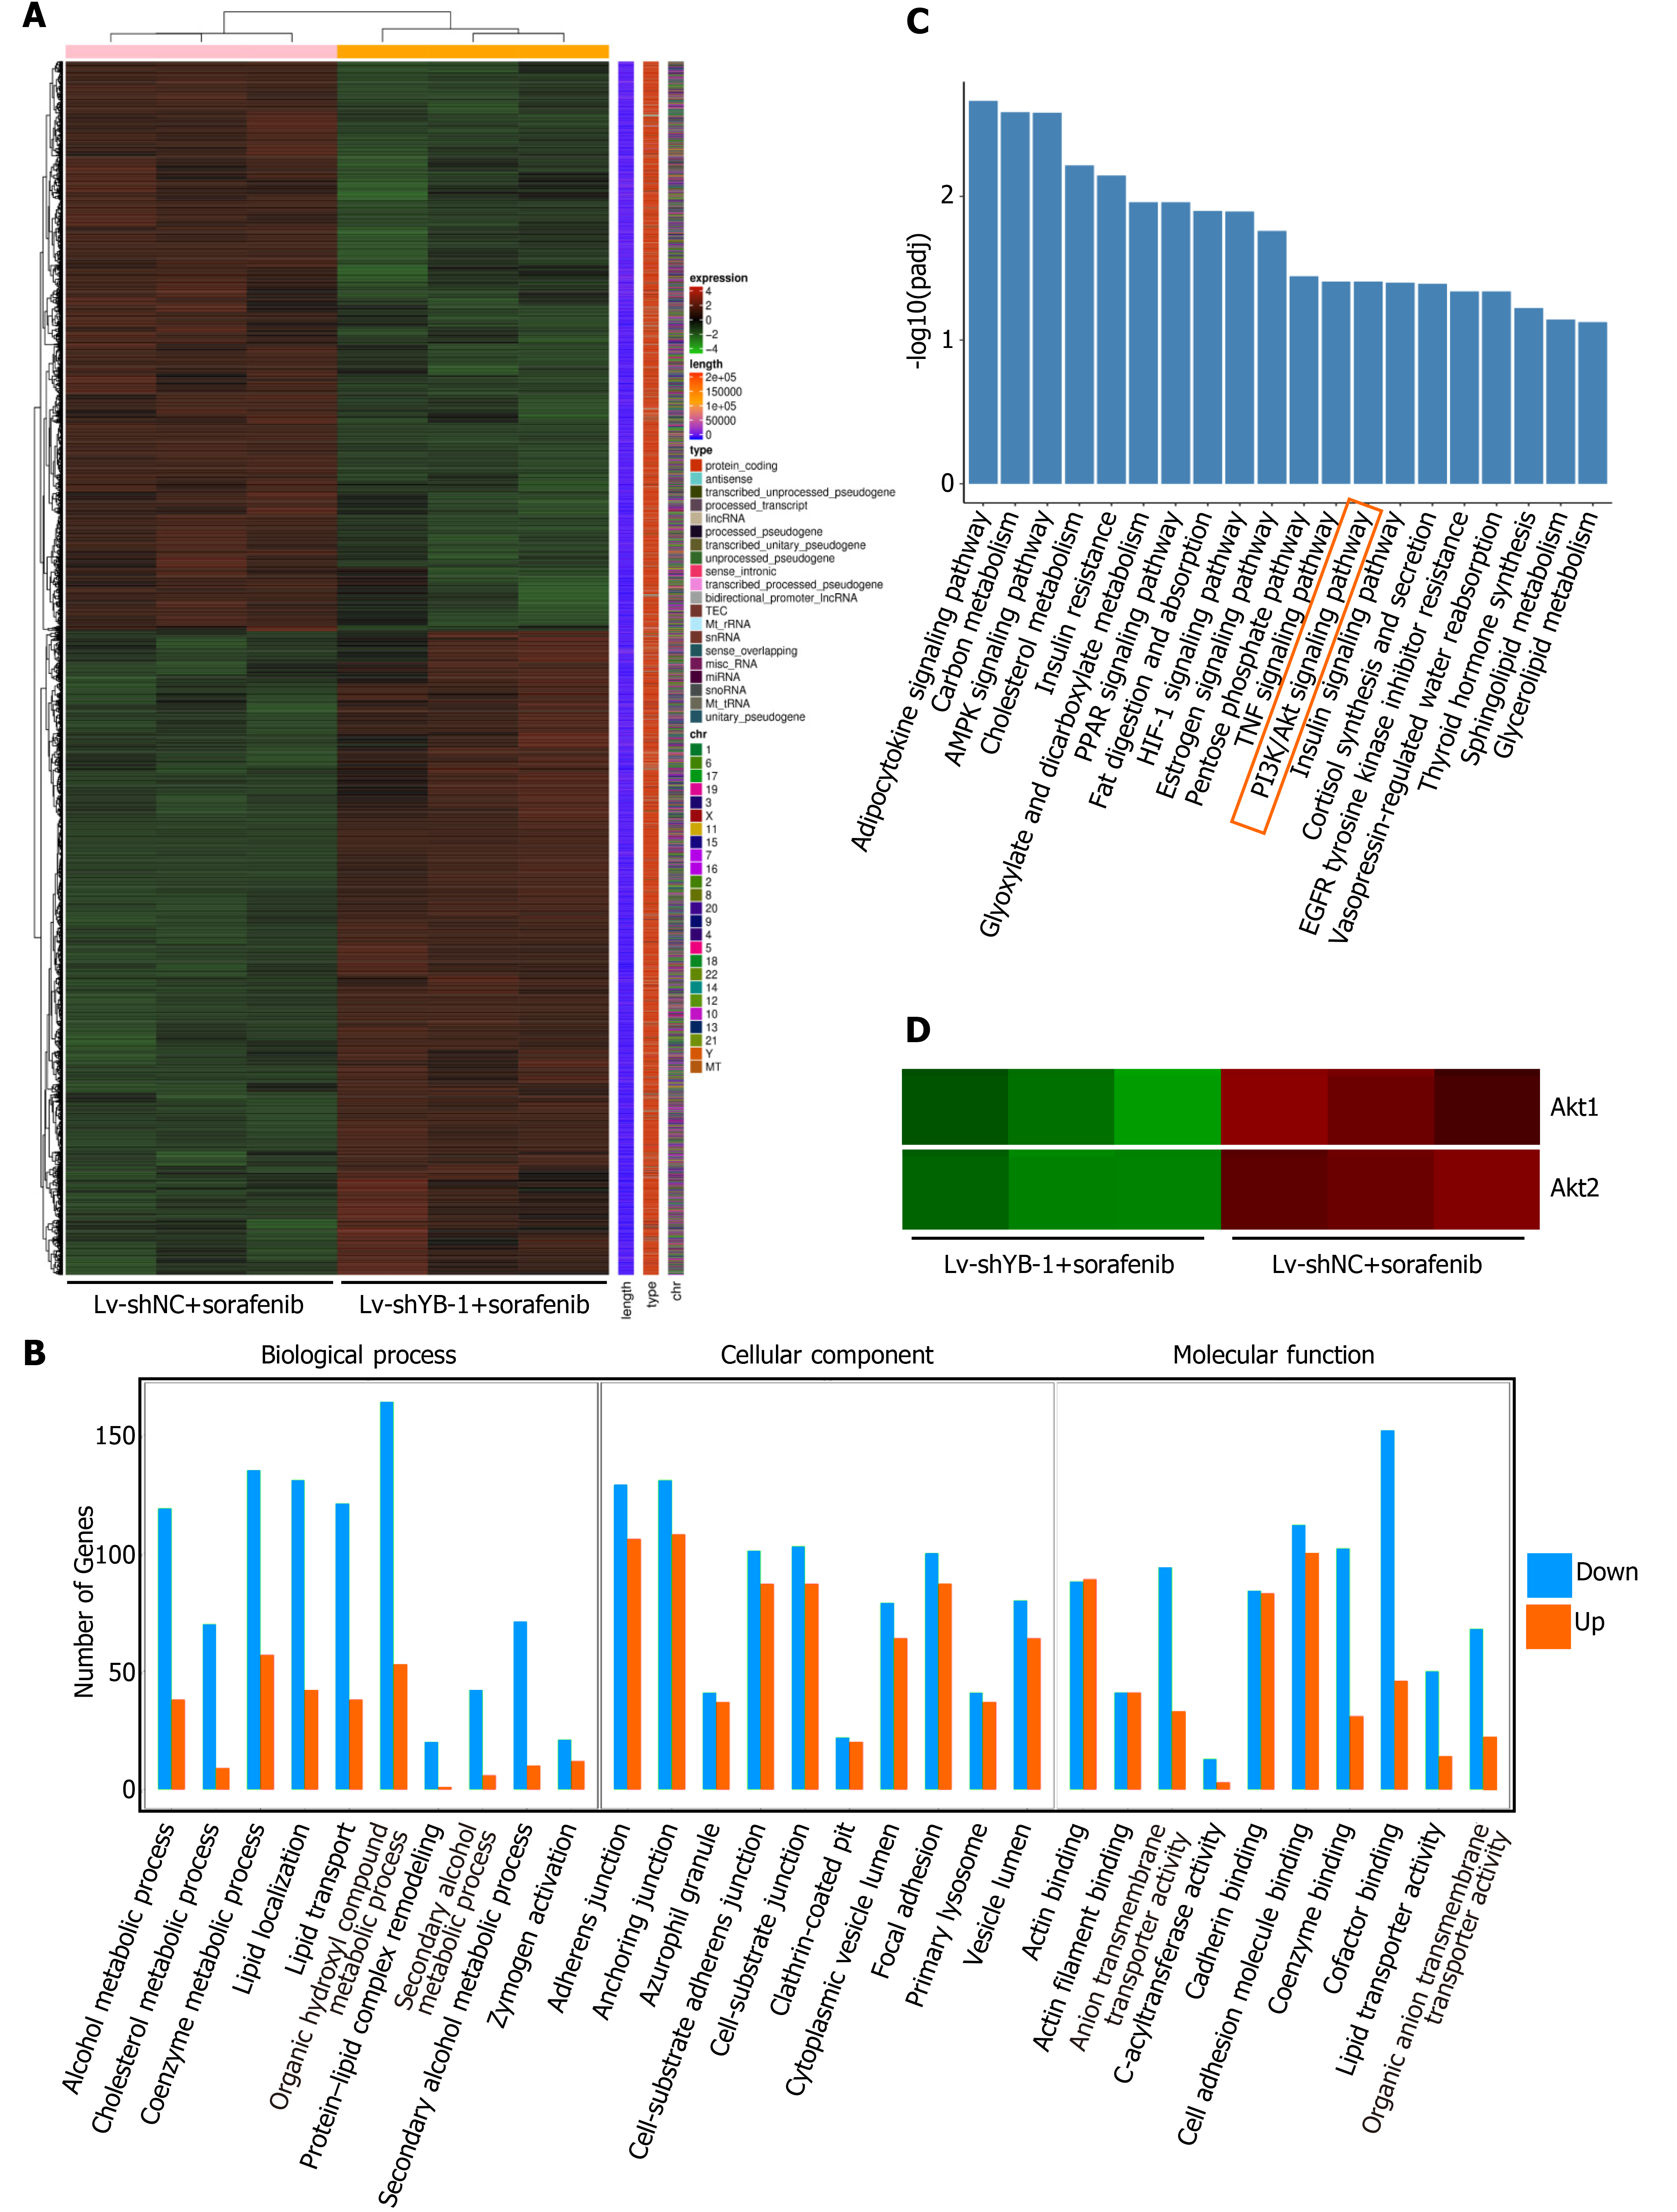
In total, 6254 significant differentially expressed genes were detected between the Lv-shYB-1 + sorafenib and Lv-shNC + sorafenib groups, among which 3317 were downregulated and 2937 were upregulated. The differentially expressed genes in the Lv-shYB1 + sorafenib and Lv-shNC + sorafenib groups were merged as the differential gene set. Mainstream hierarchical clustering was used to cluster the FPKM values (expected number of fragments per kilobase of transcript sequence per million base pairs sequenced) of the differential gene set to gather genes with similar expression patterns. The hierarchical clustering heatmap (Figure 6A) showed that the expression patterns of genes in the Lv-shYB1 + sorafenib group were distinguishable from those of the Lv-shNC + sorafenib group.
We identified the functional categories and signaling pathways using GO and KEGG pathway analyses[25]. The differentially expressed genes were categorized into three major GO categories: biological process (BP), cellular component (CC) and molecular function (MF). The top 30 GO categories are shown in Figure 6B. The differentially expressed genes were mapped to the reference canonical pathways using KEGG. The top 20 KEGG pathways were demonstrated in Figure 6C. Additionally, we searched the BioGRID (https://thebiogrid.org/) and HitPredict (www.hitpredict.org/) websites to explore the potential YB-1-interacting proteins. In the top 20 KEGG pathways, we found two key proteins that interact with YB-1 in the PI3K/Akt signaling pathway: (1) Akt1: activated Akt binds to the YB-1 cold shock domain at Ser102[26,27]; and (2) phosphoinositide-3-kinase regulatory subunit 1 (PIK3R1): PI3K is a critical regulator in the PI3K/Akt pathway, and YB-1 is one of the 49 cross-species PI3K binding proteins from Drosophila-human reciprocal blasts[28]. Pathway enrichment analysis indicated that 133 differentially expressed genes were annotated to the PI3K/Akt pathway. Additionally, our results suggest that the mRNA expression of Akt1 and Akt2 was significantly changed after YB-1 knockdown (Figure 6D). Furthermore, the Akt signaling pathway correlates with YB-1[29], sorafenib treatment[30] and HCC[31]. Therefore, we planned to further investigate the potential relationship of YB-1 and the PI3K/Akt pathway in HCC cell lines treated with sorafenib.
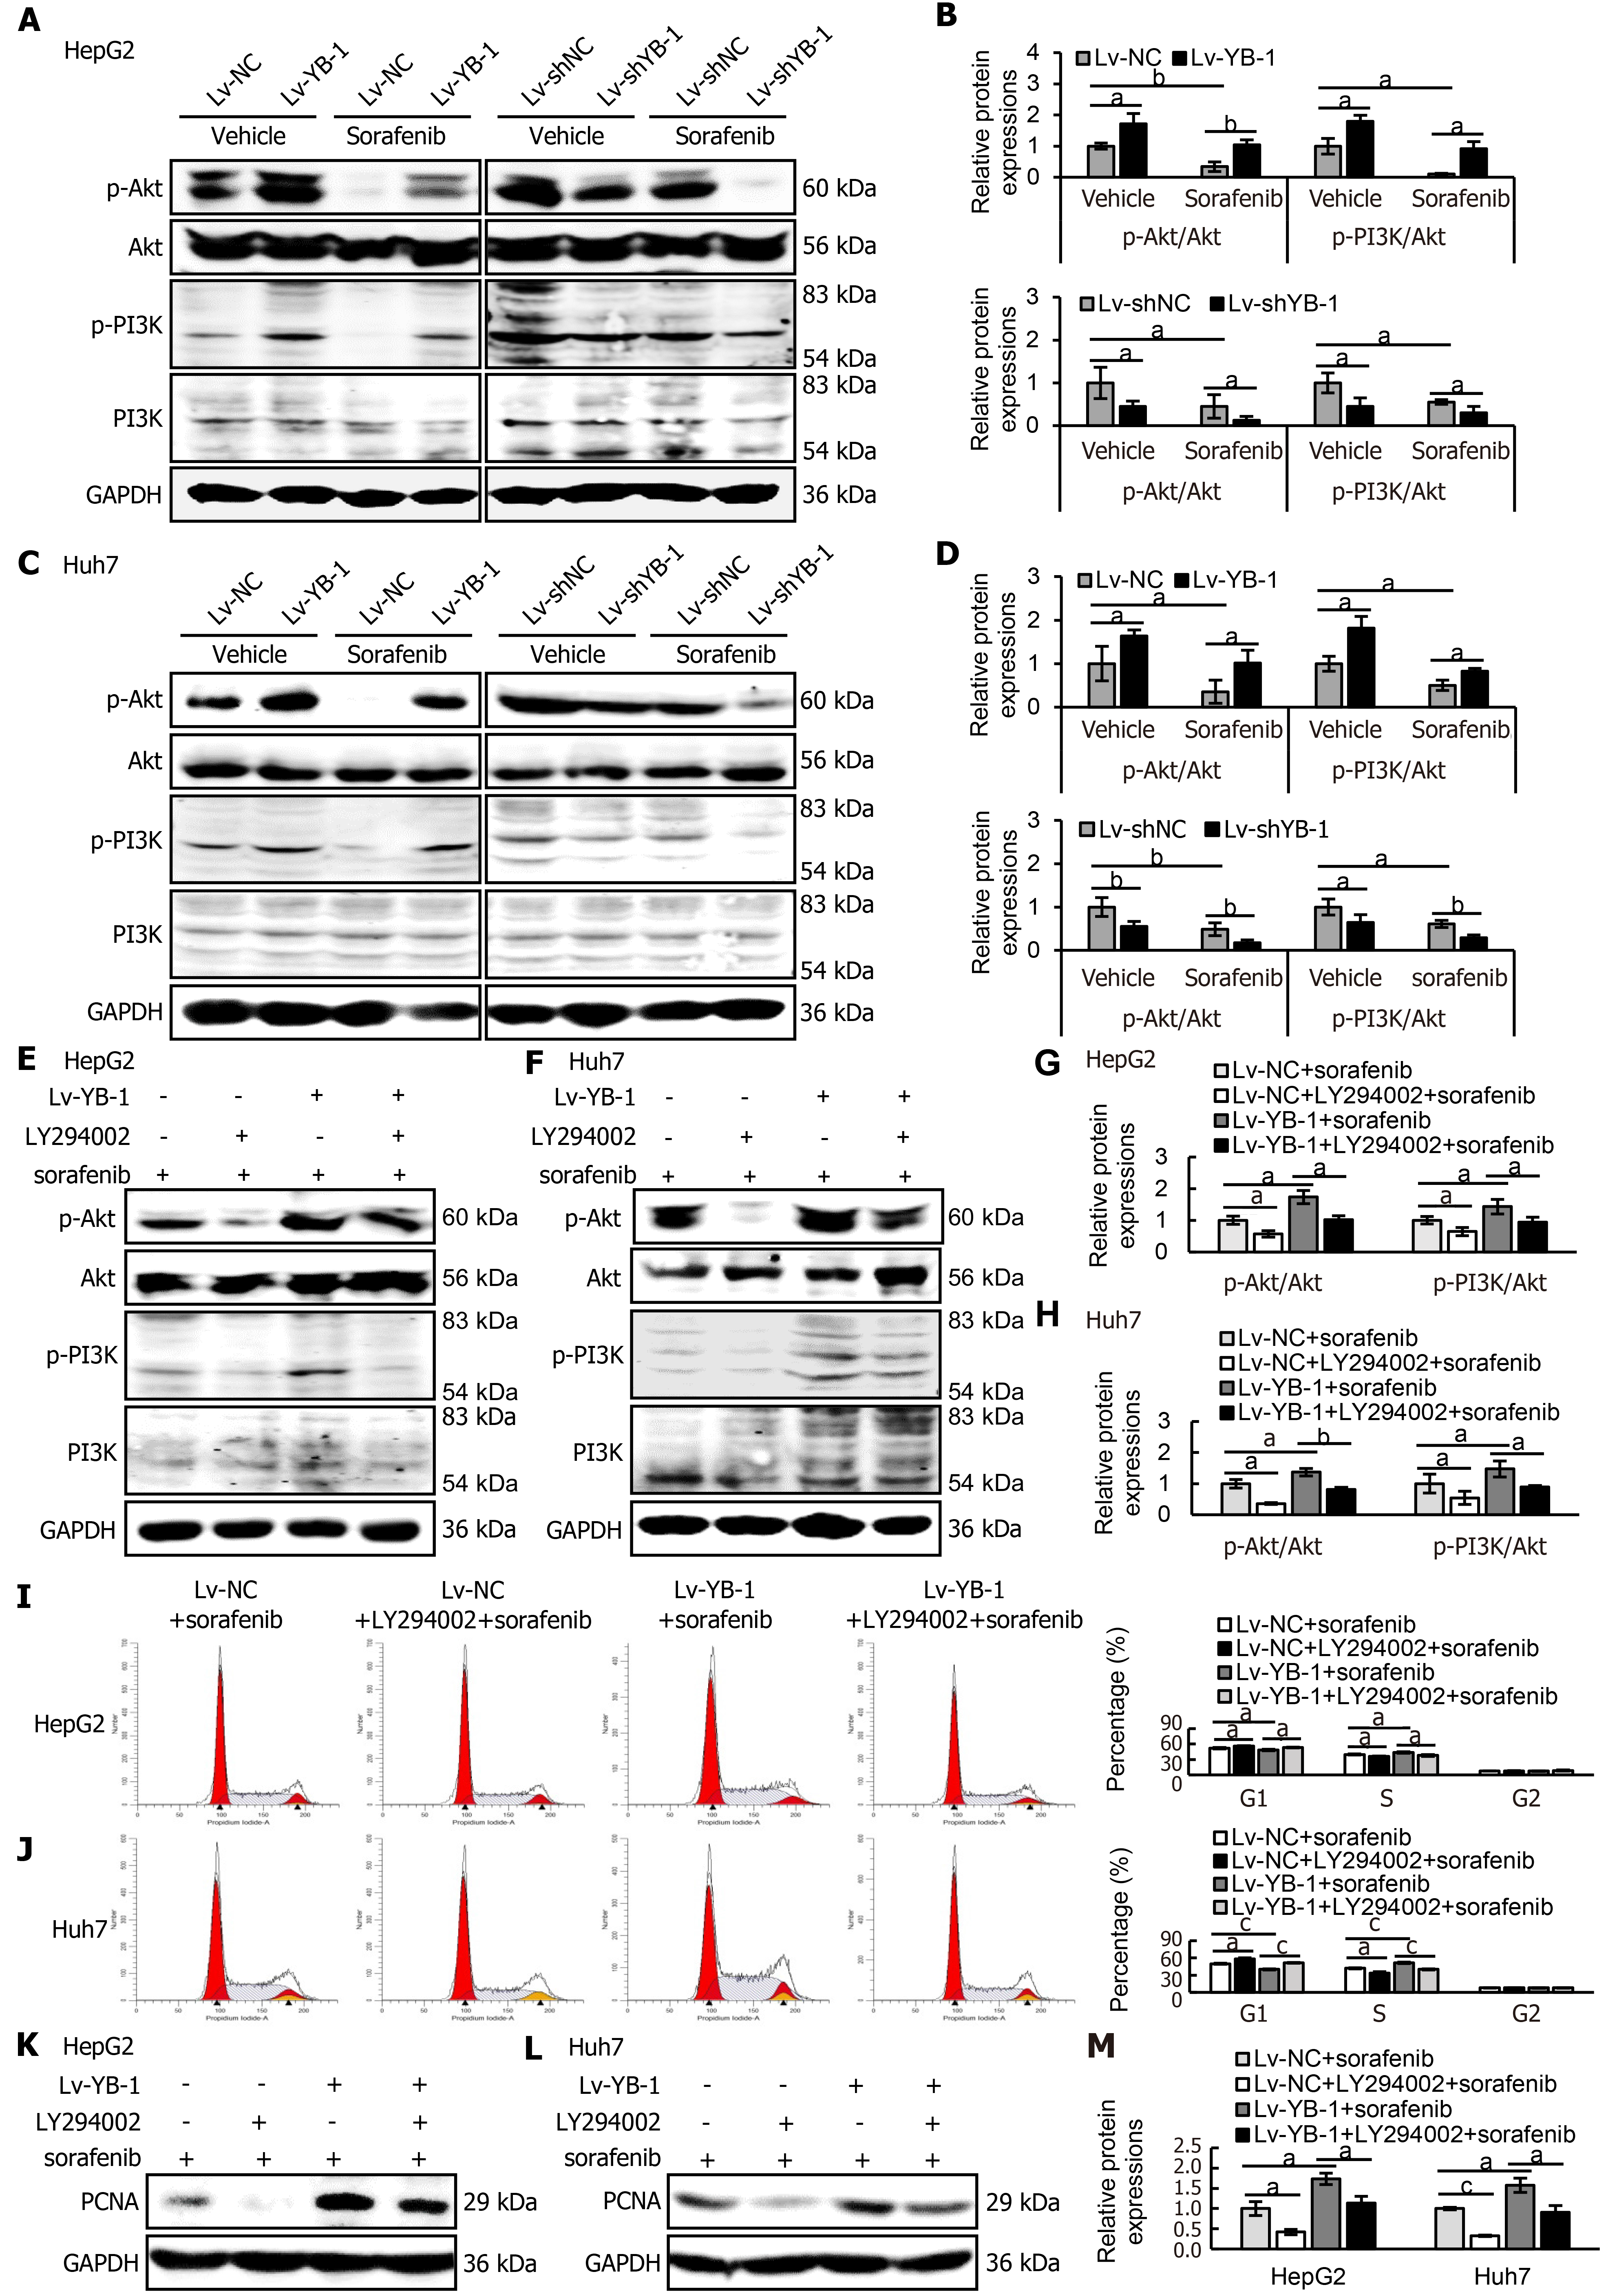
Western blot analysis was consequently applied to detect the expression levels of key proteins in the PI3K/Akt signaling pathway in HepG2 and Huh7 cells. The expression levels of p-Akt and p-PI3K were increased in YB-1-overexpressing cells, and sorafenib decreased the protein expression; however, the association of YB-1 overexpression and sorafenib treatment neutralized the expression of the two proteins (Figure 7A-D). Simultaneously, either single knockdown of YB-1 or treatment with sorafenib inhibited p-Akt and p-PI3K expression. Furthermore, the most significant suppression of protein expression was accomplished by the combination of YB-1 knockdown and sorafenib incubation (Figure 7A-D).
Next, we explored whether blockade of the PI3K/Akt pathway would avoid YB-1-induced sorafenib resistance in Lv-NC + sorafenib and Lv-YB-1 + sorafenib-treated HepG2 and Huh7 cells. The phosphorylation of PI3K and Akt was obviously attenuated after the suppression of PI3K/Akt signaling by LY294002 in Lv-NC and Lv-YB-1 cells incubated with sorafenib (Figure 7E-H). Moreover, LY294002 led to increased G1-phase and reduced S-phase cells, inhibited YB-1-induced decreased G1-phase and increased S-phase cells (Figure 7I and J), and decreased PCNA expression (Figure 7K-M). Simultaneously, the suppression of PI3K/Akt signaling by LY294002 increased apoptosis in Lv-NC and Lv-YB-1 cells with sorafenib incubation (Figure 8A-D) and elevated the protein levels of cleaved PARP (Figure 8E and F). Taken together, YB-1 induced sorafenib resistance by activating the PI3K/Akt signaling pathway.
Researchers have mainly focused on the relationship between YB-1 and tumor proliferation, apoptosis, invasion, metastasis and other biological behaviors[32-36]. To date, few studies have investigated the correlation between YB-1 and drug resistance. In addition to YB-1 activating MDR in various tumors[18], YB-1 also induces the development of chemotherapy resistance by regulating the expression of P-glycoprotein and focal adhesion kinase and the characteristics of stem cells in various tumors[37-39]. Additionally, indirubin 3'-oxime inhibits the nuclear translocation of YB-1, thereby reducing MDR1 expression and exerting efficacy in treating liver cancer[40]. Sorafenib, a new type of multitarget antitumor drug, is a first-line systemic treatment option for patients with advanced HCC[41]. It has dual antitumor effects: (1) it blocks the signaling pathway mediated by RAF/MEK/extracellular regulated protein kinases (ERK) and directly inhibits tumor cell proliferation; (2) it inhibits vascular EGFR and platelet-derived growth factor receptor and then suppresses angiogenesis, indirectly inhibiting tumor cell growth[41]. Studies on the resistance mechanism of sorafenib have found that EMT, activation of the Akt signaling pathway, tumor stem cells, and abnormal regulation of proliferation and apoptosis induce sorafenib resistance[42].
The effect of sorafenib, which promotes cell apoptosis and inhibits cell proliferation, has been proven in previous studies[30,43,44]. A study on sorafenib resistance observed that β-catenin and its downstream target genes were elevated in hepatoma cells after incubation with sorafenib, and β-catenin overexpression inhibited apoptosis and promoted cell proliferation, while β-catenin knockdown enhanced the effect of sorafenib on apoptosis and proliferation. Additionally, the IC50 values of sorafenib were heightened in liver cancer cells overexpressing β-catenin, confirming that β-catenin is closely related to sorafenib resistance. The relationship between YB-1 and sorafenib resistance in HCC was first clarified in our study. First, YB-1 in liver cancer tissues showed dramatically higher expression than that in the corresponding adjacent tissues. Next, we constructed lentiviruses that overexpress or knock down YB-1 expression in two human liver cancer cell lines (HepG2 and Huh7) and simultaneously stimulated cells with different concentrations of sorafenib; YB-1 significantly elevated the IC50 of HCC cells. We proved that the effect of sorafenib on apoptosis and proliferation was suppressed by YB-1 overexpression, while YB-1 knockdown had opposite effects. Uniformly, the association of YB-1 knockdown and sorafenib treatment had the most significant effect on the efficacy of sorafenib in vivo. These results indicate that YB-1 leads to sorafenib resistance in HCC[43,44].
Next, we conducted digital gene expression profile analysis in HepG2 cells (Lv-shNC + sorafenib, Lv-shYB-1 + sorafenib) with stable YB-1 knockdown and sorafenib treatment. Akt1 and Akt2 in the Lv-shYB-1 + sorafenib group were notably lower than those in the Lv-shNC + sorafenib group, and KEGG pathway enrichment analysis revealed a significant difference in the PI3K/Akt signaling pathway between the two groups. At the same time, we searched for proteins that interact with YB-1 using the BioGRID and HitPredict websites. Among proteins that interface with YB-1, we identified two proteins, Akt1[26,27] and PIK3R1[28], which are essential proteins of the PI3K/Akt signaling pathway.
The PI3K/Akt signaling pathway, a well-known survival mechanism of cancer, is tightly correlated with cancer occurrence and growth. Presently, studies on the PI3K/Akt signaling pathway has mostly focused on the proliferation, apoptosis, migration and invasion of tumor cells, such as gastric cancer[45], breast cancer[46], cervical squamous cell carcinoma[47] and osteosarcoma[48]. Additionally, YB-1 was reported to promote the tumorigenesis and progression of spinal chordoma by activating the EGFR/Akt signaling pathway[29]. At the same time, the PI3K/Akt pathway is also involved in chemotherapeutic drug resistance; for example, suppressing the expression of Akt sensitizes cells to sorafenib-induced apoptosis[49], and blocking the PI3K/Akt signaling pathway induces increased sensitivity of hepatocarcinoma cells to sorafenib[50-52]. Regarding acquired sorafenib resistance, the PI3K/Akt signaling pathway is considered a compensation mechanism, and multiple studies have revealed that the phosphorylation level of Akt in HCC cells with acquired sorafenib resistance is higher than that in its parental cells. Inhibition of Akt by GDC0068, MK-2206 or LY294002 reverses the occurrence of acquired sorafenib resistance[53-55]. Fortunately, we verified that YB-1 activates the PI3K/Akt signaling pathway and inhibits the inactivation of the PI3K/Akt signaling pathway induced by sorafenib treatment. Additionally, the blockade of PI3K/Akt signaling pathway by LY294002 inhibited YB-1-induced sorafenib resistance in HepG2 and Huh7 cells. Thus, YB-1 stimulates sorafenib resistance by targeting the PI3K/Akt signaling pathway in HCC.
In conclusion, the absence of YB-1 effectively suppresses the occurrence of sorafenib resistance and promotes the deactivation of the PI3K/Akt signaling pathway caused by sorafenib. Given that sorafenib is the first-line treatment for patients with advanced HCC, we propose that downregulation of YB-1 may be a novel potential approach to treat advanced HCC and improve the efficacy of sorafenib in treating advanced HCC.
Y-box binding protein 1 (YB-1) promotes the proliferation of tumor cells, inhibits apoptosis, and activates the expression of multidrug resistance genes in breast cancer, kidney cancer and other cancers. It can also promote the resistance of gefitinib in lung adenocarcinoma cells. The specific molecular mechanism of YB-1 mediating drug resistance in hepatocellular carcinoma (HCC) is still unclear.
The study will provide a basis for the application of YB-1 in sorafenib resistance of HCC.
To detect the expression of YB-1 in HCC tissues and cells, and explore the role and the potential mechanism of YB-1 in sorafenib resistance of HCC.
In this study, the authors examined the expression levels of YB-1 in cancer and corresponding paracancerous tissues of HCC patients, and clarified whether YB-1 was involved in sorafenib resistance in HCC by overexpressing and knocking down YB-1 in two kinds of hepatoma cell lines. Furthermore, a nude mouse liver cancer xenograft tumor model was established to verify the role of YB-1 in mediating sorafenib resistance in HCC in vivo. The signaling pathways involved in YB-1-mediated drug resistance in hepatocarcinoma cells were also screened and validated by digital expression profiling (DGE) technology.
YB-1 expression levels were significantly upregulated in both cancer tissues of HCC patients and human hepatoma cell lines. YB-1 could resist the effects of sorafenib on proliferation and apoptosis in hepatocarcinoma cells, which in turn mediated the resistance of HCC cells to sorafenib. YB-1 mediates sorafenib resistance in hepatocarcinoma cells through activating the phosphoinositide-3-kinase (PI3K)/protein kinase B (Akt) signaling pathway.
Knockdown of YB-1 can effectively inhibit the occurrence of sorafenib resistance, and can also enhance the inactivation of sorafenib on the PI3K/Akt signaling pathway. Therefore, YB-1 is a sorafenib resistance related gene.
Downregulation of YB-1 may be a new potential method for the treatment of advanced HCC, and it is expected to improve the efficacy of sorafenib in the treatment of advanced HCC patients.
Manuscript source: Unsolicited manuscript
Specialty type: Gastroenterology and hepatology
Country/Territory of origin: China
Peer-review report’s scientific quality classification
Grade A (Excellent): A
Grade B (Very good): 0
Grade C (Good): 0
Grade D (Fair): 0
Grade E (Poor): 0
P-Reviewer: Tartaglia N S-Editor: Ma YJ L-Editor: Filipodia P-Editor: Xing YX
| 1. | Zucman-Rossi J, Villanueva A, Nault JC, Llovet JM. Genetic Landscape and Biomarkers of Hepatocellular Carcinoma. Gastroenterology. 2015;149:1226-1239.e4. [RCA] [PubMed] [DOI] [Full Text] [Cited by in Crossref: 744] [Cited by in RCA: 951] [Article Influence: 95.1] [Reference Citation Analysis (0)] |
| 2. | Llovet JM, Zucman-Rossi J, Pikarsky E, Sangro B, Schwartz M, Sherman M, Gores G. Hepatocellular carcinoma. Nat Rev Dis Primers. 2016;2:16018. [RCA] [PubMed] [DOI] [Full Text] [Cited by in Crossref: 1933] [Cited by in RCA: 1873] [Article Influence: 208.1] [Reference Citation Analysis (4)] |
| 3. | Chen W, Zheng R, Baade PD, Zhang S, Zeng H, Bray F, Jemal A, Yu XQ, He J. Cancer statistics in China, 2015. CA Cancer J Clin. 2016;66:115-132. [RCA] [PubMed] [DOI] [Full Text] [Cited by in Crossref: 11444] [Cited by in RCA: 13213] [Article Influence: 1468.1] [Reference Citation Analysis (3)] |
| 4. | Choi J, Kim GA, Han S, Lee W, Chun S, Lim YS. Longitudinal Assessment of Three Serum Biomarkers to Detect Very Early-Stage Hepatocellular Carcinoma. Hepatology. 2019;69:1983-1994. [RCA] [PubMed] [DOI] [Full Text] [Cited by in Crossref: 84] [Cited by in RCA: 147] [Article Influence: 24.5] [Reference Citation Analysis (0)] |
| 5. | Cao C, Zhang T, Zhang D, Xie L, Zou X, Lei L, Wu D, Liu L. The long non-coding RNA, SNHG6-003, functions as a competing endogenous RNA to promote the progression of hepatocellular carcinoma. Oncogene. 2017;36:1112-1122. [RCA] [PubMed] [DOI] [Full Text] [Cited by in Crossref: 118] [Cited by in RCA: 146] [Article Influence: 16.2] [Reference Citation Analysis (0)] |
| 6. | Zhang DY, Zou XJ, Cao CH, Zhang T, Lei L, Qi XL, Liu L, Wu DH. Identification and Functional Characterization of Long Non-coding RNA MIR22HG as a Tumor Suppressor for Hepatocellular Carcinoma. Theranostics. 2018;8:3751-3765. [RCA] [PubMed] [DOI] [Full Text] [Full Text (PDF)] [Cited by in Crossref: 50] [Cited by in RCA: 79] [Article Influence: 11.3] [Reference Citation Analysis (0)] |
| 7. | Fekry B, Ribas-Latre A, Baumgartner C, Deans JR, Kwok C, Patel P, Fu L, Berdeaux R, Sun K, Kolonin MG, Wang SH, Yoo SH, Sladek FM, Eckel-Mahan K. Incompatibility of the circadian protein BMAL1 and HNF4α in hepatocellular carcinoma. Nat Commun. 2018;9:4349. [RCA] [PubMed] [DOI] [Full Text] [Full Text (PDF)] [Cited by in Crossref: 71] [Cited by in RCA: 81] [Article Influence: 11.6] [Reference Citation Analysis (0)] |
| 8. | Forner A, Reig M, Bruix J. Hepatocellular carcinoma. Lancet. 2018;391:1301-1314. [RCA] [PubMed] [DOI] [Full Text] [Cited by in Crossref: 2800] [Cited by in RCA: 4105] [Article Influence: 586.4] [Reference Citation Analysis (6)] |
| 9. | Azzariti A, Mancarella S, Porcelli L, Quatrale AE, Caligiuri A, Lupo L, Dituri F, Giannelli G. Hepatic stellate cells induce hepatocellular carcinoma cell resistance to sorafenib through the laminin-332/α3 integrin axis recovery of focal adhesion kinase ubiquitination. Hepatology. 2016;64:2103-2117. [RCA] [PubMed] [DOI] [Full Text] [Cited by in Crossref: 63] [Cited by in RCA: 89] [Article Influence: 9.9] [Reference Citation Analysis (0)] |
| 10. | Llovet JM, Ricci S, Mazzaferro V, Hilgard P, Gane E, Blanc JF, de Oliveira AC, Santoro A, Raoul JL, Forner A, Schwartz M, Porta C, Zeuzem S, Bolondi L, Greten TF, Galle PR, Seitz JF, Borbath I, Häussinger D, Giannaris T, Shan M, Moscovici M, Voliotis D, Bruix J; SHARP Investigators Study Group. Sorafenib in advanced hepatocellular carcinoma. N Engl J Med. 2008;359:378-390. [RCA] [PubMed] [DOI] [Full Text] [Cited by in Crossref: 9016] [Cited by in RCA: 10268] [Article Influence: 604.0] [Reference Citation Analysis (2)] |
| 11. | Fuchs BC, Hoshida Y, Fujii T, Wei L, Yamada S, Lauwers GY, McGinn CM, DePeralta DK, Chen X, Kuroda T, Lanuti M, Schmitt AD, Gupta S, Crenshaw A, Onofrio R, Taylor B, Winckler W, Bardeesy N, Caravan P, Golub TR, Tanabe KK. Epidermal growth factor receptor inhibition attenuates liver fibrosis and development of hepatocellular carcinoma. Hepatology. 2014;59:1577-1590. [RCA] [PubMed] [DOI] [Full Text] [Cited by in Crossref: 232] [Cited by in RCA: 285] [Article Influence: 25.9] [Reference Citation Analysis (0)] |
| 12. | Lyabin DN, Eliseeva IA, Ovchinnikov LP. YB-1 protein: functions and regulation. Wiley Interdiscip Rev RNA. 2014;5:95-110. [RCA] [PubMed] [DOI] [Full Text] [Cited by in Crossref: 181] [Cited by in RCA: 276] [Article Influence: 23.0] [Reference Citation Analysis (0)] |
| 13. | Chao HM, Huang HX, Chang PH, Tseng KC, Miyajima A, Chern E. Y-box binding protein-1 promotes hepatocellular carcinoma-initiating cell progression and tumorigenesis via Wnt/β-catenin pathway. Oncotarget. 2017;8:2604-2616. [RCA] [PubMed] [DOI] [Full Text] [Full Text (PDF)] [Cited by in Crossref: 31] [Cited by in RCA: 48] [Article Influence: 6.9] [Reference Citation Analysis (0)] |
| 14. | Berquin IM, Pang B, Dziubinski ML, Scott LM, Chen YQ, Nolan GP, Ethier SP. Y-box-binding protein 1 confers EGF independence to human mammary epithelial cells. Oncogene. 2005;24:3177-3186. [RCA] [PubMed] [DOI] [Full Text] [Cited by in Crossref: 46] [Cited by in RCA: 55] [Article Influence: 2.8] [Reference Citation Analysis (0)] |
| 15. | Lasham A, Lindridge E, Rudert F, Onrust R, Watson J. Regulation of the human fas promoter by YB-1, Puralpha and AP-1 transcription factors. Gene. 2000;252:1-13. [RCA] [PubMed] [DOI] [Full Text] [Cited by in Crossref: 98] [Cited by in RCA: 106] [Article Influence: 4.2] [Reference Citation Analysis (0)] |
| 16. | Guay D, Gaudreault I, Massip L, Lebel M. Formation of a nuclear complex containing the p53 tumor suppressor, YB-1, and the Werner syndrome gene product in cells treated with UV light. Int J Biochem Cell Biol. 2006;38:1300-1313. [RCA] [PubMed] [DOI] [Full Text] [Cited by in Crossref: 17] [Cited by in RCA: 20] [Article Influence: 1.1] [Reference Citation Analysis (0)] |
| 17. | Okamoto T, Izumi H, Imamura T, Takano H, Ise T, Uchiumi T, Kuwano M, Kohno K. Direct interaction of p53 with the Y-box binding protein, YB-1: a mechanism for regulation of human gene expression. Oncogene. 2000;19:6194-6202. [RCA] [PubMed] [DOI] [Full Text] [Cited by in Crossref: 113] [Cited by in RCA: 127] [Article Influence: 5.1] [Reference Citation Analysis (0)] |
| 18. | Kuwano M, Uchiumi T, Hayakawa H, Ono M, Wada M, Izumi H, Kohno K. The basic and clinical implications of ABC transporters, Y-box-binding protein-1 (YB-1) and angiogenesis-related factors in human malignancies. Cancer Sci. 2003;94:9-14. [RCA] [PubMed] [DOI] [Full Text] [Cited by in Crossref: 80] [Cited by in RCA: 84] [Article Influence: 3.8] [Reference Citation Analysis (0)] |
| 19. | Lou L, Wang J, Lv F, Wang G, Li Y, Xing L, Shen H, Zhang X. Y-box binding protein 1 (YB-1) promotes gefitinib resistance in lung adenocarcinoma cells by activating AKT signaling and epithelial-mesenchymal transition through targeting major vault protein (MVP). Cell Oncol (Dordr). 2021;44:109-133. [RCA] [PubMed] [DOI] [Full Text] [Cited by in Crossref: 4] [Cited by in RCA: 13] [Article Influence: 2.6] [Reference Citation Analysis (0)] |
| 20. | El-Naggar AM, Veinotte CJ, Cheng H, Grunewald TG, Negri GL, Somasekharan SP, Corkery DP, Tirode F, Mathers J, Khan D, Kyle AH, Baker JH, LePard NE, McKinney S, Hajee S, Bosiljcic M, Leprivier G, Tognon CE, Minchinton AI, Bennewith KL, Delattre O, Wang Y, Dellaire G, Berman JN, Sorensen PH. Translational Activation of HIF1α by YB-1 Promotes Sarcoma Metastasis. Cancer Cell. 2015;27:682-697. [RCA] [PubMed] [DOI] [Full Text] [Cited by in Crossref: 180] [Cited by in RCA: 220] [Article Influence: 22.0] [Reference Citation Analysis (0)] |
| 21. | of a Bridge to a Consensus on Hepatocellular Carcinoma Management. The 2nd Asia Pacific Primary Liver Cancer Expert Meeting. July 1-3, 2011, Osaka, Japan. Oncology. 2011;81 Suppl 1:1-164. [PubMed] |
| 22. | Wang J, Zhao J, Chu ES, Mok MT, Go MY, Man K, Heuchel R, Lan HY, Chang Z, Sung JJ, Yu J. Inhibitory role of Smad7 in hepatocarcinogenesis in mice and in vitro. J Pathol. 2013;230:441-452. [RCA] [PubMed] [DOI] [Full Text] [Cited by in Crossref: 33] [Cited by in RCA: 36] [Article Influence: 3.0] [Reference Citation Analysis (0)] |
| 23. | Oshlack A, Robinson MD, Young MD. From RNA-seq reads to differential expression results. Genome Biol. 2010;11:220. [RCA] [PubMed] [DOI] [Full Text] [Full Text (PDF)] [Cited by in Crossref: 488] [Cited by in RCA: 479] [Article Influence: 31.9] [Reference Citation Analysis (0)] |
| 24. | Ding X, Zhu L, Ji T, Zhang X, Wang F, Gan S, Zhao M, Yang H. Long intergenic non-coding RNAs (LincRNAs) identified by RNA-seq in breast cancer. PLoS One. 2014;9:e103270. [RCA] [PubMed] [DOI] [Full Text] [Full Text (PDF)] [Cited by in Crossref: 41] [Cited by in RCA: 43] [Article Influence: 3.9] [Reference Citation Analysis (0)] |
| 25. | Dembélé D, Kastner P. Fold change rank ordering statistics: a new method for detecting differentially expressed genes. BMC Bioinformatics. 2014;15:14. [RCA] [PubMed] [DOI] [Full Text] [Full Text (PDF)] [Cited by in Crossref: 87] [Cited by in RCA: 85] [Article Influence: 7.7] [Reference Citation Analysis (0)] |
| 26. | Sutherland BW, Kucab J, Wu J, Lee C, Cheang MC, Yorida E, Turbin D, Dedhar S, Nelson C, Pollak M, Leighton Grimes H, Miller K, Badve S, Huntsman D, Blake-Gilks C, Chen M, Pallen CJ, Dunn SE. Akt phosphorylates the Y-box binding protein 1 at Ser102 Located in the cold shock domain and affects the anchorage-independent growth of breast cancer cells. Oncogene. 2005;24:4281-4292. [RCA] [PubMed] [DOI] [Full Text] [Cited by in Crossref: 212] [Cited by in RCA: 244] [Article Influence: 12.2] [Reference Citation Analysis (0)] |
| 27. | Evdokimova V, Ruzanov P, Anglesio MS, Sorokin AV, Ovchinnikov LP, Buckley J, Triche TJ, Sonenberg N, Sorensen PH. Akt-mediated YB-1 phosphorylation activates translation of silent mRNA species. Mol Cell Biol. 2006;26:277-292. [RCA] [PubMed] [DOI] [Full Text] [Cited by in Crossref: 196] [Cited by in RCA: 218] [Article Influence: 11.5] [Reference Citation Analysis (0)] |
| 28. | Breitkopf SB, Yang X, Begley MJ, Kulkarni M, Chiu YH, Turke AB, Lauriol J, Yuan M, Qi J, Engelman JA, Hong P, Kontaridis MI, Cantley LC, Perrimon N, Asara JM. A Cross-Species Study of PI3K Protein-Protein Interactions Reveals the Direct Interaction of P85 and SHP2. Sci Rep. 2016;6:20471. [RCA] [PubMed] [DOI] [Full Text] [Full Text (PDF)] [Cited by in Crossref: 28] [Cited by in RCA: 34] [Article Influence: 3.8] [Reference Citation Analysis (0)] |
| 29. | Liang C, Ma Y, Yong L, Yang C, Wang P, Liu X, Zhu B, Zhou H, Liu Z. Y-box binding protein-1 promotes tumorigenesis and progression via the epidermal growth factor receptor/AKT pathway in spinal chordoma. Cancer Sci. 2019;110:166-179. [RCA] [PubMed] [DOI] [Full Text] [Full Text (PDF)] [Cited by in Crossref: 16] [Cited by in RCA: 24] [Article Influence: 3.4] [Reference Citation Analysis (0)] |
| 30. | Hao H, Zhang D, Shi J, Wang Y, Chen L, Guo Y, Ma J, Jiang X, Jiang H. Sorafenib induces autophagic cell death and apoptosis in hepatic stellate cell through the JNK and Akt signaling pathways. Anticancer Drugs. 2016;27:192-203. [RCA] [PubMed] [DOI] [Full Text] [Cited by in Crossref: 28] [Cited by in RCA: 36] [Article Influence: 4.0] [Reference Citation Analysis (0)] |
| 31. | Wang X, Wang X, Xu Y, Yan M, Li W, Chen J, Chen T. Effect of nicastrin on hepatocellular carcinoma proliferation and apoptosis through PI3K/AKT signalling pathway modulation. Cancer Cell Int. 2020;20:91. [RCA] [PubMed] [DOI] [Full Text] [Full Text (PDF)] [Cited by in Crossref: 7] [Cited by in RCA: 8] [Article Influence: 1.6] [Reference Citation Analysis (0)] |
| 32. | Zhou LL, Ni J, Feng WT, Yao R, Yue S, Zhu YN, Tang HY, Lv LY, Feng JF, Zhu WG. High YBX1 expression indicates poor prognosis and promotes cell migration and invasion in nasopharyngeal carcinoma. Exp Cell Res. 2017;361:126-134. [RCA] [PubMed] [DOI] [Full Text] [Cited by in Crossref: 23] [Cited by in RCA: 28] [Article Influence: 3.5] [Reference Citation Analysis (0)] |
| 33. | Pang T, Li M, Zhang Y, Yong W, Kang H, Yao Y, Hu X. Y Box-Binding Protein 1 Promotes Epithelial-Mesenchymal Transition, Invasion, and Metastasis of Cervical Cancer via Enhancing the Expressions of Snail. Int J Gynecol Cancer. 2017;27:1753-1760. [RCA] [PubMed] [DOI] [Full Text] [Cited by in Crossref: 10] [Cited by in RCA: 9] [Article Influence: 1.1] [Reference Citation Analysis (0)] |
| 34. | Harada M, Kotake Y, Ohhata T, Kitagawa K, Niida H, Matsuura S, Funai K, Sugimura H, Suda T, Kitagawa M. YB-1 promotes transcription of cyclin D1 in human non-small-cell lung cancers. Genes Cells. 2014;19:504-516. [RCA] [PubMed] [DOI] [Full Text] [Cited by in Crossref: 46] [Cited by in RCA: 44] [Article Influence: 4.0] [Reference Citation Analysis (0)] |
| 35. | Feng T, Dzieran J, Gu X, Marhenke S, Vogel A, Machida K, Weiss TS, Ruemmele P, Kollmar O, Hoffmann P, Grässer F, Allgayer H, Fabian J, Weng HL, Teufel A, Maass T, Meyer C, Lehmann U, Zhu C, Mertens PR, Gao CF, Dooley S, Meindl-Beinker NM. Smad7 regulates compensatory hepatocyte proliferation in damaged mouse liver and positively relates to better clinical outcome in human hepatocellular carcinoma. Clin Sci (Lond). 2015;128:761-774. [RCA] [PubMed] [DOI] [Full Text] [Cited by in Crossref: 20] [Cited by in RCA: 24] [Article Influence: 2.4] [Reference Citation Analysis (0)] |
| 36. | Yasen M, Kajino K, Kano S, Tobita H, Yamamoto J, Uchiumi T, Kon S, Maeda M, Obulhasim G, Arii S, Hino O. The up-regulation of Y-box binding proteins (DNA binding protein A and Y-box binding protein-1) as prognostic markers of hepatocellular carcinoma. Clin Cancer Res. 2005;11:7354-7361. [RCA] [PubMed] [DOI] [Full Text] [Cited by in Crossref: 60] [Cited by in RCA: 69] [Article Influence: 3.6] [Reference Citation Analysis (0)] |
| 37. | Oda Y, Ohishi Y, Basaki Y, Kobayashi H, Hirakawa T, Wake N, Ono M, Nishio K, Kuwano M, Tsuneyoshi M. Prognostic implications of the nuclear localization of Y-box-binding protein-1 and CXCR4 expression in ovarian cancer: their correlation with activated Akt, LRP/MVP and P-glycoprotein expression. Cancer Sci. 2007;98:1020-1026. [RCA] [PubMed] [DOI] [Full Text] [Cited by in Crossref: 50] [Cited by in RCA: 49] [Article Influence: 2.7] [Reference Citation Analysis (0)] |
| 38. | Bargou RC, Jürchott K, Wagener C, Bergmann S, Metzner S, Bommert K, Mapara MY, Winzer KJ, Dietel M, Dörken B, Royer HD. Nuclear localization and increased levels of transcription factor YB-1 in primary human breast cancers are associated with intrinsic MDR1 gene expression. Nat Med. 1997;3:447-450. [RCA] [PubMed] [DOI] [Full Text] [Cited by in Crossref: 307] [Cited by in RCA: 324] [Article Influence: 11.6] [Reference Citation Analysis (0)] |
| 39. | Triscott J, Rose Pambid M, Dunn SE. Concise review: bullseye: targeting cancer stem cells to improve the treatment of gliomas by repurposing disulfiram. Stem Cells. 2015;33:1042-1046. [RCA] [PubMed] [DOI] [Full Text] [Cited by in Crossref: 54] [Cited by in RCA: 65] [Article Influence: 7.2] [Reference Citation Analysis (0)] |
| 40. | Tanaka T, Ohashi S, Saito H, Wada T, Aoyama T, Ichimaru Y, Miyairi S, Kobayashi S. Indirubin 3'-oxime inhibits anticancer agent-induced YB-1 nuclear translocation in HepG2 human hepatocellular carcinoma cells. Biochem Biophys Res Commun. 2018;496:7-11. [RCA] [PubMed] [DOI] [Full Text] [Cited by in Crossref: 11] [Cited by in RCA: 11] [Article Influence: 1.4] [Reference Citation Analysis (0)] |
| 41. | Zhu YJ, Zheng B, Wang HY, Chen L. New knowledge of the mechanisms of sorafenib resistance in liver cancer. Acta Pharmacol Sin. 2017;38:614-622. [RCA] [PubMed] [DOI] [Full Text] [Cited by in Crossref: 403] [Cited by in RCA: 514] [Article Influence: 64.3] [Reference Citation Analysis (0)] |
| 42. | Niu L, Liu L, Yang S, Ren J, Lai PBS, Chen GG. New insights into sorafenib resistance in hepatocellular carcinoma: Responsible mechanisms and promising strategies. Biochim Biophys Acta Rev Cancer. 2017;1868:564-570. [RCA] [PubMed] [DOI] [Full Text] [Cited by in Crossref: 100] [Cited by in RCA: 153] [Article Influence: 19.1] [Reference Citation Analysis (0)] |
| 43. | Deng L, Sun J, Chen X, Liu L, Wu D. Nek2 augments sorafenib resistance by regulating the ubiquitination and localization of β-catenin in hepatocellular carcinoma. J Exp Clin Cancer Res. 2019;38:316. [RCA] [PubMed] [DOI] [Full Text] [Full Text (PDF)] [Cited by in Crossref: 27] [Cited by in RCA: 44] [Article Influence: 7.3] [Reference Citation Analysis (0)] |
| 44. | Lo J, Lau EY, Ching RH, Cheng BY, Ma MK, Ng IO, Lee TK. Nuclear factor kappa B-mediated CD47 up-regulation promotes sorafenib resistance and its blockade synergizes the effect of sorafenib in hepatocellular carcinoma in mice. Hepatology. 2015;62:534-545. [RCA] [PubMed] [DOI] [Full Text] [Cited by in Crossref: 117] [Cited by in RCA: 154] [Article Influence: 15.4] [Reference Citation Analysis (0)] |
| 45. | Ma F, An K, Li Y. Silencing of Long Non-Coding RNA-HCG18 Inhibits the Tumorigenesis of Gastric Cancer Through Blocking PI3K/Akt Pathway. Onco Targets Ther. 2020;13:2225-2234. [RCA] [PubMed] [DOI] [Full Text] [Full Text (PDF)] [Cited by in Crossref: 18] [Cited by in RCA: 19] [Article Influence: 3.8] [Reference Citation Analysis (0)] |
| 46. | Zhuang S, Li L, Zang Y, Li G, Wang F. RRM2 elicits the metastatic potential of breast cancer cells by regulating cell invasion, migration and VEGF expression via the PI3K/AKT signaling. Oncol Lett. 2020;19:3349-3355. [RCA] [PubMed] [DOI] [Full Text] [Cited by in Crossref: 7] [Cited by in RCA: 17] [Article Influence: 3.4] [Reference Citation Analysis (0)] |
| 47. | Li R, Song Y, Zhou L, Li W, Zhu X. Downregulation of RAGE Inhibits Cell Proliferation and Induces Apoptosis via Regulation of PI3K/AKT Pathway in Cervical Squamous Cell Carcinoma. Onco Targets Ther. 2020;13:2385-2397. [RCA] [PubMed] [DOI] [Full Text] [Full Text (PDF)] [Cited by in Crossref: 19] [Cited by in RCA: 20] [Article Influence: 4.0] [Reference Citation Analysis (0)] |
| 48. | Huang F, Zhou P, Wang Z, Zhang XL, Liao FX, Hu Y, Chang J. Knockdown of TBRG4 suppresses proliferation, invasion and promotes apoptosis of osteosarcoma cells by downregulating TGF-β1 expression and PI3K/AKT signaling pathway. Arch Biochem Biophys. 2020;686:108351. [RCA] [PubMed] [DOI] [Full Text] [Cited by in Crossref: 8] [Cited by in RCA: 11] [Article Influence: 2.2] [Reference Citation Analysis (0)] |
| 49. | Morgensztern D, McLeod HL. PI3K/Akt/mTOR pathway as a target for cancer therapy. Anticancer Drugs. 2005;16:797-803. [RCA] [PubMed] [DOI] [Full Text] [Cited by in Crossref: 326] [Cited by in RCA: 366] [Article Influence: 18.3] [Reference Citation Analysis (0)] |
| 50. | Gedaly R, Angulo P, Hundley J, Daily MF, Chen C, Koch A, Evers BM. PI-103 and sorafenib inhibit hepatocellular carcinoma cell proliferation by blocking Ras/Raf/MAPK and PI3K/AKT/mTOR pathways. Anticancer Res. 2010;30:4951-4958. [PubMed] |
| 51. | Tan W, Zhu S, Cao J, Zhang L, Li W, Liu K, Zhong J, Shang C, Chen Y. Inhibition of MMP-2 Expression Enhances the Antitumor Effect of Sorafenib in Hepatocellular Carcinoma by Suppressing the PI3K/AKT/mTOR Pathway. Oncol Res. 2017;25:1543-1553. [RCA] [PubMed] [DOI] [Full Text] [Full Text (PDF)] [Cited by in Crossref: 18] [Cited by in RCA: 22] [Article Influence: 2.8] [Reference Citation Analysis (0)] |
| 52. | Zhang L, Ge C, Zhao F, Zhang Y, Wang X, Yao M, Li J. NRBP2 Overexpression Increases the Chemosensitivity of Hepatocellular Carcinoma Cells via Akt Signaling. Cancer Res. 2016;76:7059-7071. [RCA] [PubMed] [DOI] [Full Text] [Cited by in Crossref: 29] [Cited by in RCA: 37] [Article Influence: 4.1] [Reference Citation Analysis (0)] |
| 53. | Chen KF, Chen HL, Tai WT, Feng WC, Hsu CH, Chen PJ, Cheng AL. Activation of phosphatidylinositol 3-kinase/Akt signaling pathway mediates acquired resistance to sorafenib in hepatocellular carcinoma cells. J Pharmacol Exp Ther. 2011;337:155-161. [RCA] [PubMed] [DOI] [Full Text] [Cited by in Crossref: 247] [Cited by in RCA: 256] [Article Influence: 18.3] [Reference Citation Analysis (1)] |
| 54. | Wu CH, Wu X, Zhang HW. Inhibition of acquired-resistance hepatocellular carcinoma cell growth by combining sorafenib with phosphoinositide 3-kinase and rat sarcoma inhibitor. J Surg Res. 2016;206:371-379. [RCA] [PubMed] [DOI] [Full Text] [Cited by in Crossref: 12] [Cited by in RCA: 13] [Article Influence: 1.4] [Reference Citation Analysis (0)] |
| 55. | Zhai B, Hu F, Jiang X, Xu J, Zhao D, Liu B, Pan S, Dong X, Tan G, Wei Z, Qiao H, Jiang H, Sun X. Inhibition of Akt reverses the acquired resistance to sorafenib by switching protective autophagy to autophagic cell death in hepatocellular carcinoma. Mol Cancer Ther. 2014;13:1589-1598. [RCA] [PubMed] [DOI] [Full Text] [Cited by in Crossref: 222] [Cited by in RCA: 233] [Article Influence: 21.2] [Reference Citation Analysis (0)] |


