Published online Sep 28, 2019. doi: 10.3748/wjg.v25.i36.5434
Peer-review started: April 26, 2019
First decision: May 24, 2019
Revised: August 7, 2019
Accepted: August 19, 2019
Article in press: August 19, 2019
Published online: September 28, 2019
Processing time: 155 Days and 23.4 Hours
High mobility group box-1 (HMGB1), recognized as a representative of damage-associated molecular patterns, is released during cell injury/death, triggering the inflammatory response and ultimately resulting in tissue damage. Dozens of studies have shown that HMGB1 is involved in certain diseases, but the details on how injured hepatocytes release HMGB1 need to be elicited.
To reveal HMGB1 release mechanism in hepatocytes undergoing oxidative stress.
C57BL6/J male mice were fed a high-fat diet for 12 wk plus a single binge of ethanol to induce severe steatohepatitis. Hepatocytes treated with H2O2 were used to establish an in vitro model. Serum alanine aminotransferase, liver H2O2 content and catalase activity, lactate dehydrogenase and 8-hydroxy-2-deoxyguanosine content, nicotinamide adenine dinucleotide (NAD+) levels, and Sirtuin 1 (Sirt1) activity were detected by spectrophotometry. HMGB1 release was measured by enzyme linked immunosorbent assay. HMGB1 translocation was observed by immunohistochemistry/immunofluorescence or Western blot. Relative mRNA levels were assayed by qPCR and protein expression was detected by Western blot. Acetylated HMGB1 and poly(ADP-ribose)polymerase 1 (Parp1) were analyzed by Immunoprecipitation.
When hepatocytes were damaged, HMGB1 translocated from the nucleus to the cytoplasm because of its hyperacetylation and was passively released outside both in vivo and in vitro. After treatment with Sirt1-siRNA or Sirt1 inhibitor (EX527), the hyperacetylated HMGB1 in hepatocytes increased, and Sirt1 activity inhibited by H2O2 could be reversed by Parp1 inhibitor (DIQ). Parp1 and Sirt1 are two NAD+-dependent enzymes which play major roles in the decision of a cell to live or die in the context of stress . We showed that NAD+ depletion attributed to Parp1 activation after DNA damage was caused by oxidative stress in hepatocytes and resulted in Sirt1 activity inhibition. On the contrary, Sirt1 suppressed Parp1 by negatively regulating its gene expression and deacetylation.
The functional inhibition between Parp1 and Sirt1 leads to HMGB1 hyperacetylation, which leads to its translocation from the nucleus to the cytoplasm and finally outside the cell.
Core tip: High mobility group box 1 (HMGB1) is a nuclear protein that non-specifically binds to the minor grooves in DNA. Once released passively by necrotic and damaged cells, HMGB1 will become a damage-associated molecular pattern molecule triggering the inflammatory response and ultimately results in tissue damage. In the present study, we found that HMGB1 is released from H2O2-injured hepatocytes due to Sirt1 functional inhibition.
- Citation: Ye TJ, Lu YL, Yan XF, Hu XD, Wang XL. High mobility group box-1 release from H2O2-injured hepatocytes due to sirt1 functional inhibition. World J Gastroenterol 2019; 25(36): 5434-5450
- URL: https://www.wjgnet.com/1007-9327/full/v25/i36/5434.htm
- DOI: https://dx.doi.org/10.3748/wjg.v25.i36.5434
High mobility group box 1 (HMGB1), a member of a subfamily of the HMG proteins, non-specifically binds to the minor grooves in DNA[1], and is released passively by necrotic and damaged cells upon various stimulation[2]. Once released in the extracellular space, HMGB1 acts as a damage-associated molecular pattern molecule, triggering the inflammatory response and ultimately results in tissue damage. Therefore, HMGB1 released by injured cells is a key driver of disease progression in both acute and chronic diseases[3,4]. During the past decade, studies in both patients and animal models have established that HMGB1 represents a potential biomarker and novel therapeutic target suggesting that blocking HMGB1 release is a potential therapeutic strategy for certain diseases.
The nuclear localization of HMGB1 and its affinity for DNA are regulated through phosphorylation and acetylation, and have been found to have a dynamic relationship with chromatin. When HMGB1 is not acetylated, it is located in the nucleus and is not secreted or released outside the cell, reducing its inflammatory effects as seen during cellular injury/death[5]. HMGB1 is a novel deacetylation target of nicotinamide adenine dinucleotide (NAD+)-dependent deacetylase Sirtuin1 (Sirt1)[6], which is grouped as a class III histone deacetylase, and is a predominantly nuclear protein which can shuttle to the cytoplasm under conditions of cell stress. Sirt1 and poly ADP-ribose polymerase 1 (Parp1) are two enzymes functionally connected due to their common use of an NAD+ substrate[7] and functional interplay in regulating lipopolysaccharide-mediated HMGB1 secretion[8].
Chromatin relaxation at DNA lesions is one of the earliest cellular responses to DNA damage and is regulated by Parp1 enzymatic activity[9]. Under oxidative stress caused by H2O2, Parp1 is generated at high levels leading to hepatic cell damage and death in CCl4-induced liver injury[10]. Additionally, there was significantly greater DNA damage and excessive Parp1 activation, exhausting NAD+ stores in hepatocyte-specific HMGB1 knockout mice (HMGB1-HC-KO)[11]. On the other hand, Sirt1 plays a critical role in preventing DNA damage caused by H2O2 in human embryonic stem cells and regulates stress responses, genomic stability, and cell survival[12]. H2O2 also evokes injury of cardiomyocytes by upregulating HMGB1[13]. However, the relationship among Parp1, -Sirt1, cell death,and HMGB1 release still needs to be elucidated.
In the present study, we hypothesized that HMGB1 release by H2O2-injured hepatocytes is regulated by DNA-damage-mediated Parp1 activation, which causes NAD+ over-depletion followed by Sirt1 activity suppression, leading to HMGB1 hyperacetylation and finally release. Our findings demonstrated that DNA damage triggers the cascade reaction of Parp1–Sirt1–HMGB1 hyperacetylation and finally HMGB1 release from hepatocytes. The results support our hypothesis and identify HMGB1 as an important biomarker for liver injury induced with a high-fat diet/ethyl alcohol (HFD/etOH).
Twenty-four male C57BL/6J mice, weighing 23 ± 2 g, were obtained from the Shanghai Institute of Materia Medica [license number: SCXK (Shanghai) 2012-0002]. The experimental protocol was approved by the Animal Ethics Committee of Shanghai University of Traditional Chinese Medicine, and the study was performed in accordance with the approved guidelines. The animals were randomly divided into two groups: Control and HFD plus etOH. The HFD group was fed an HFD (Research Diets, United States, D12492), while the control group was given a control diet (Research Diets, United States, D12451). After 12 wk of treatment, on the last day, mice fed an HFD were given 31.25% ethanol solution in water at a single dose of 5 g/kg body weight by oral gavage, while the mice in the control group were given saline. After 9 h, all mice were sacrificed, and the samples were collected for subsequent experiments.
Serum ALT activity was detected using a commercial kits according to the manufacturer’s instructions (Nanjing Jiancheng Biology Co., Ltd, China). The liver tissues were homogenized with a homogenizer in cold saline (1:10, w/v), and then centrifuged at 3000 rpm for 15 min for detecting the levels of H2O2 and catalase using commercial kits (Nanjing Jiancheng Biology Co., Ltd).
Liver tissues were fixed in 10% formalin, embedded in paraffin, cut into 4-μm-thick sections, and stained with hematoxylin-eosin. For immunohistochemical assay, sections were immersed in anti-HMGB1 antibody solution in a humidified chamber at 4 °C overnight, followed by incubation in a biotin–labeled secondary antibody solution at 37 °C for 1 h. Then, the slices were incubated with SABC solution at 37 °C for 1 h. All images were observed by microscopy (ZEISS, German).
The mouse embryonic hepatocyte cell line BNL.CL2, purchased from the cell bank of the Shanghai Institutes for Biological Sciences (Shanghai, China), was cultured in Dulbecco’s modified Eagle’s medium (DMEM) (Gibco, United States) supplemented with 10% fetal calf serum (Gibco, United States), 100 U/mL penicillin and 100 U/mL streptomycin, at 37 °C in a 5% (v/v) CO2 humidified atmosphere. When cells were grown to 70%-80% confluence, they were treated with H2O2 (Kaiji Biology Co. Ltd, China) at different concentrations for the same duration or at the same concentration for different durations.
The LDH cytotoxicity assay was performed with a kit (Cytotoxicity LDH Assay Kit-WST, Dojindo Molecular Technologies, Shanghai) according to the manufacturer’s guidelines. In summary, 1 × 10⁴ cells cultured in 96-well plates in the presence or absence of H2O2 were incubated with 100 µL of working solution for 30 min at room temperature, and the 96-well plates were protected from light. Next, 50 µL of stop solution was added, and the absorbance of each sample was read at 490 nm using a Synergy 2 plate reader (Bio-Tek Ltd, United States). The cytotoxicity of each sample was normalized using the following formula: Cytotoxicity (%) = [(ODsample - ODblank) / (ODpostive - ODblank)] (%).
The levels of HMGB1 in the culture medium were measured by ELISA kit (Chondrex Co. Ltd, Redmond, United States) according to the manufacturer’s instructions.
The 8-hydroxy-2-deoxyguanosine (8-OHdG) levels were measured using a kit according to the manufacturer's protocol (8-OHdG assay kit, Genmed Inc., Shanghai, China). The kit provided 8-OHdG antibody and peroxidase labeled secondary antibody. TMB (3,3’,5,5’-tetramethylbenzidine) was used as a peroxidase substrate and formed blue precipitates at pH 4.9. The absorbance was read at 650 nm using a Synergy 2 plate reader.
The NAD+ levels in cultured cells or liver tissues were determined using an enzymatic method according to the manufacturer’s instructions (EnzyChrom, BioAssays Systems, CA, United States). Typically, 20 mg of liver tissue or 1 × 10⁵ cells were homogenized in a 1.5 mL Eppendorf tube with 100 µL of NAD+ extraction buffer preheated for 5 min at 60 °C, and then 20 µL assay buffer was added along with 100 µL of NADH extraction buffer to neutralize the extracts. The extracts were spun down at 14000 rpm for 5 min, and the supernatant was transferred into a clear flat-bottom 96-well plate for NAD+ concentration assays. After the working buffer was added, the absorbance for time “zero” (A0) was read at 565 nm and A15 after a 15-min incubation at room temperature of each well was recorded with a Synergy 2 plate reader (Bio-Tek Ltd, United States). Finally, according to the standard curve, NAD+ levels were normalized using the following formula[14]: NAD+ levels (μM) = (∆Asample-∆Ablank)/slope × n, where ∆A = A15-A0, n equaling 5 was the dilution ratio of samples, and the slope was calculated from the standard curve.
Sirt1 deacetylase activity was measured using a Sirt1 direct fluorescent screening assay kit (GENMED Inc., Shanghai, China) following the manufacturer’s protocol. The Sirt1 substrate in the kit is an acetylated peptide fragment derived from p53 that was prelabeled with 7-amino-4-methylcoumarin (AMC). After deacetylation by Sirt1, an amino peptidase cleaved the deacetylated substrate, which generated a highly fluorescent molecule group of AMC. The fluorescence intensity was monitored each 5 min for 1 h using a fluorescence plate reader (Bio-Tek FL×800) at an excitation wavelength of 360 nm and an emission wavelength of 460 nm. Values are expressed as the rate of reaction for the first 30 min. The results were normalized by the total protein concentration, determined using a BCA assay.
Cytoplasmic and nuclear protein fractions from BNL.Cl2 cells or liver tissues were extracted with a commercial protein isolation kit from Yeasen Co., Ltd. (Shanghai, China) according to the manufacturer’s instructions. Briefly, 1 × 10⁷ BNL.CL2 cells or 50 mg liver tissue with reagent A were collected into 1.5 mL microcentrifuge tubes and vortexed for 5 s. Afterwards, samples were put on ice for 10 min and centrifuged for an additional 5 min at 12000 rpm and 4 °C. The supernatants were cytoplasmic proteins. The precipitates with Reagent C were vortexed for 25 s per 3 min interval, total 30 min. Finally, samples were centrifuged for 5 min at 12000 rpm and 4 °C, and the supernatants were nuclear proteins.
Protein concentration was determined by BCA assay (Beyotime, Suzhou, China). The 4%-20% SDS-PAGE-Resolved protein bands were transferred to PVDF membranes (Millipore, Bedford, MA, United States) with a Trans-Blot Turbo transfer system (Bio-Rad). Primary antibodies (Abcam Co., Ltd, United States) and compatible horseradish peroxidase-conjugated secondary antibodies were used. Proteins were detected using chemiluminescence-plus reagents from Millipore Co., Ltd. (Bedford, MA, United States). The blot image was captured with a Protein Simple multispectral imaging system with a Chemi HR camera and analyzed using AlphaView SA (version 3.4.0; Protein Simple, United States).
Total lysates (300 μg)were immunoprecipitated with specific rabbit anti-HMGB1 (1:75) or Parp1 antibody (1:50), while the control lysates were immunoprecipitated with rabbit anti-immunoglobulin antibody on a Labnet Mini LabRoller Rotator (Labnet, Edison, NJ, United States) at 4 °C overnight, followed by the incubation with 30 μL of protein A/G agarose beads to extract the immunocomplexes for 3 h at room temperature. Thereafter, beads were washed with IP lysis buffer and the immunocomplexes were extracted in SDS loading buffer at 97 °C, followed by Western blot analysis.
Cells (1 × 10⁴) were seeded on cover-glass bottom dishes and treated with either 500 μmol/L H2O2 for 0.5 h, 2 h, 8 h or 24 h, or with 100 μmol/L, 500 μmol/L, or 1000 μmol/L H2O2 for 8 h. Following treatment, cells were fixed with 4% paraformaldehyde for 30 min, and then incubated in phosphate buffered saline (PBS) containing 0.2% Triton-X-100 for 30 min on ice. Thereafter, cells were blocked with 5% Goat serum for 1h at room temperature, followed by incubation in a 5% BSA solution containing HMGB1 primary antibody (1:100) overnight at 4 °C. The next day, after a triple wash in Tween-20 phosphate buffer saline, the cells were incubated in PBS containing Alexa Fluor 594 conjugated secondary antibody (1:300) using a 1% BSA dilution for 1h at room temperature. Lastly, the nucleus were stained nuclei with DAPI, and the dishes were mounted and observed using a ZEISS confocal laser fluorescence microscope (ZEISS, German).
After purity determination, each amount of total RNA sample extracted from liver tissues or cells was reverse transcribedinto cDNA using a TransScript® All-in-One First-Strand cDNA Synthesis SuperMix for qPCR Kit (One-Step gDNA Removal) according to the manufacturer’s protocol. The mRNA levels were quantification with a SYBR Green qPCR SuperMix kit. The relative amount of target mRNA was calculated by the 2-ΔΔCt. Primer sequences for the genes used are as follows: Beta-actin (NM_007393.5): forward (5’–3’): ACTGCTCTGGCTCCTAGCAC, and reverse (5’–3’): ACATCTGCTGGAAGGTGGAC; SIRT1 (NM_019812.3): forward (5’–3’): GAACCACCAAAGCGGAAA, and reverse (5’–3’): TCCCACAGGAGACAGAAACC; PARP1 (NM_007415.2): forward Primer (5’–3’): ACCACTTCTCCTGCTTCTGG, and reverse Primer (5’–3’): GCCGTCTTCTTGACCTTCTG.
Cells were seeded in six-well plates at a density of 2 × 10⁵ cells, cultured until approximately 70% confluence, and then transfected with control or Sirt1-shRNA-pLKO.1-EGFP (Sirt1-F: CCG GGC CAT GTT TGA TAT TGAGT ATC TCG AGA TAC TCA ATA TCA AAC ATG GCT TTTTG; Sirt1-R: AAT TCA AAA AGC CAT GTT TGA TAT TGA GTA TCT CGA GAT ACT CAA TAT CAA ACA TGGC) lentiviral vector (USEN Biological Technology Co., Ltd, Shanghai, China) (MOI:4-8) according to the manufacturer’s instructions. Briefly, the vectors were dissolved in no fetal calf serum DMEM. Before infection, the cells were treated with 5 μg/mL polybrene for 4 h. After 24 h of infection, the cells were incubated for 48 h in 2% fetal calf serum DMEM including 10 μg/mL Puromycin dihydrochloride. Then, the cells were treated with or without H2O2 (500 μM) for 8 h. The mRNA levels of Sirt1 and Parp1 were determined by Real-time PCR, and protein levels of Sirt1, Parp1, Ace-Parp1, Ace-HMGB1, and HMGB1 were determined as above.
The BNL.CL2 cells were plated in six-well plates at a density of 2 × 10⁵ cells/mL, incubated until approximately 50% confluence, and then transfected with control or Parp1 using synergistic activation mediator CRISPR Activation Plasmid according to the manufacturer’s instructions. In summary, 20 μL of Parp1 plasmid DNA (sc-419018-ACT, Santa Cruz, United States) or negative control (sc-437275, Santa Cruz, United States) plasmid was dissolved in DMEM as solution A. Meanwhile, 10μL of UltraCruz® Transfection Reagent (sc-395739, Santa Cruz, United States) was also dissolved in DMEM to obtained solution B and equilibrated for 5 min at room temperature. Next, solutions A and B were mixed, and equilibrated for 20 min at room temperature to form a mixture of Parp1 plasmid DNA-UltraCruz® Transfection. The cells were transfected with Parp1 plasmid DNA or negative control plasmid. At 48 h after transfection, the medium was changed to fresh medium containing 10 μg/mL Puromycin dihydrochloride (sc-108071), 200 μg/mL Hygromycin B (sc-29067) and 2 μg/mL Blasticidin S HCl (sc-495389) for antibiotic selection, and then the parp1 expression level was detected by realtime-PCR.
Data were analyzed by one-way analysis of variance (ANOVA) or Welch ANOVA followed by the Student’s t-test using the GraphPad 8.0 software and are expressed as the mean ± standard deviation (SD), P < 0.05 was considered statistically significant. All experiments at least three independents were performed.
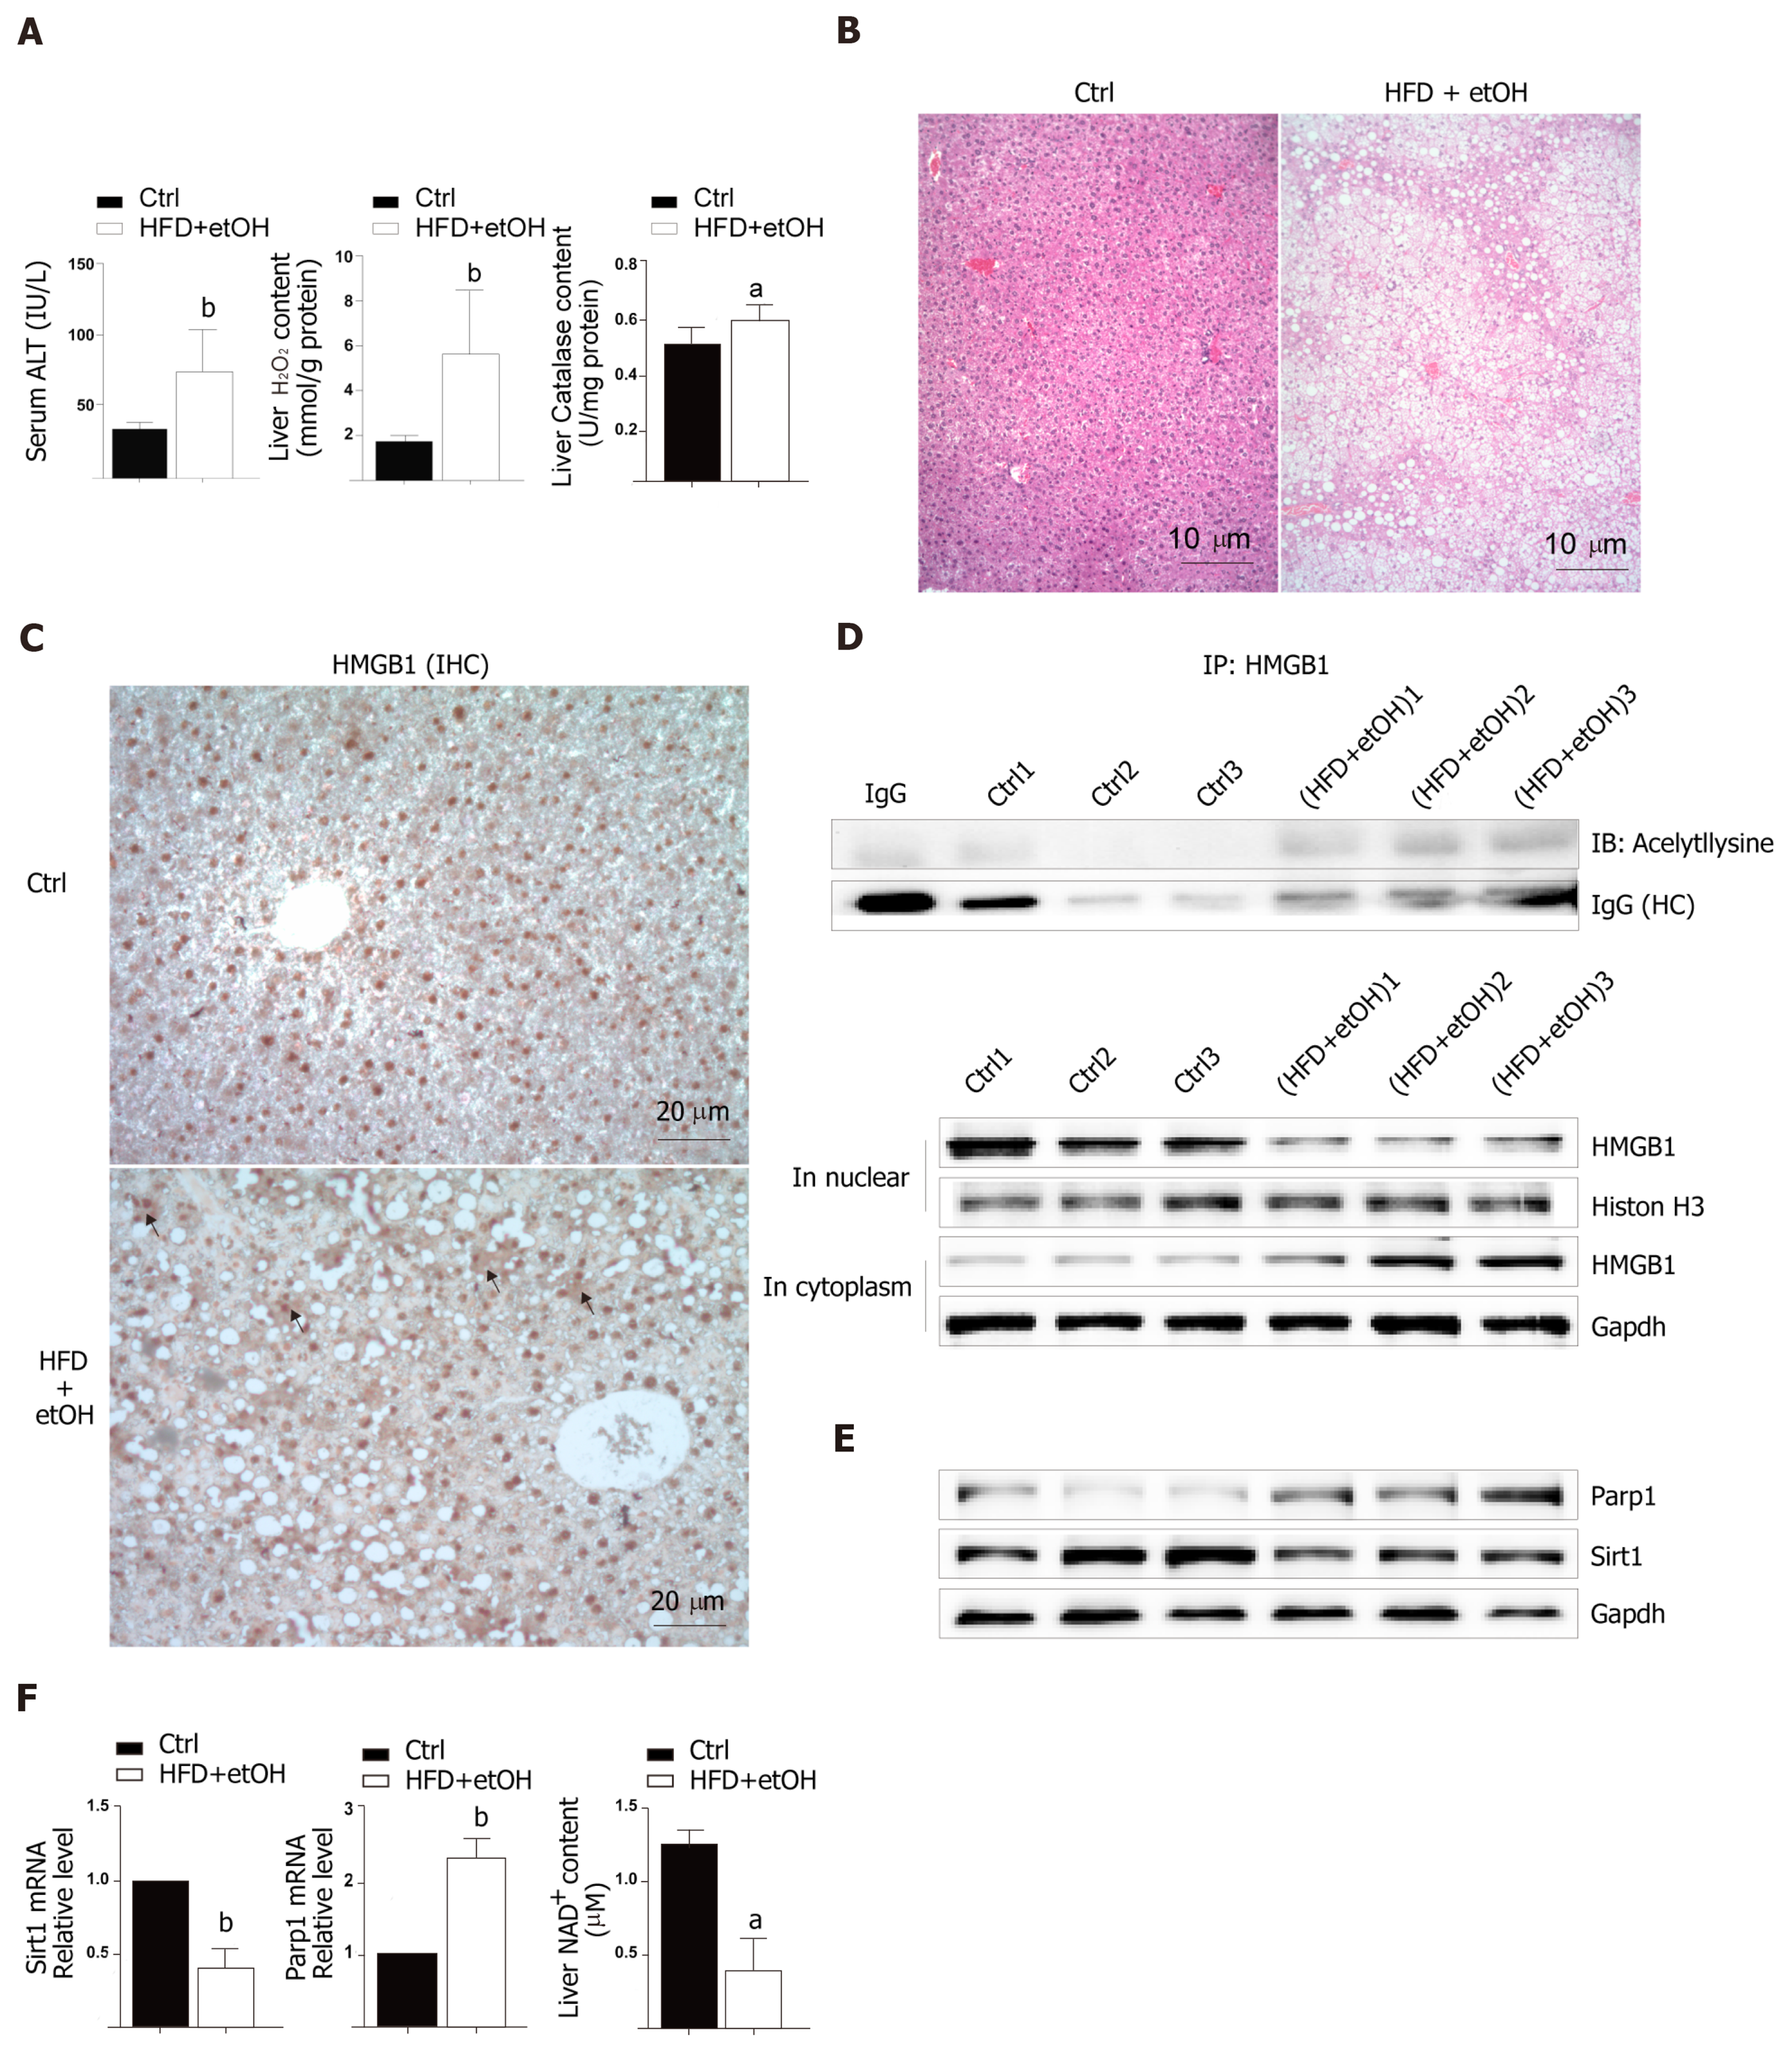
To study the release of HMGB1 in the livers following development of oxidative stress damage, C57BL6/J mice were fed a high fat diet for 12 wk and a single binge ethanol feeding before sacrifice. The HFD/etOH mice had higher serum ALT activity (Figure 1A) which is an enzyme in the cytoplasm of normal hepatocytes, but released from the livers into serum during hepatocellular injury[15]. Additionally, there was significantly increased H2O2 content and catalase activity in the livers (Figure 1A), and markedly increased hepatic steatosis (Figure 1B). The results of im-munohistochemistry indicated that HMGB1 was translocated from the nucleus to the cytoplasm in hepatocyte (black arrow in Figure 1C). Also, HMGB1 levels obviously rose in cytoplasm and decreased in the nucleus in hepatocyte of HFD/etOH mice with hyperacetylation (Figure 1D). Mice with fatty liver disease had significantly increased levels of Parp1, followed by decreased content of NAD+ and inhibited Sirt1 (Figure 1E and F).
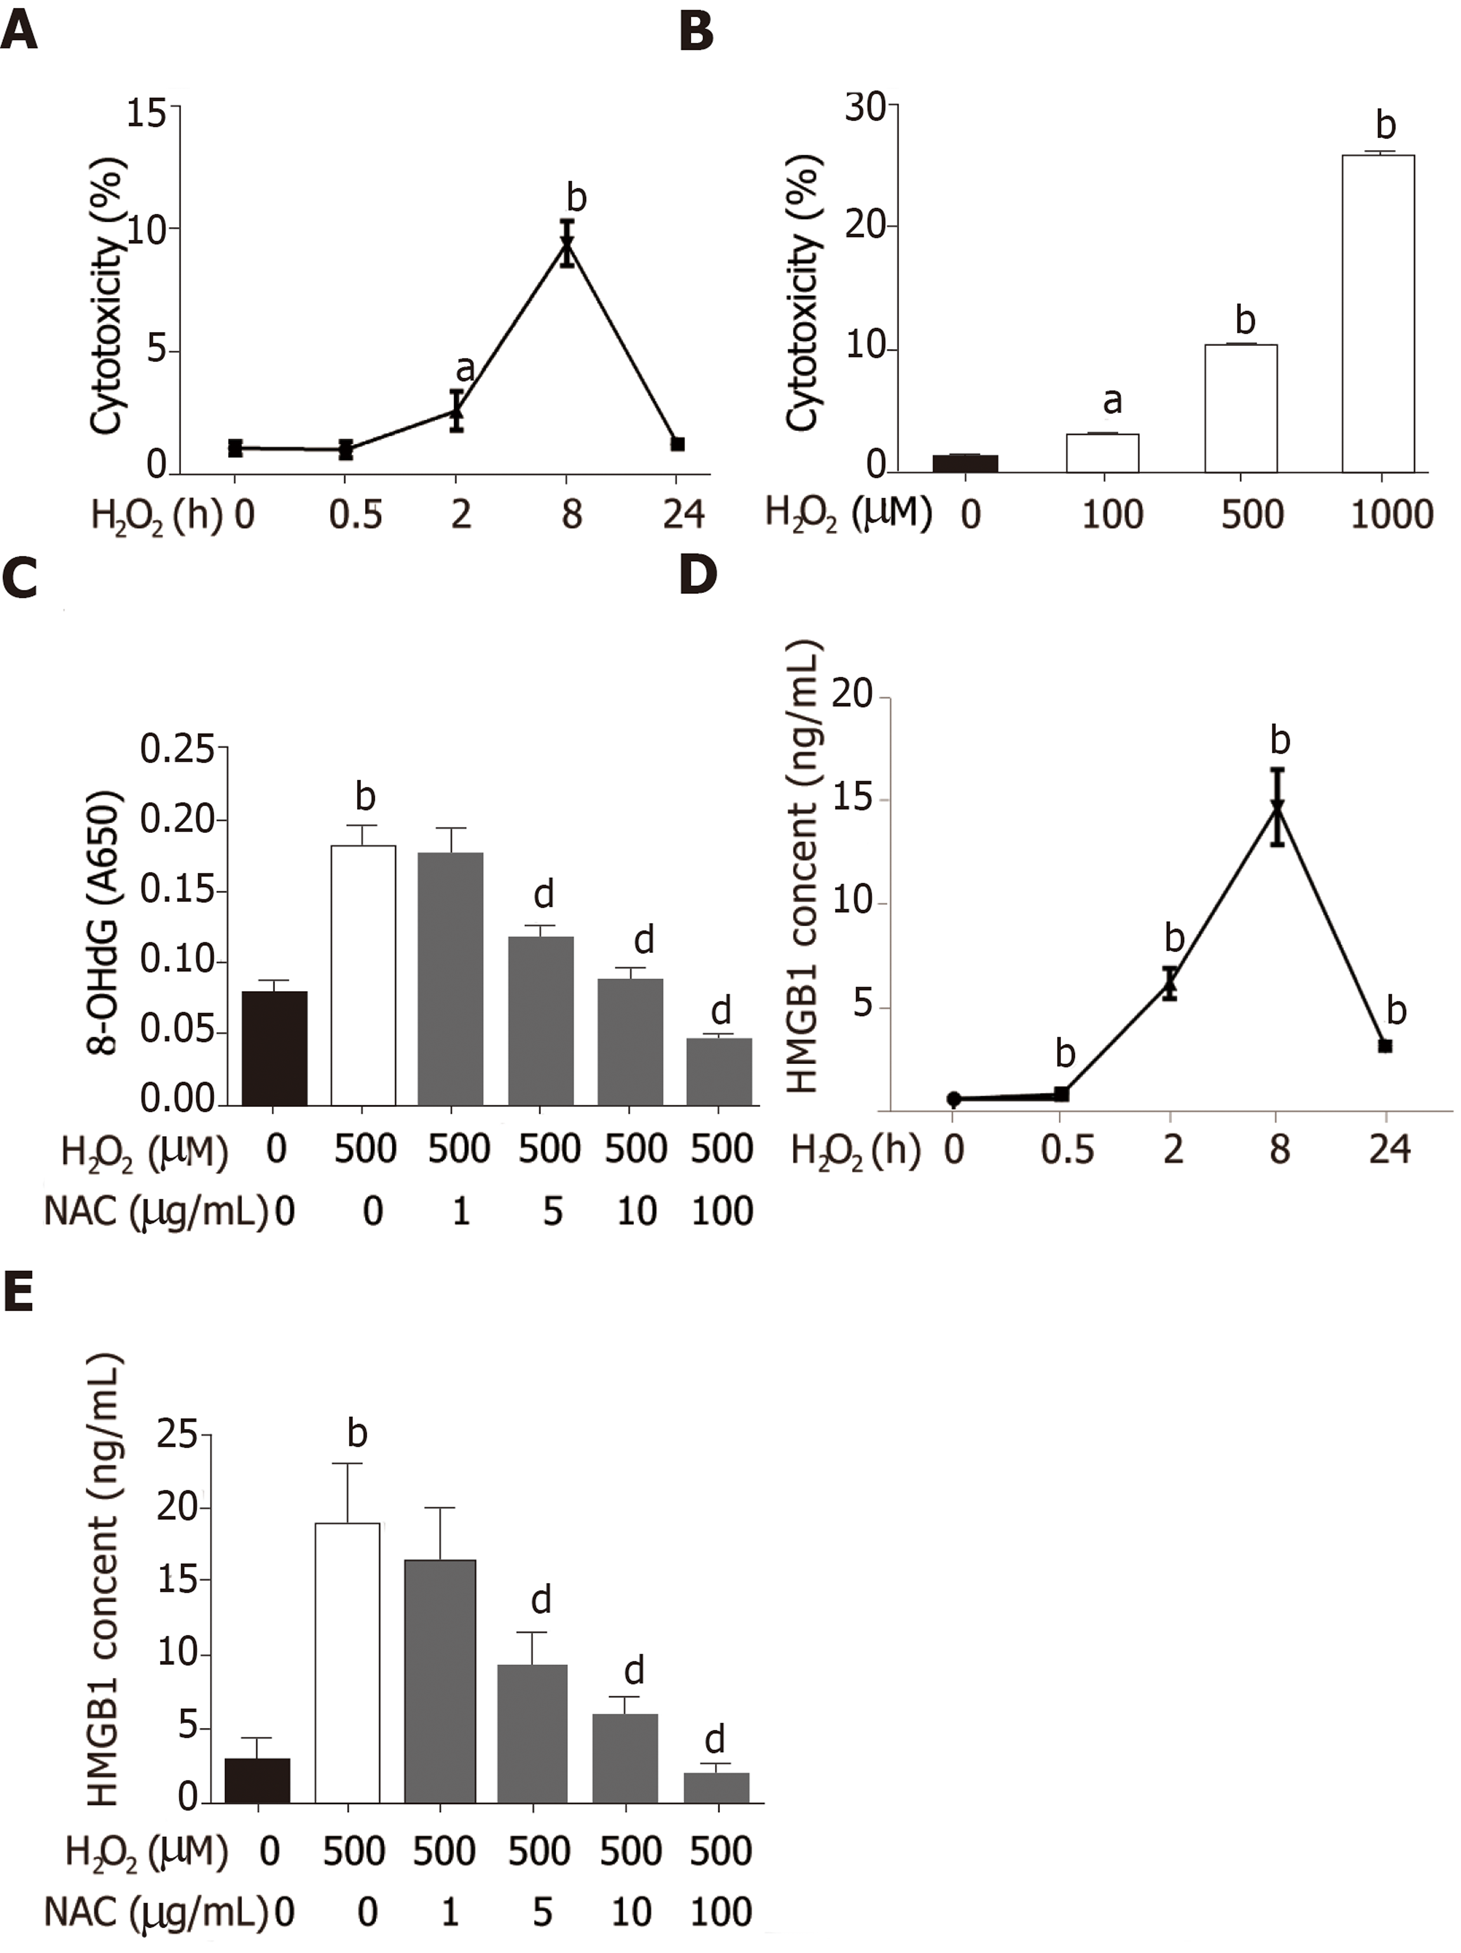
Hepatocytes are the most abundant and most vulnerable cell types to be attacked in the liver. To further investigate whether HMGB1 is released during injury/death, hepatocytes were treated with 500 μmol/L H2O2. Progressively elevated LDH release was observed, which peaked at 8h and then decreased gradually to nearly normal levels at 24 h (Figure 2A), and LDH was released from hepatocytes treated with various concentrations of H2O2 (0, 100, 500 and 1000 μmol/L) in a dose-dependent manner (Figure 2B). H2O2 triggered DNA injury by reactive oxygen species (ROS) which produced 8-OHdG, a marker of oxidative stress to DNA[16], therefore, 8-OHdG levels in H2O2-treated hepatocytes were measured. 8-OHdG levels were significantly increased by H2O2, but were suppressed by N-acetylcysteine (NAC), an ROS scavenger[17] (Figure 2C). In recent years, accumulating data have demonstrated that HMGB1 is released passively during various kinds of cellular injury and death[18,19]. In accordance with these reports, our results revealed that the HMGB1 content in medium was over 30-fold at 2 h and reached a 76-fold increase at 8 h, and was still 13-fold at 24 h (Figure 2D) after hepatocytes were exposed to 500 μmol/L H2O2 for different durations of time. Also, the HMGB1 content was decreased in a dose-dependent manner by NAC treatment (Figure 2E).
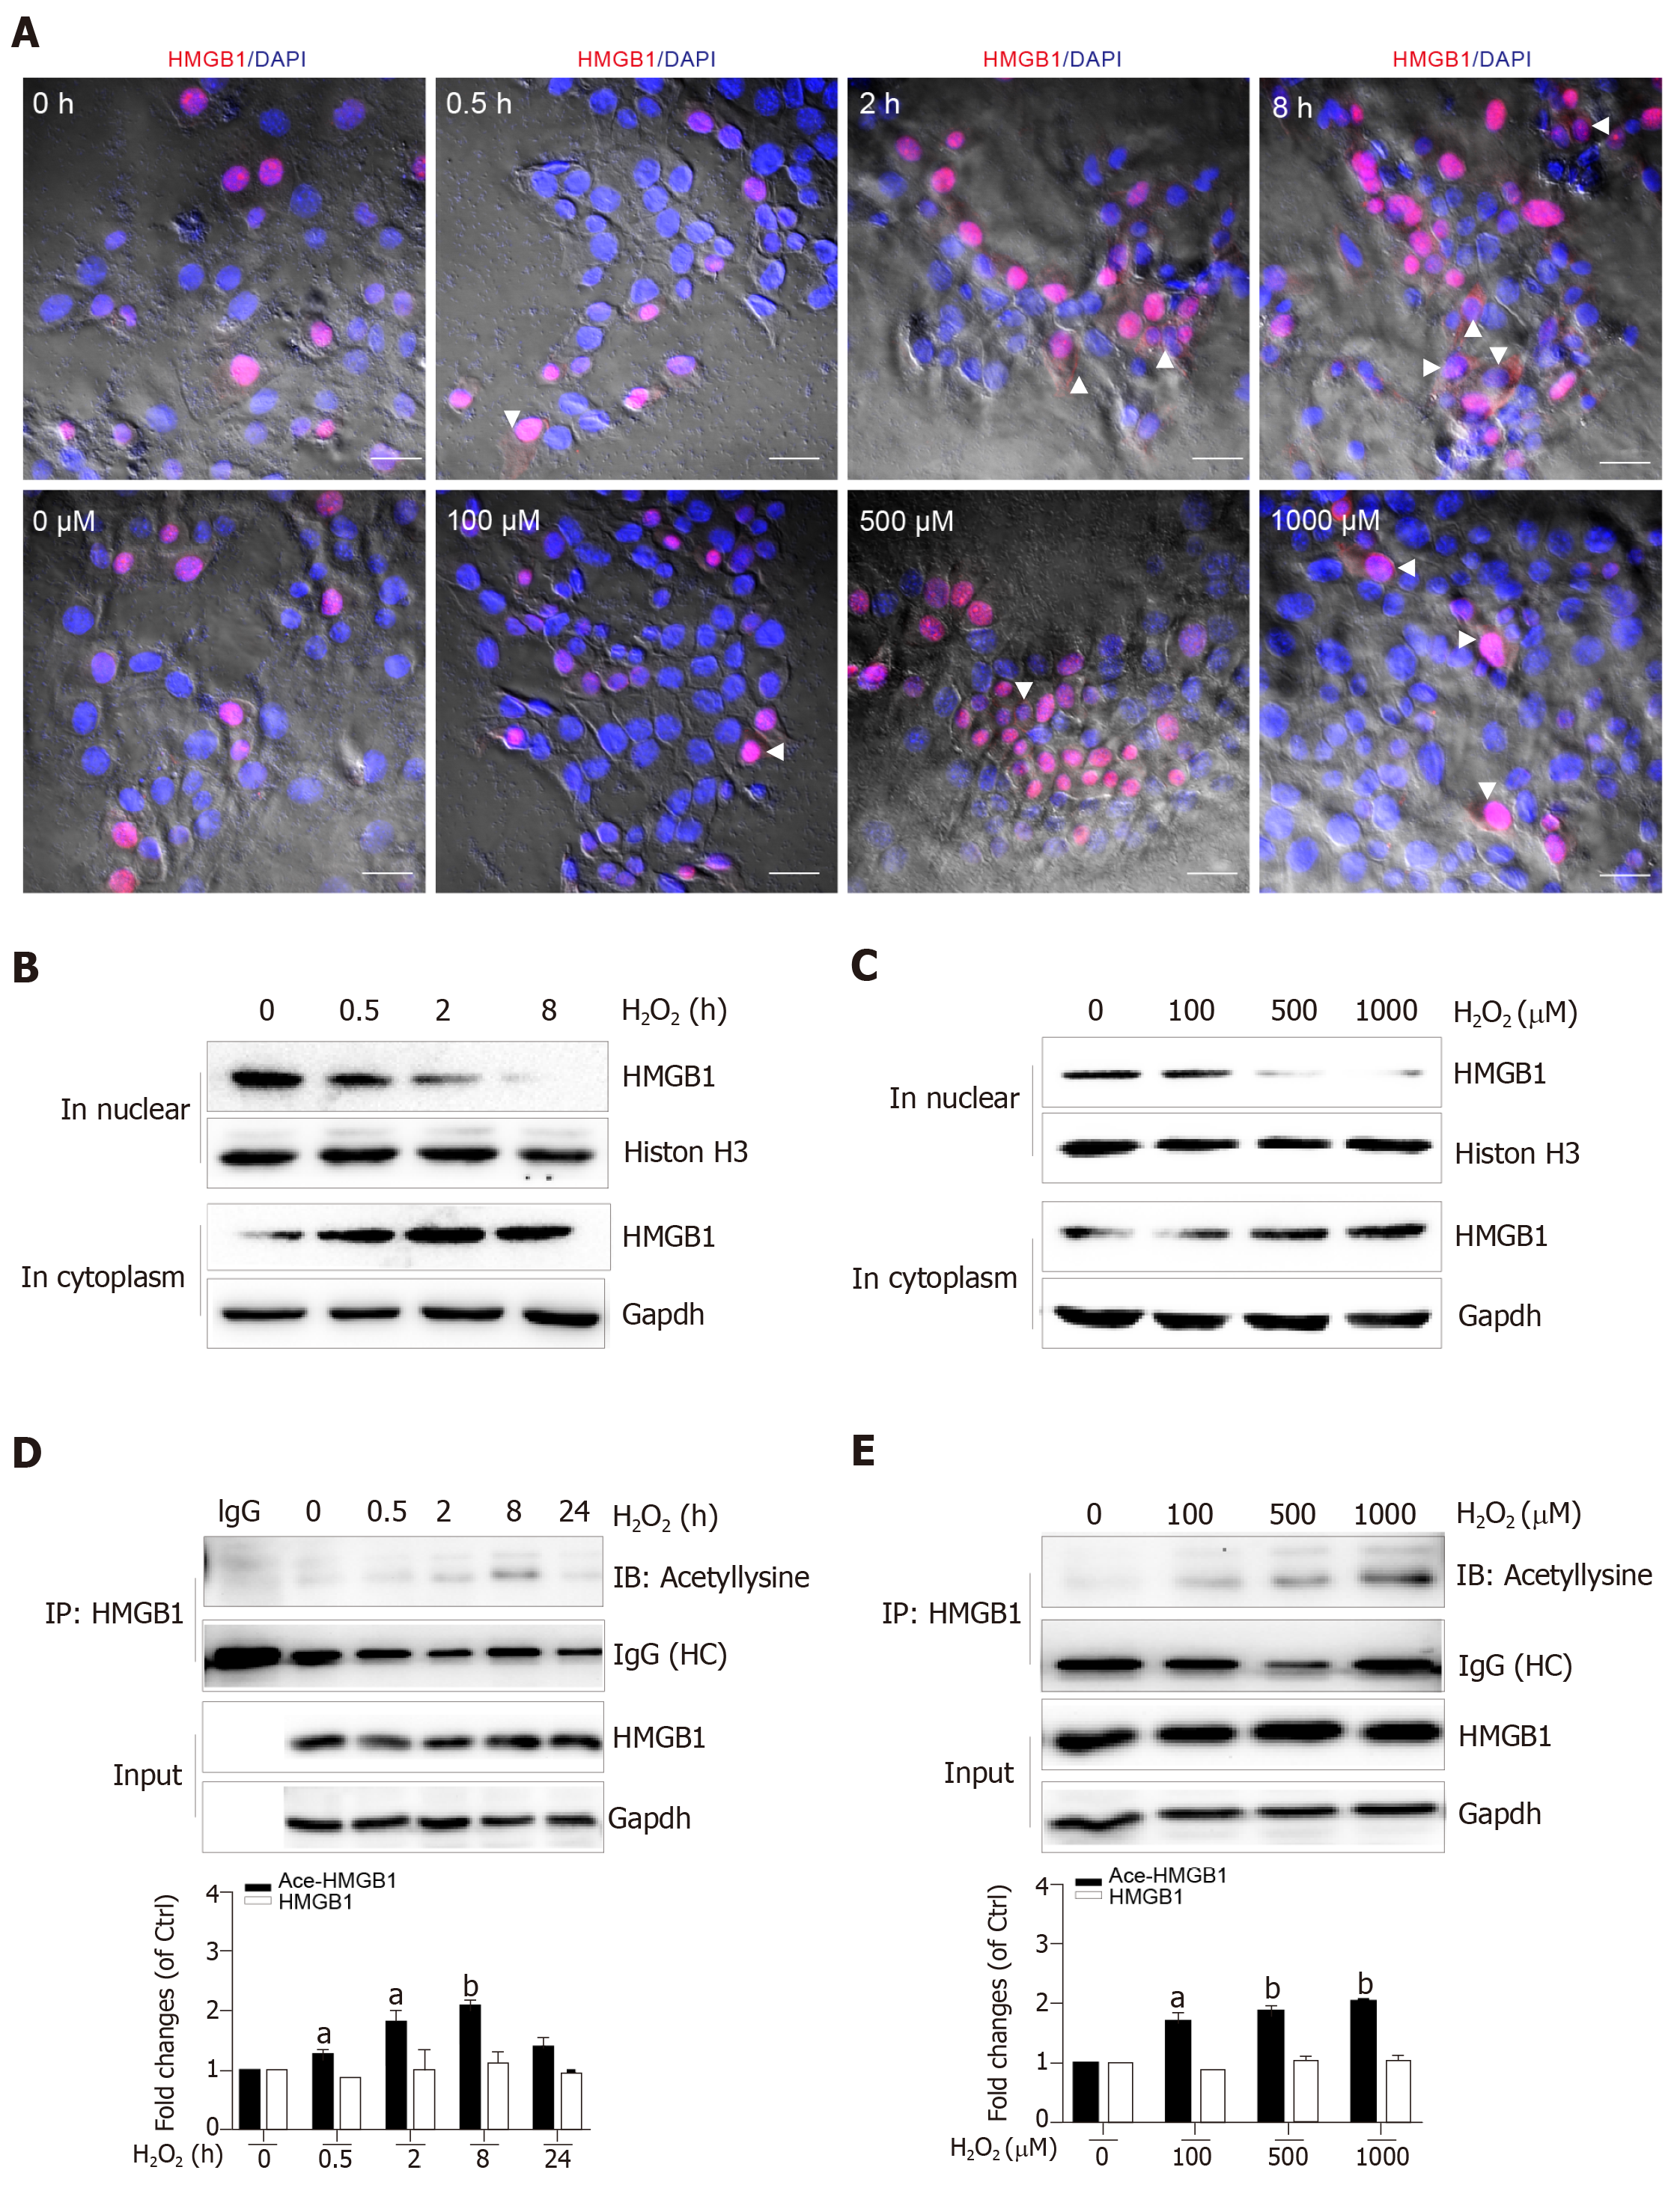
Nuclear HMGB1 continuously moving across the nuclear membrane into the cytoplasm through specific nuclear pores is a key stage of its extracellular release. Our immunohistochemical results showed that HMGB1 appeared in the cytoplasm after hepatocytes were treated with 500 μmol/L H2O2 for 2 h and 8 h, but not 0.5 h, meanwhile, it appeared in the cytoplasm in all groups of hepatocytes treated with 100, 500, and 1000 μmol/L H2O2 (Figure 3A). Consistent with these results, Western blot showed an increase of HMGB1 in the cytoplasm and decrease in the nucleus in a H2O2 time- and dose-dependent manner (Figure 3B and C). The accumulation of HMGB1 in the cytoplasm is determined by the acetylation status of specific lysine residues located in the two nuclear localization sequences[20]. We found that for the different lengths of time, acetylated (Ac) HMGB1 levels in cell lysates reached 1.2-fold even at 0.5 h and 2-fold peak at 8 h and decreased at 24 h after hepatocytes were incubated with H2O2 (Figure 3D). Likewise, the acetylated (Ac) HMGB1 levels also displayed an increase in a dose-dependent manner with H2O2 treatment (Figure 3E). Together, these findings suggest that as a consequence of injury to hepatocytes by H2O2 , HMGB1 is translocated from the nucleus to the cytoplasm and then released to medium with the concomitantly elevated proportion of the acetylated form.
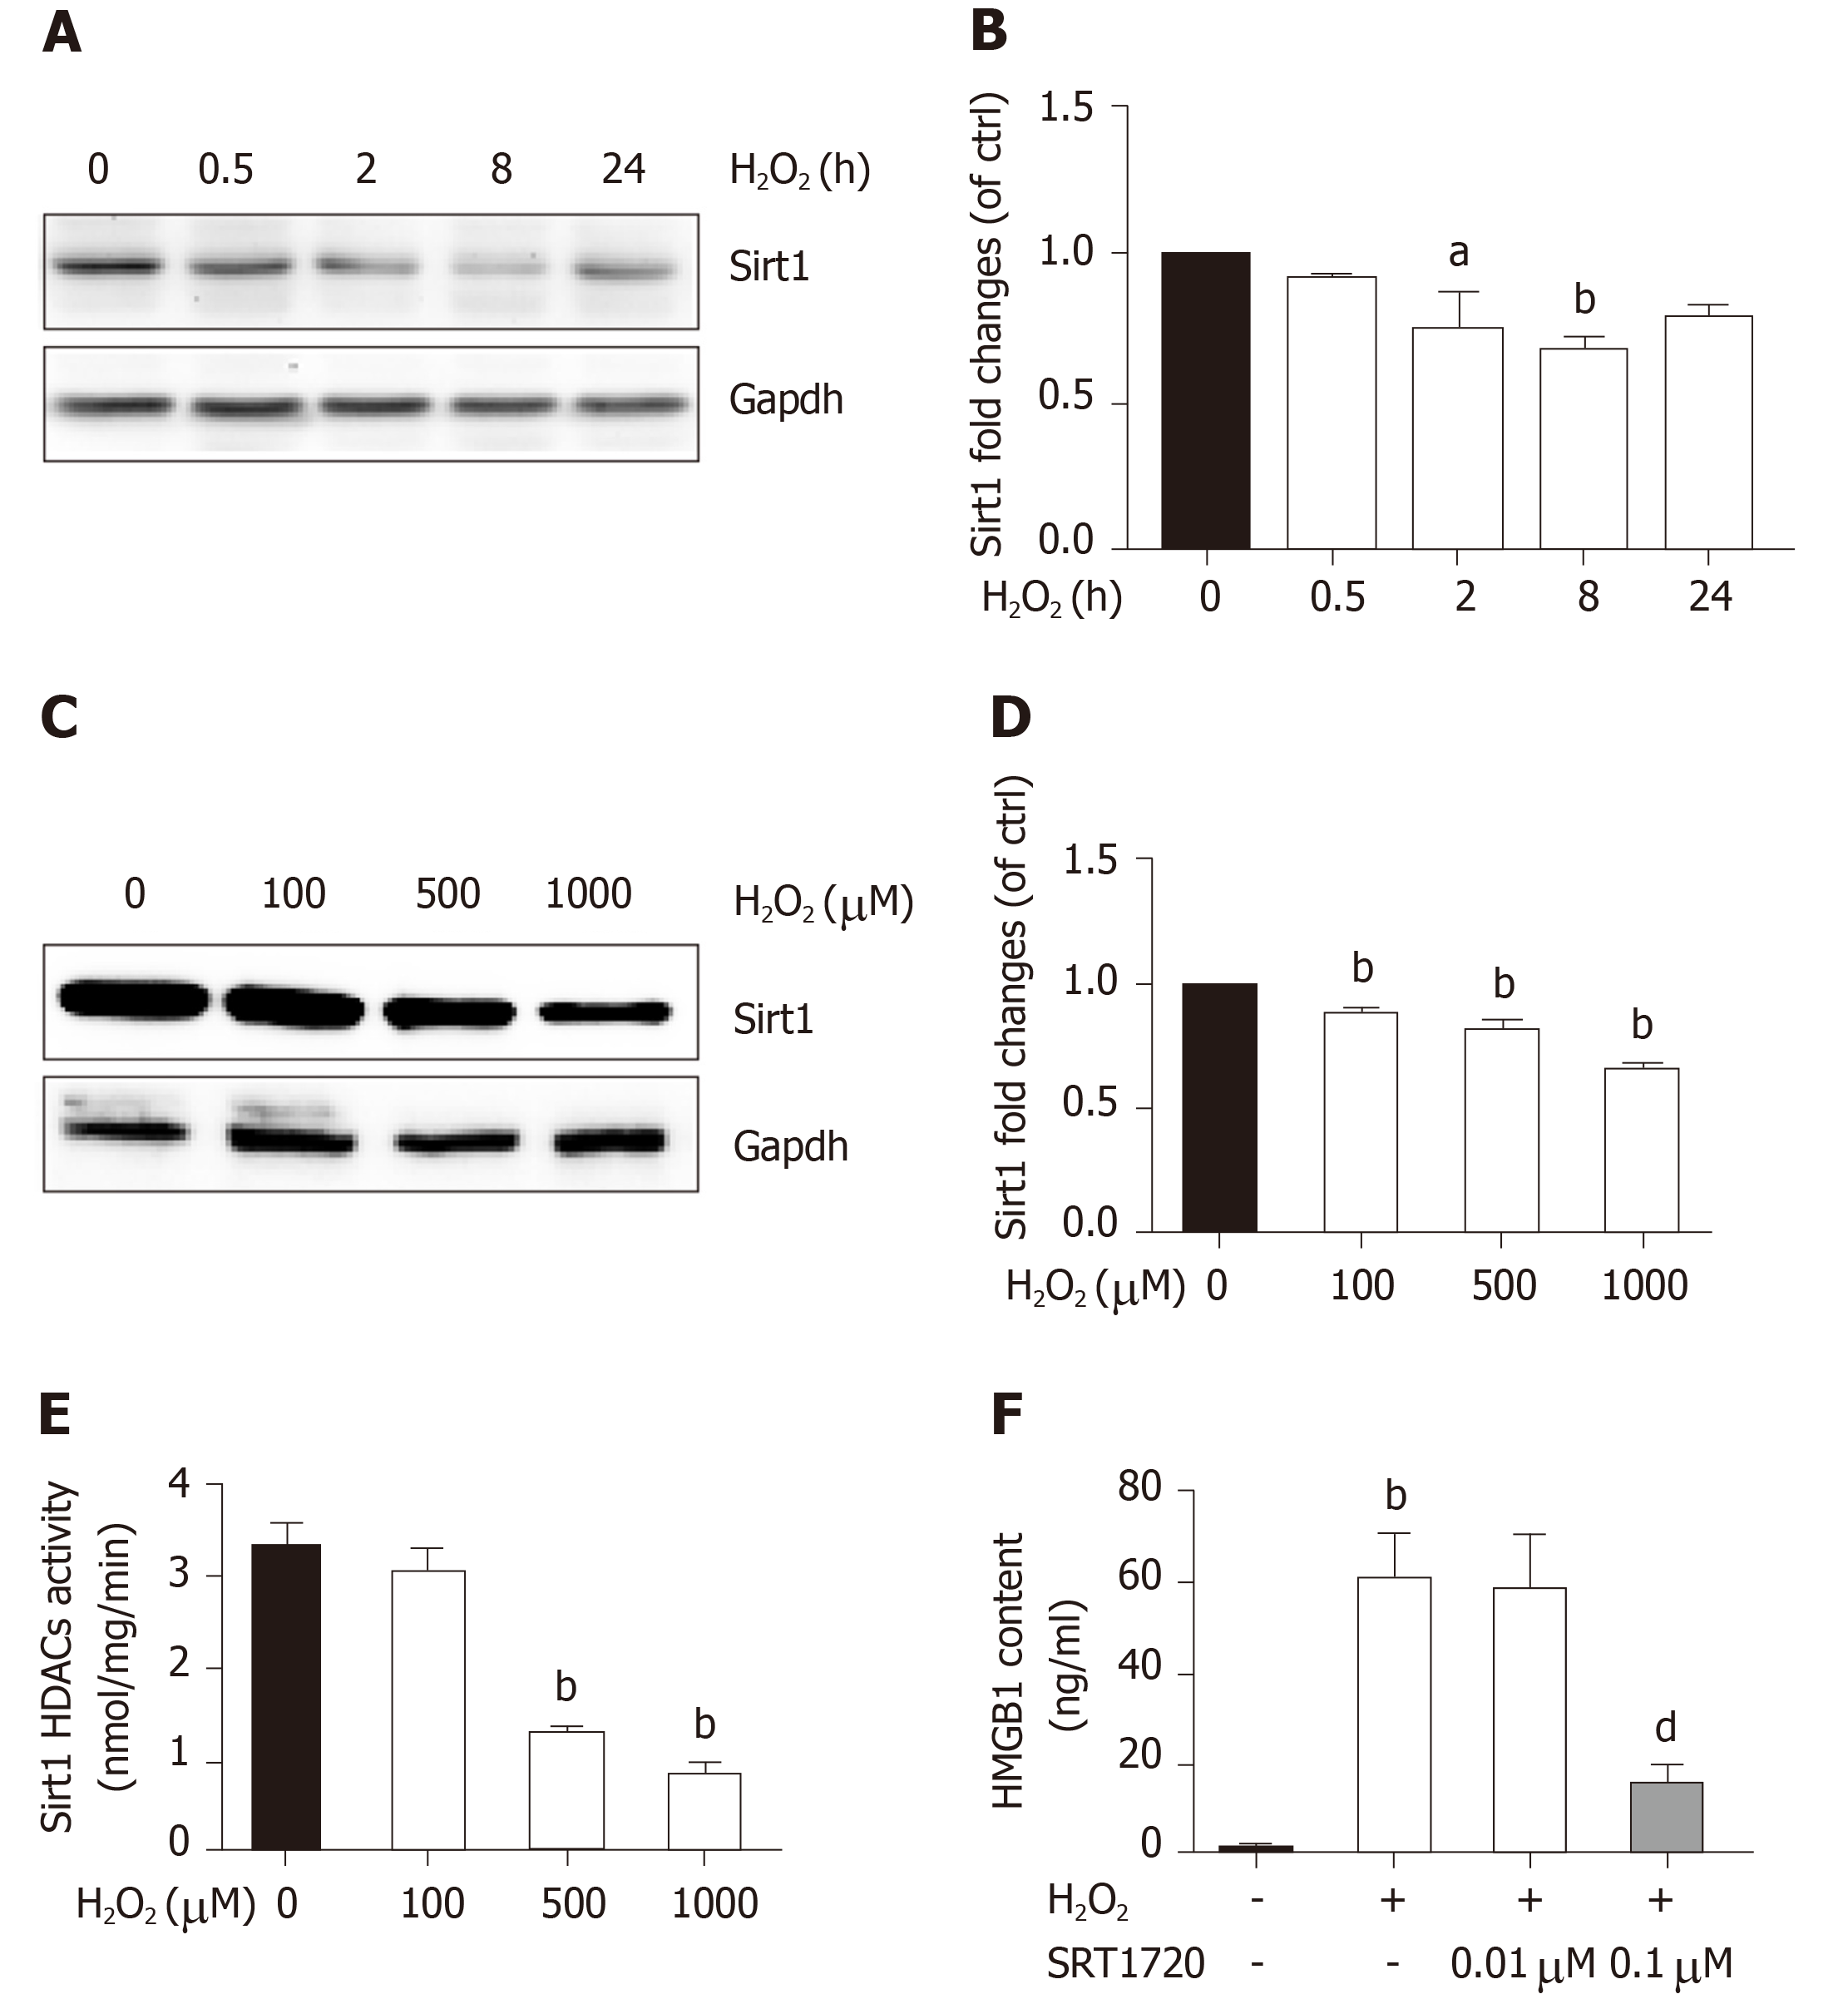
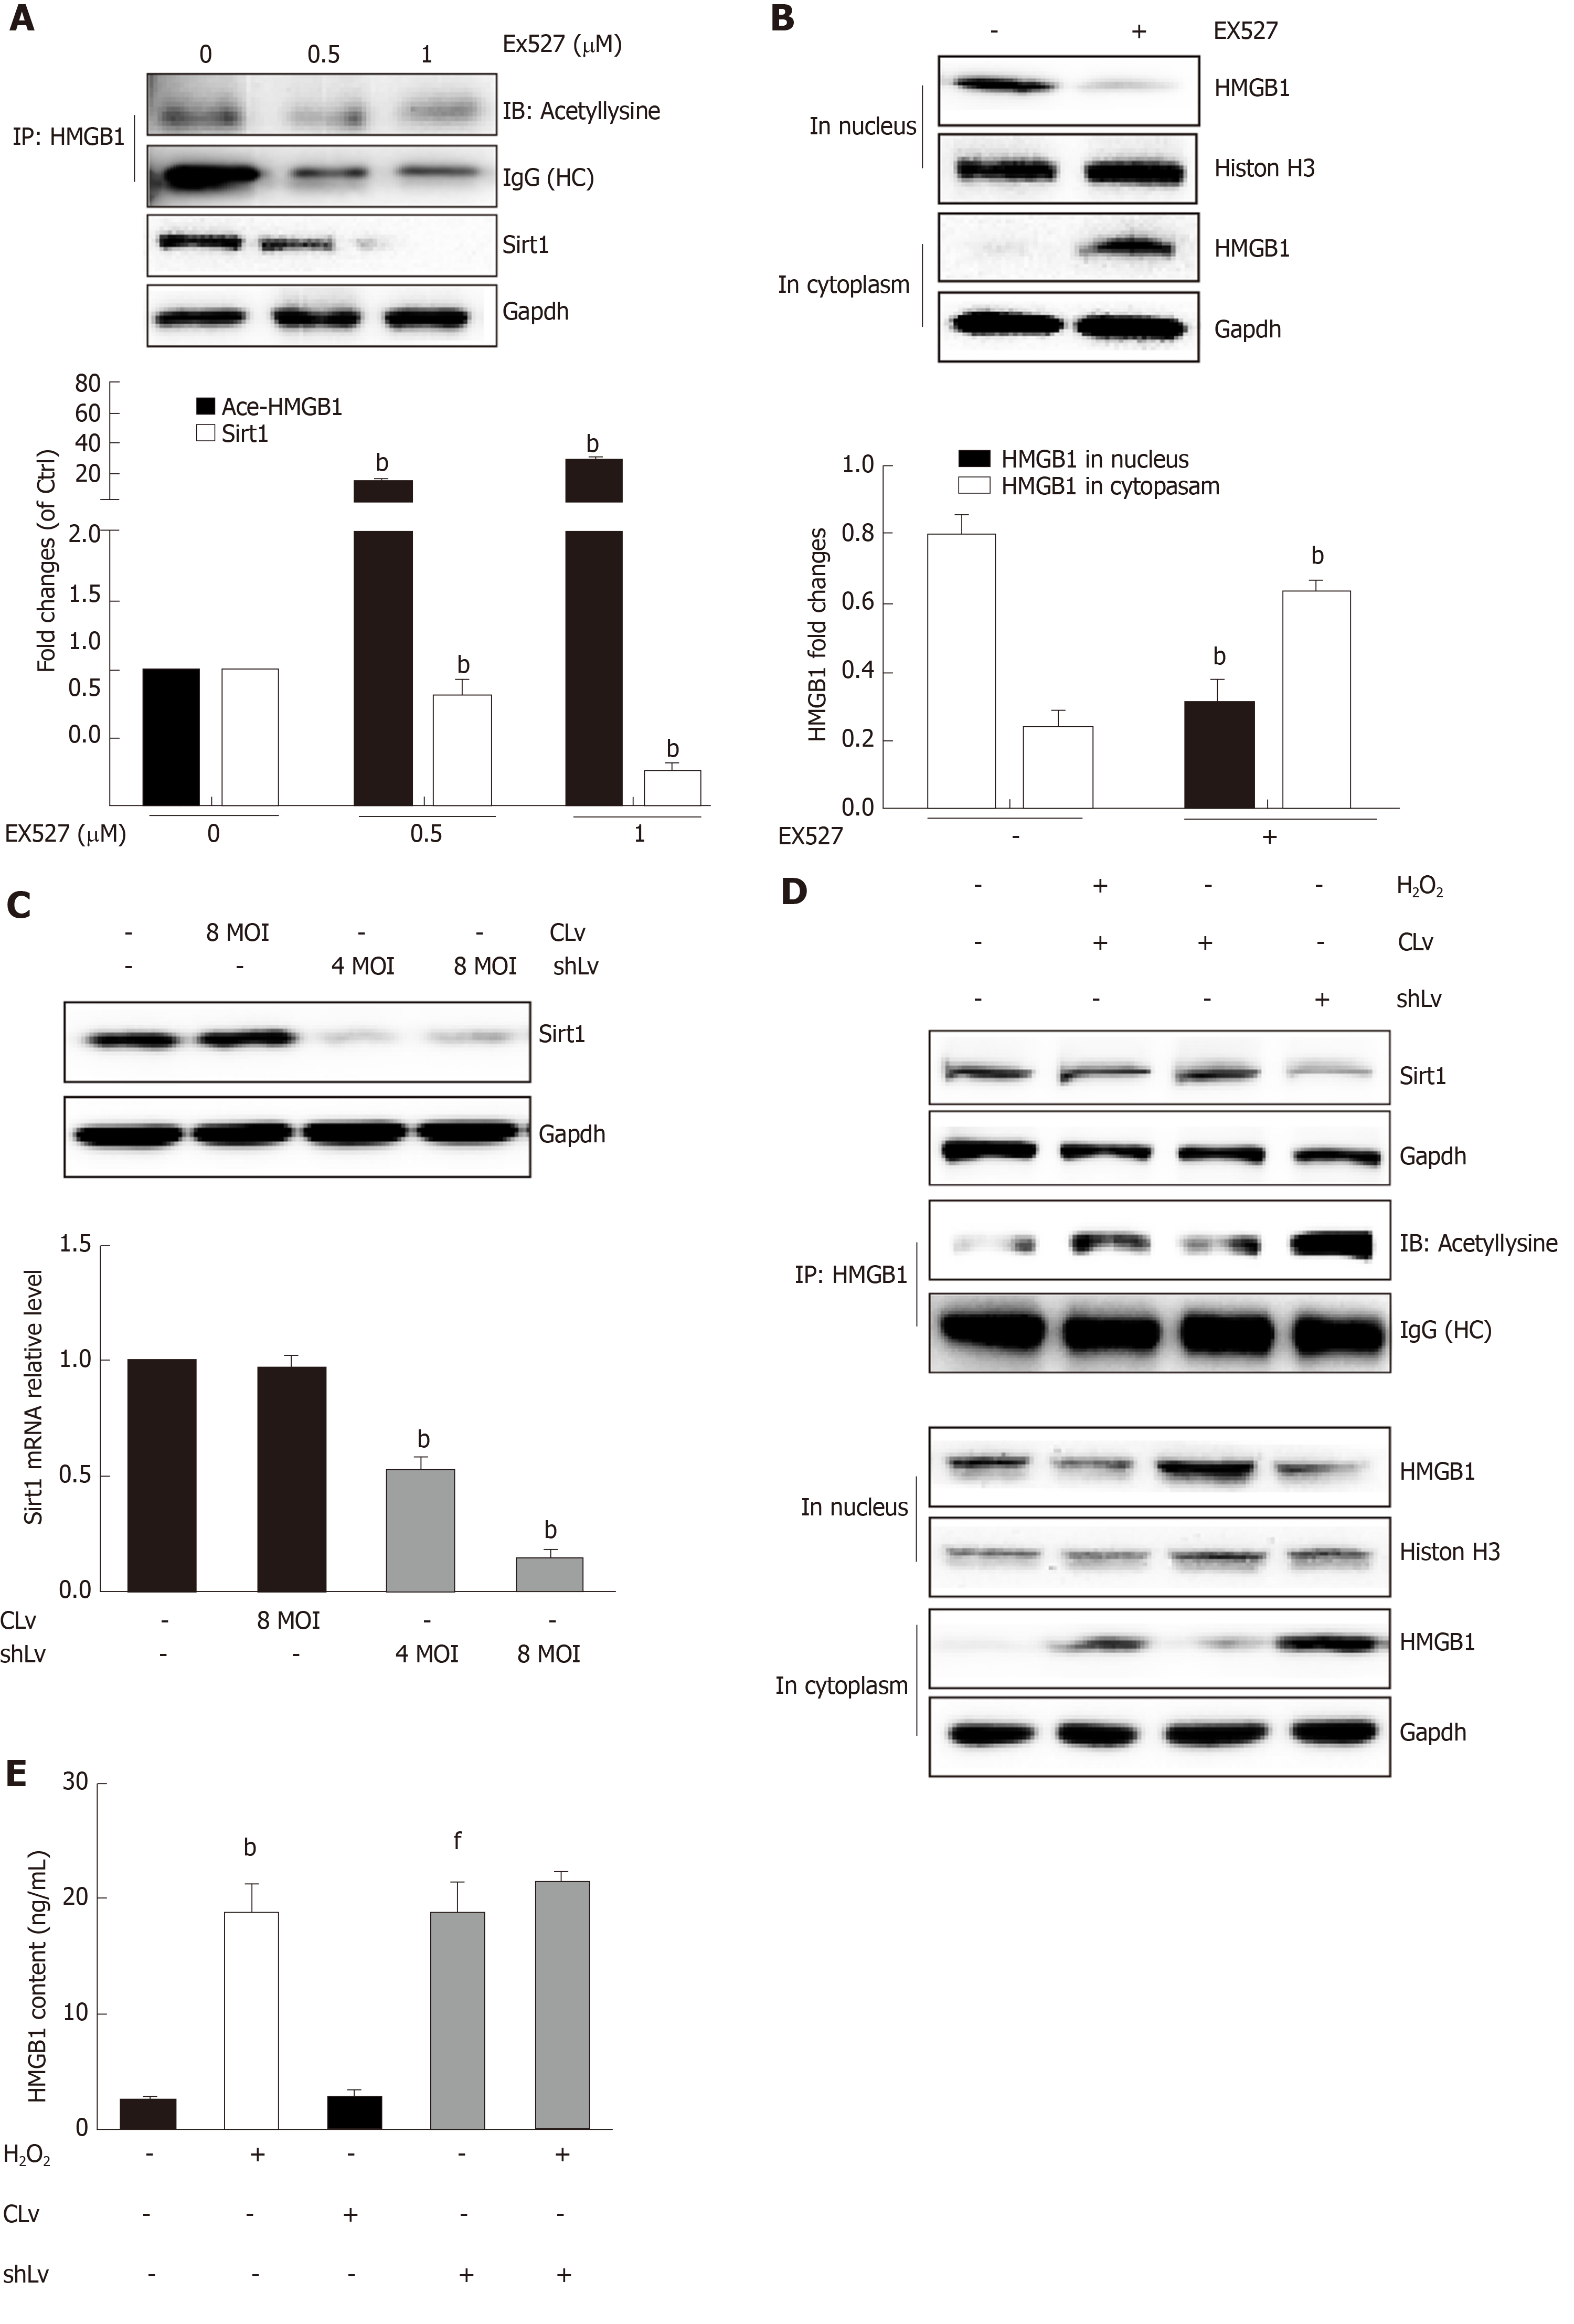
Sirt1, a mammalian ortholog of yeast silent information regulator 2, is a NAD+-dependent class III protein deacetylase that is involved in the deacetylation of HMGB1. Our previous findings indicated that hepatocytes exposed to oxidative stress in vitro release hyperacetylated HMGB1[21] and have a H2O2-induced Sirt1 levels[22], which prompted us to examine whether H2O2-induced HMGB1 was release by decreasing Sirt1 expression. As expected, the decrease of Sirt1 protein level was obvious in a H2O2 time- and dose-dependent manner (Figure 4A and B). Furthermore, the Sirt1 activity in the control group was 3.28 ± 0.14 nmoL/mg/min, but was 3.06 ± 0.13 nmoL/mg/min, 3.12 ± 0.02 nmoL/mg/min and 085 ± 0.05 nmoL/mg/min in groups treated with different concentrations of H2O2, respectively (Figure 4E). After cells were treated with 0.1 μmol/L SRT1720 (an activator of Sirt1) for 4 h, the HMGB1 contents in medium significantly decreased to 15.6 ± 2.87 ng/mL compared with 61.09 ± 9.86 ng/mL in cells treated with H2O2 alone (Figure 4F). After cells were treated with EX527, an inhibitor of Sirt1, Sirt1 levels decreased and acetylated HMGB1 increased, and as a consequence, HMGB1 was translocated from the nuclues to the cytoplasm (Figure 5A and B). To further investigate the effects of Sirt1 on HMGB1 acetylation and release, Sirt1 knockdown hepatocytes were employed (Figure 5C) and they strongly enhanced HMGB1 acetylation, accompanied by HMGB1 translocation from the nuclues to the cytoplasm and release to medium (Figure 5D and E). Because the decreased Sirt1 was companied with increased HMGB1 hyperacetylation and its release in H2O2 injured cells, we conclude that the Sirt1 suppression by H2O2 causes hyperacetylated HMGB1 and finally its release to medium.
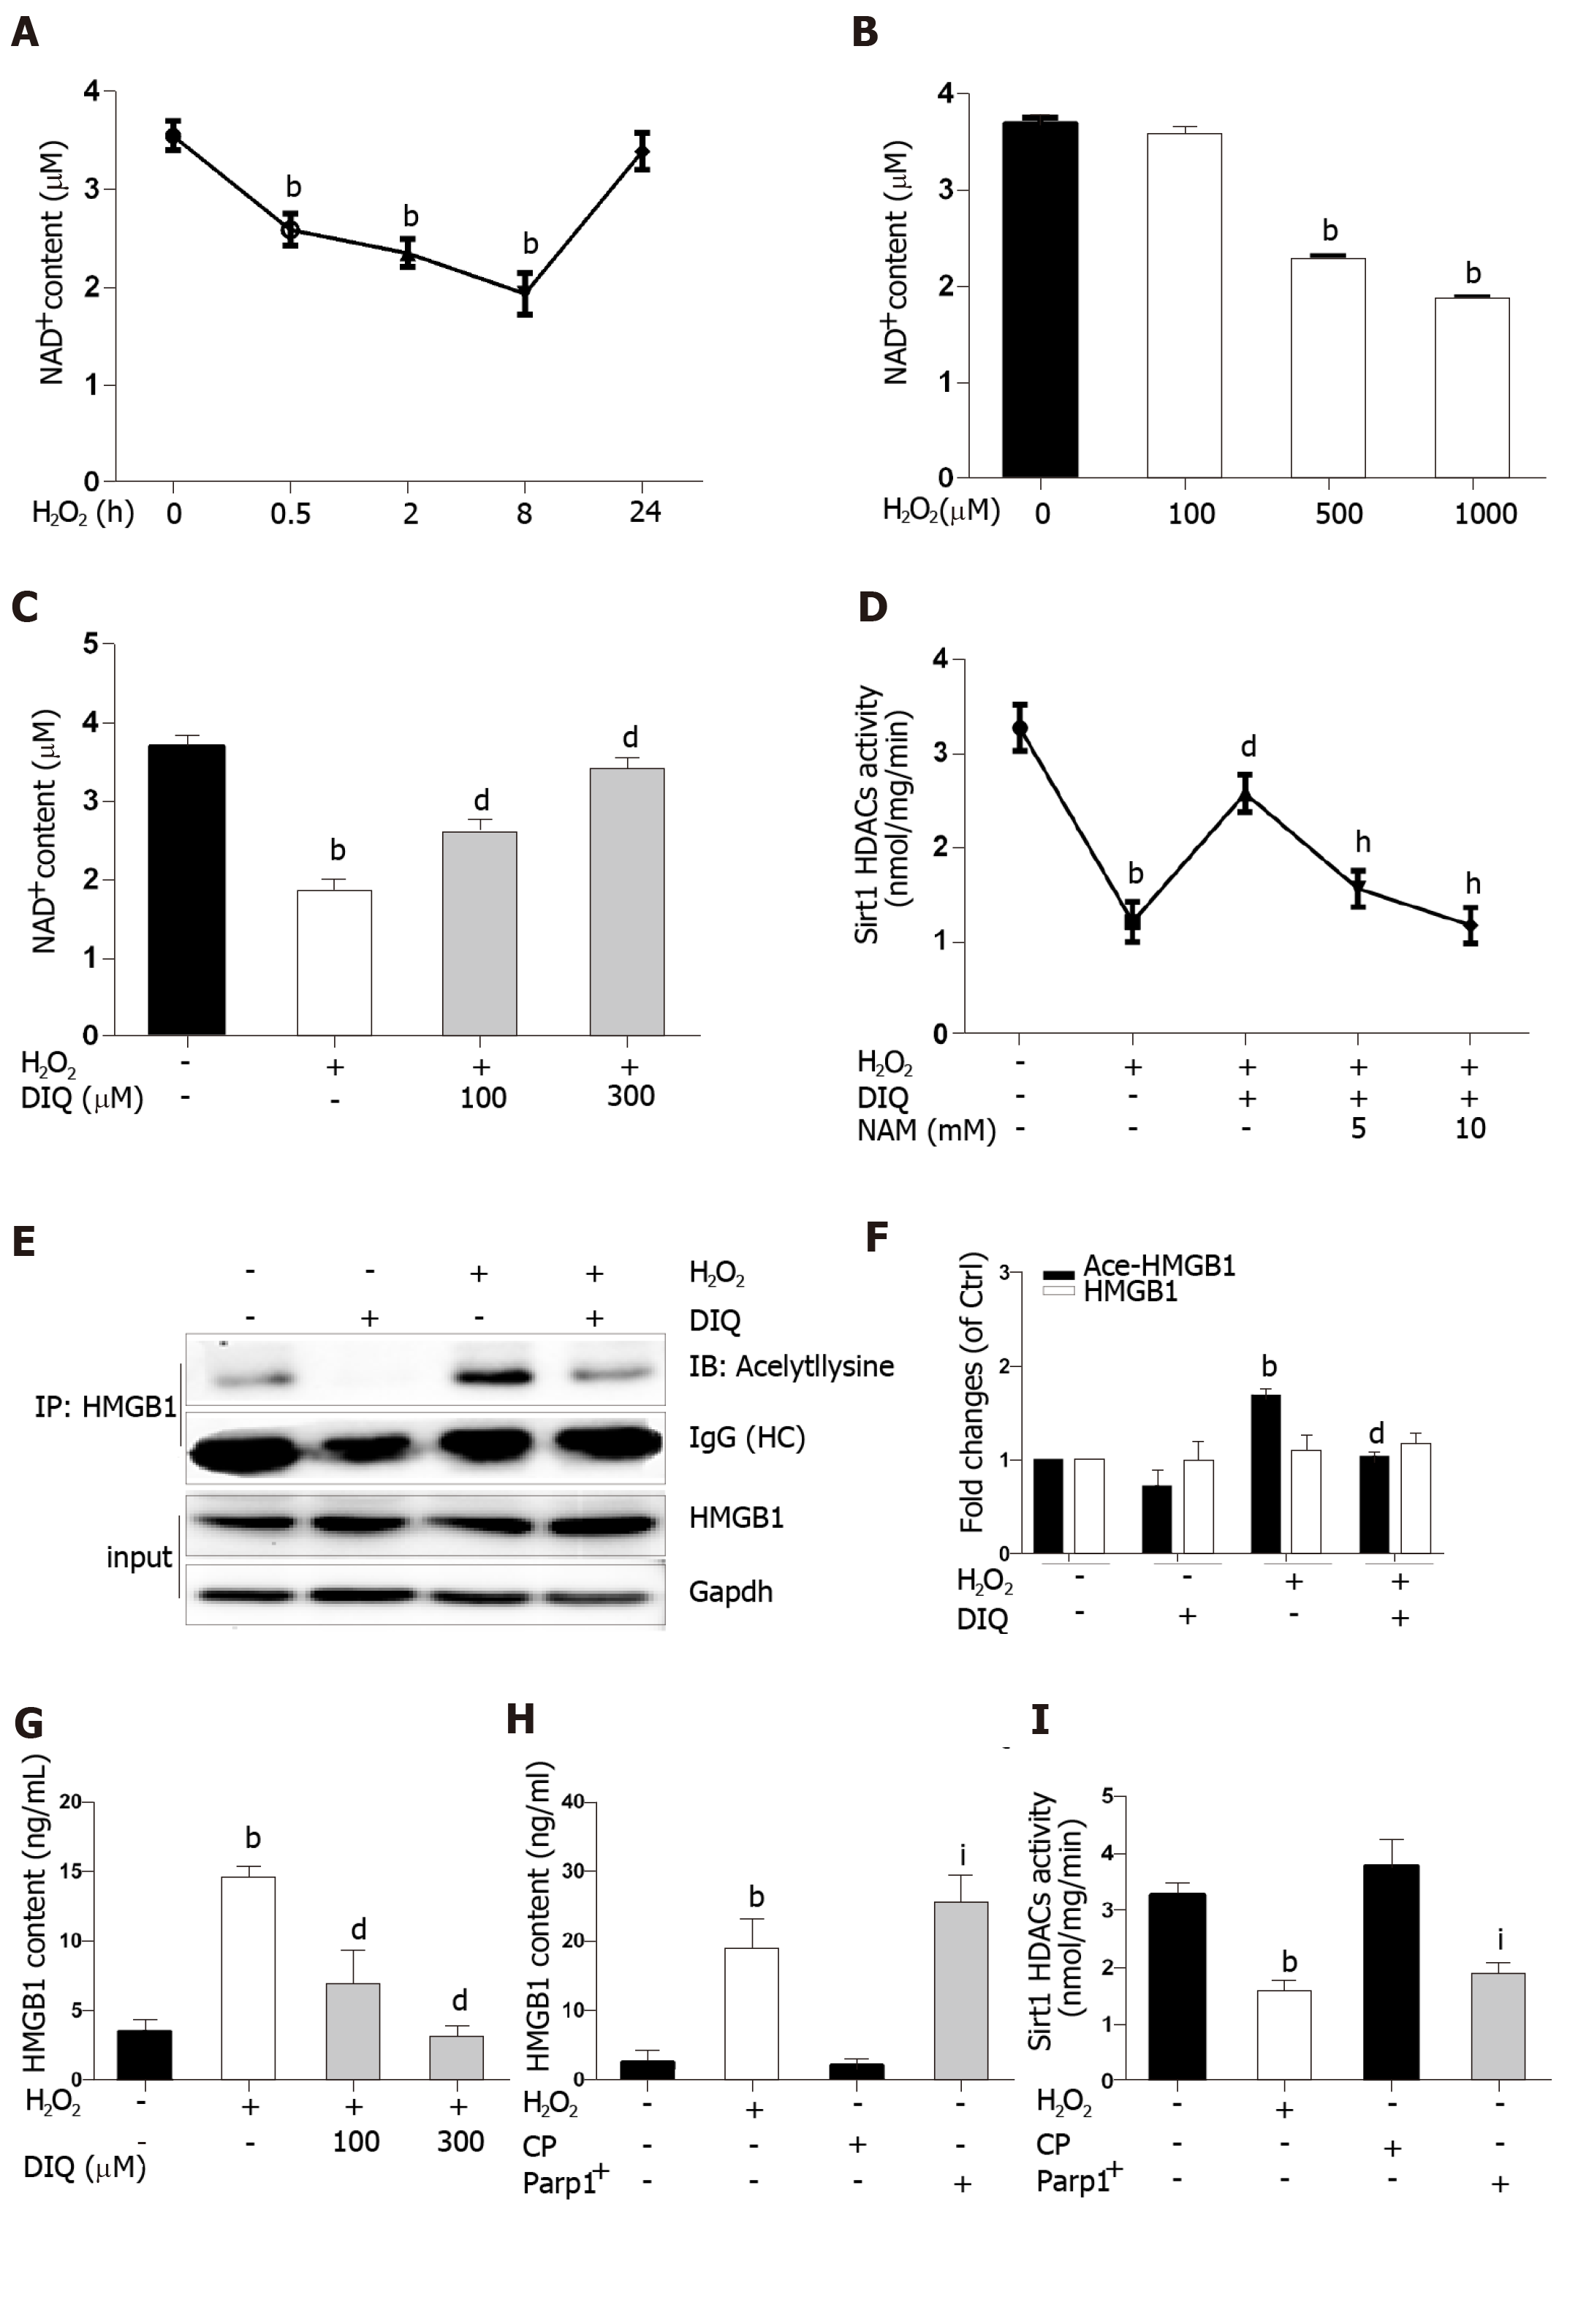
Because the same substrate of NAD+ is shared, Parp1 and Sirt1 are functionally connected. We first determined the effect of H2O2 and DIQ (1,5-dihydroxyisoquinoline), a competitive inhibitor of Parp1, on NAD+ levels. The NAD+ levels decreased from 0.5 h and reached approximately 50% inhibition at 8 h, then restored 24 h after cells were treated with H2O2 (Figure 6A). Likewise, the NAD+ levels were also inhibited in a dose-dependent manner after H2O2 treatment (Figure 6B). Furthermore, we examined the effect of DIQ on NAD+ levels. As expected, the NAD+ levels decreased approximately 50% from the control after H2O2 treatment at 8 h, however, when the cells were pretreated with 100 μmol/L DIQ, the NAD+ levels were restored to approximately 70% of control, and pretreatment with 300 μmol/L DIQ reversed the NAD+ levels to over 90% of control (Figure 6C). Next, the effect of Parp1 inhibition on Sirt1 activity was assessed. Cells pretreated with DIQ demonstrated an increase in Sirt1 activity as compared with cells treated with H2O2 alone (Figure 6D). To further investigate whether the effect of Parp1 inhibition on Sirt1 activity is related with its dependence on NAD+ concentration, NAM, a noncompetitive inhibitor of Sirt1, was employed. Cells pretreated with DIQ and then exposed to H2O2 demonstrated an increase in Sirt1 activity, while cells pretreated with both DIQ and NAM (5 mmol/L and 10 mmol/L, respectively) failed to exhibit an increase in Sirt1 activity (Figure 6D). These findings verified the importance of NAD+ in mediating sirt1 activity through Parp1 inhibition.
Hyperacetylation status of HMGB1 is a vital step prior to its release. In our experiments, the immunoprecipitated nuclear lysates were incubated with antibodies against HMGB1, and then immunoblotted with acetyl lysine antibodies. As shown in Figure 6E, DIQ pretreatment alone had no appreciable effect (Figure 6E, panel 2). Cells incubated with H2O2 demonstrated an increase in acetylated HMGB1 compared with untreated cells. Moreover, cells incubated with both DIQ and H2O2 demonstrated a significant inhibition of acetylation of HMGB1 (Figure 6E and F). Then, when we investigated the effect of Parp1 inhibition on H2O2-induced HMGB1 release, the results showed that HMGB1 release was significantly increased when cells were treated with H2O2, however, cells pretreated with DIQ (100 μmol/L, or 300 μmol/L) had a significant decrease (Figure 6G). In contrast, we overexpressed Parp1 in cells to investigate Sirt1 enzyme activities and HMGB1 release. As shown in Figure 6H and I, Parp1 overexpression not only suppressed Sirt1 activities, but also promoted HMGB1 release, which is similar to the results with H2O2 treatment.
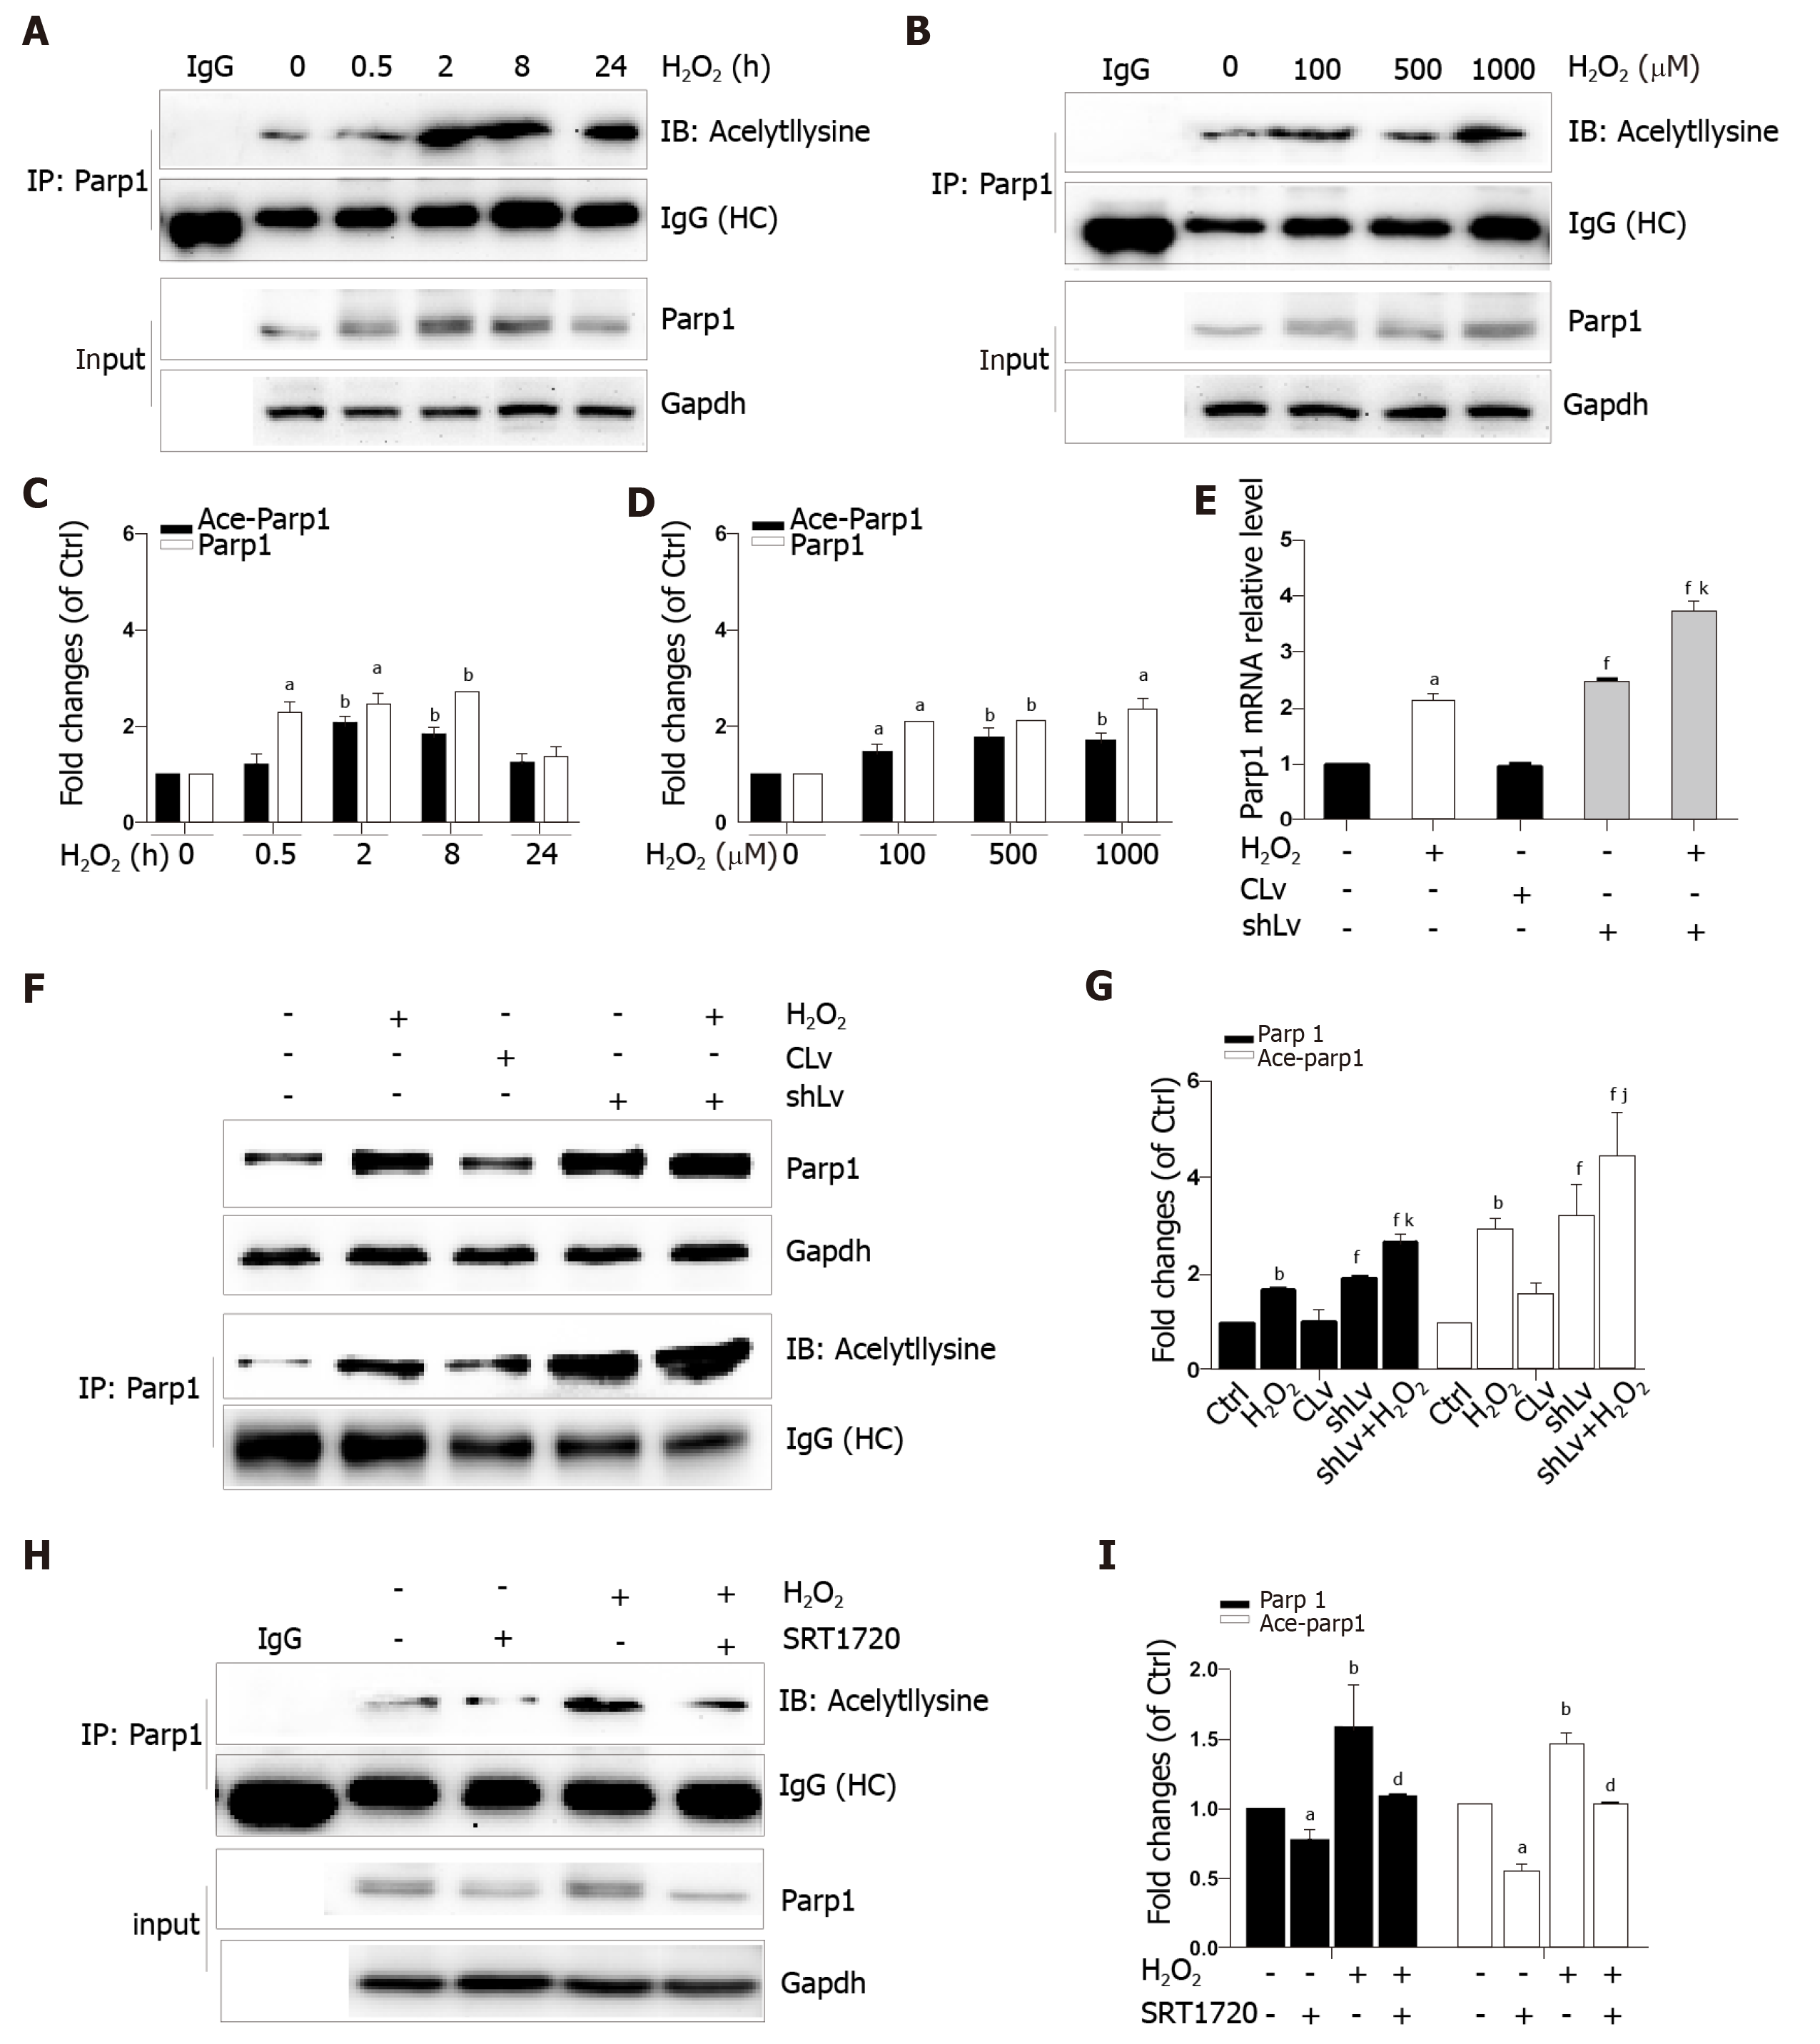
Parp1 is a nuclear protein involved in oxidative stress-induced DNA repair and chromatin remodeling. To examine whether Parp1 is responsive to oxidative stress in hepatocytes, we subjected cells to H2O2 for different times and concentrations, and the results showed that both parp1 and acetylated parp1 protein levels increased in a time- and dose-dependent manner (Figure 7A-D). To preserve cellular NAD+ levels and thus retain its own function, Sirt1 may deactivate Parp1 by deacetylation of Parp1. Besides this, Sirt1 is able to negatively regulate the PARP1 promoter[23]. We therefore hypothesized that a decrease in Sirt1 in cells with H2O2-induced DNA damage would increase Parp1 and its acetylation levels. To test this hypothesis, we examined the mRNA and protein levels of Parp1 levels and its acetylation status in Sirt1 knockdown cells. Coinciding with our expectation, both the mRNA and protein levels of Parp1 levels and its acetylation status were significantly increased, which are in keeping with the results of H2O2 treatment (Figure 7E-G). To further confirm these findings, cells were exposed to a Sirt1 activator, SRT1720. We also found that Parp1 protein levels and its acetylation status were decreased after incubation with SRT1720 alone or SRT1720 plus H2O2 (Figure 7H and I).
Oxidative stress is one of the main mechanisms of either HFD or ethanol-induced liver injury[24,25]. Alcohol and HFD consumption are known to synergistically induce hepatocytes damage and steatohepatitis[26]. Our in vivo experiments verified that hepatocytes injury and steatosis accompanied with oxidative stress appeared after feeding mice with an HFD for 3 mo plus a single binge of ethanol. HMGB1 released outside the cell was highly acetylated[20] and was related with exposure of hepatocytes to oxidative stress[27]. ROS plays a critical role in the induction of HMGB1 release[28]. The similar finding from this study was that both mice fed an HFD/etOH and H2O2-treated hepatocytes exacerbated the release of HMGB1 that was highly acetylated.
Posttranslational modifications play a role in HMGB1 localization. Our previous study found that hyperphosphorylation of HMGB1 has been implicated in its nuclear-to-cytoplasmic translocation[29]. Recent studies on HMGB1 release identified that the decreased activity of SIRT1, an NAD+-dependent histone deacetylase, which is especially predominant in the nucleus, is critical for HMGB1 hyperacetylation[6]. SIRT1 is also involved in both non-alcoholic fatty liver diseases and alcoholic fatty liver disease[30]. In the present study, we observed that HMGB1 translocation from the nucleus to the cytoplasm and the subsequent release were accompanied by time- and dose-dependent hyperacetylation in H2O2-induced hepatocytes. Similarly, the Sirt1 protein levels and activity also acted in a time- and dose-dependent manner. Furthermore, we demonstrated that either SIRT1 shRNA or EX527, a specific SIRT1 inhibitor, promoted HMGB1 hyperacetylation and subsequent release. On the contrary, SRT1720, a SIRT1 activator suppressed HMGB1 release. A parallel change of Sirt1 decrease and HMGB1 hyperacetylation and subsequent translocation from the nucleus to cytoplasm to outside the cell in either mice fed an HFD/etOH or hepatocytes treated with H2O2 confirmed that Sirt1 plays a key role in HMGB1 release.
Sirt1 and Parp1 are two enzymes functionally connected due to their use of the common substrate NAD+[7]. Parp1 was shown to have a greater effect on NAD+-depletion than Sirt1[31]. Rapid depletion of NAD+ levels by Parp1 inhibits Sirt1 activity and the capability of Sirt1 to deacetylate its targets responding to genotoxic stress[9]. We demonstrated that NAD+ content in H2O2 treated cells decreased in a time- and dose-dependent manner. Additionally, this phenomenon was observed with Parp1. Furthermore, DIQ, a specific Parp1 inhibitor, has antagonism for H2O2 and caused a rescue of NAD+levels and increased Sirt1 activity, followed by a reduction of HMGB1 release. On the contrary, overexpression of Parp1 has resulted in a decrease in Sirt1 activity and HMGB1 release. We verified that Sirt1 activity inhibition in H2O2-treated cells was due to overconsuming NAD+ by Parp1. Parp1 is a DNA damage sensor protein which binds to DNA strand, breaks efficiently, and uses NAD+ as a substrate to facilitate DNA repair[32,33]. 8-OHdG, a marker of oxidative stress to DNA, was observed to increase in our study, which supports our hypothesis that NAD+ may be overconsumed, in part, due to Parp1 activation caused by DNA damage led to sirt1 activity suppression.
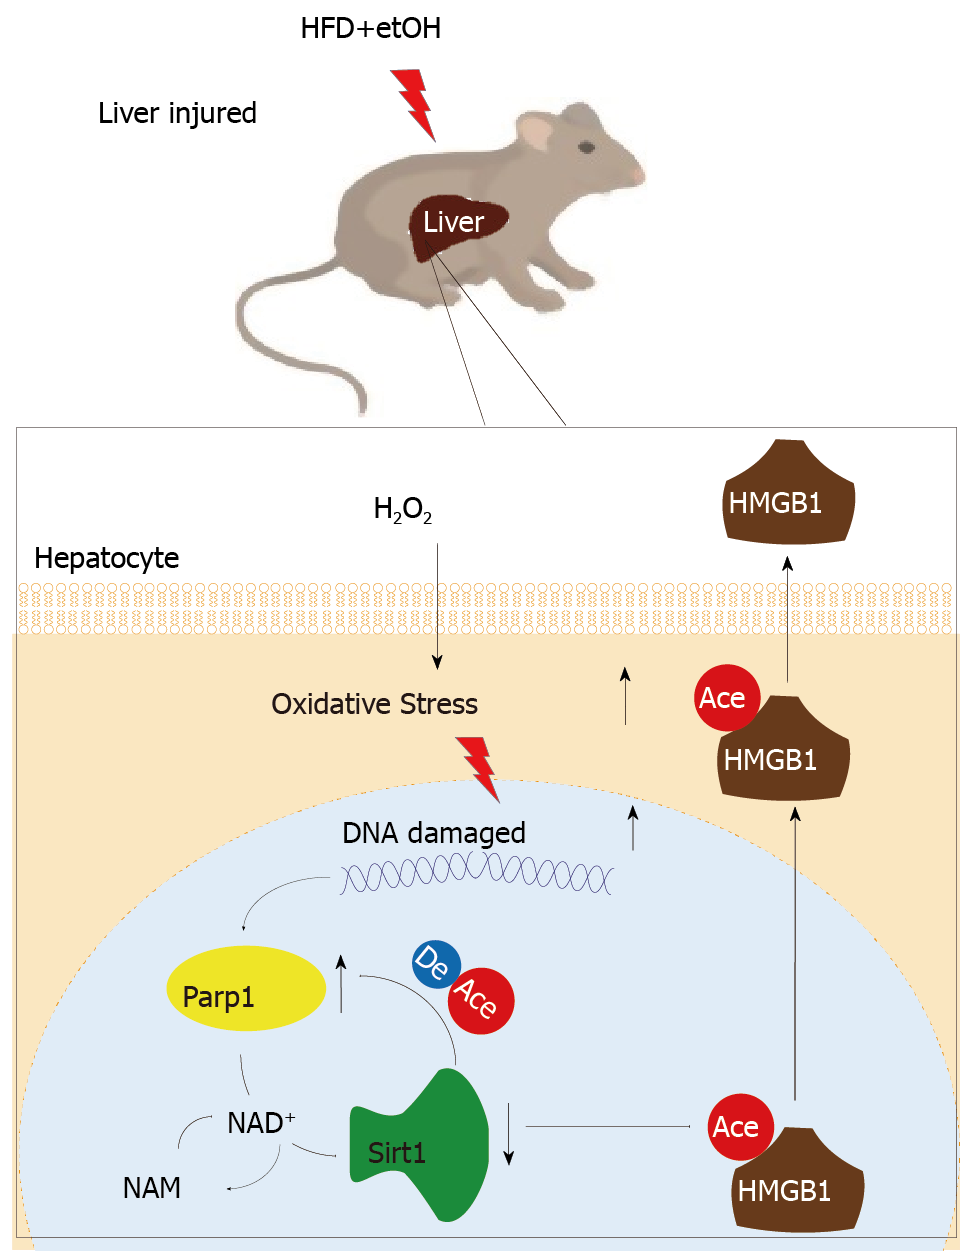
In addition that Parp1 negatively regulates Sirt1, Sirt1 may deactivate Parp1 to preserve cellular NAD+ levels and thus retain its own function. Sirt1 is able to negatively regulate the Parp1 promoter[34] and can deacetylate Parp1[35]. In accordance with these reports, our results obtained with the use of shRNA of Sirt1 indicated that the levels of both Parp1 mRNA and protein increased due to Parp1 hyperacetylation. The contrary results were revealed in cells with Sirt1 activator and SRT1720 treatment. In summary, our present study demonstrates that functional inhibition of Parp1 and Sirt1 in H2O2-induced hepatocytes is crucial for HMGB1 release outside the cell, thereby uncovering a new mechanism for HFD/etOH caused hepatic steatosis (Figure 8).
High mobility group box-1 (HMGB1) released by injured/dying cells becomes a key of damage-associated molecular patterns molecule to trigger inflammation responses leading to a series of tissue and organ damage, even diseases. But the details on how the injured hepatocytes released HMGB1 are to be elicited.
Hepatocytes are the most abundant cell type in the liver and the most easily attacked target, and loss of hepatocytes would contribute to various hepatic diseases. So, it is important to investigate the mechanism of HMGB1 release during hepatocyte injury or death.
To elicit HMGB1 release regulated by Sirt1 in injured/ dying hepatocytes, male C57BL/6J mice fed a high-fat diet (HFD) plus ethyl alcohol (etOH) were employed to assess the HMGB1 release and translocation from the nuclues to cytoplasm in injured hepatocytes. In vitro, mouse embryonic hepatocyte cell line BNL.CL2 incubated with H2O2 was further investigate the regulatory effect of Sirt1 on HMGB1 release. The main aim ofthis study was to understand HMGB1 release and its regulatory factors during hepatocyte injury/death, which would be a potential target for clinical therapy.
Male C57BL/6J mice were fed an HFD plus etOH to establish a model of hepatocytes injury/death. Meanwhile, mouse embryonic hepatocyte cell line BNL.CL2 was cultured in vitro and treated with H2O2. Serum ALT, liver H2O2 content and catalase activity, lactate dehydrogenase and 8-hydroxy-2-deoxyguanosine content, NAD+ levels, Sirt1 activity were detected by spectrophotometry. HMGB1 release was measured by ELISA and its translocation was detected by immunohistochemistry/immunofluorescence or Western blot. The mRNA and protein levels were assayed by qPCR and Western blot, respectively. Acetylated HMGB1 and Parp1 were analyzed by immunoprecipitation.
After treatment with an HFD plus etOH in vivo or H2O2in vitro toinduce hepatocyte injury, HMGB1 was translocated from the nucleus to the cytoplasm and passively released outside. This process occured because HMGB1 was hyperacetylated owing to both Sirt1 protein and activity suppression. After treatment with Sirt1-siRNA or Sirt1 inhibitor EX527, hyperacetylated HMGB1 increased (P < 0.01). Further, Sirt1 activity was suppressed by H2O2, which could be reversed by the Parp1 inhibitor DIQ (P < 0.01).
When hepatocytes injured/die, HMGB1 is translocated from the nucleus to the cytoplasm and finally released, which is related with hyperacetylated HMGB1 due to Sirt1 activity inhibition by NAD+ depletion caused by Parp1 overactivation.
The future research will focus on herbs affecting this process to investigate the recovery of injured hepatocyte.
Manuscript source: Unsolicited manuscript
Specialty type: Gastroenterology and hepatology
Country of origin: China
Peer-review report classification
Grade A (Excellent): 0
Grade B (Very good): 0
Grade C (Good): C, C
Grade D (Fair): D
Grade E (Poor): 0
P-Reviewer: Demonacos C, Karamouzis MV, Konishi H S-Editor: Yan JP L-Editor: Wang TQE-Editor: Qi LL
| 1. | Malarkey CS, Churchill ME. The high mobility group box: The ultimate utility player of a cell. Trends Biochem Sci. 2012;37:553-562. [RCA] [PubMed] [DOI] [Full Text] [Cited by in Crossref: 127] [Cited by in RCA: 164] [Article Influence: 12.6] [Reference Citation Analysis (0)] |
| 2. | Bertheloot D, Latz E. HMGB1, IL-1α, IL-33 and S100 proteins: Dual-function alarmins. Cell Mol Immunol. 2017;14:43-64. [RCA] [PubMed] [DOI] [Full Text] [Full Text (PDF)] [Cited by in Crossref: 265] [Cited by in RCA: 355] [Article Influence: 39.4] [Reference Citation Analysis (0)] |
| 3. | Zamora R, Barclay D, Yin J, Alonso EM, Leonis MA, Mi Q, Billiar TR, Simmons RL, Squires RH, Vodovotz Y. HMGB1 is a Central Driver of Dynamic Pro-inflammatory Networks in Pediatric Acute Liver Failure induced by Acetaminophen. Sci Rep. 2019;9:5971. [RCA] [PubMed] [DOI] [Full Text] [Full Text (PDF)] [Cited by in Crossref: 15] [Cited by in RCA: 13] [Article Influence: 2.2] [Reference Citation Analysis (0)] |
| 4. | Huebener P, Pradere JP, Hernandez C, Gwak GY, Caviglia JM, Mu X, Loike JD, Jenkins RE, Antoine DJ, Schwabe RF. The HMGB1/RAGE axis triggers neutrophil-mediated injury amplification following necrosis. J Clin Invest. 2019;130:1802. [RCA] [PubMed] [DOI] [Full Text] [Cited by in Crossref: 7] [Cited by in RCA: 20] [Article Influence: 3.3] [Reference Citation Analysis (0)] |
| 5. | Bonaldi T, Talamo F, Scaffidi P, Ferrera D, Porto A, Bachi A, Rubartelli A, Agresti A, Bianchi ME. Monocytic cells hyperacetylate chromatin protein HMGB1 to redirect it towards secretion. EMBO J. 2003;22:5551-5560. [RCA] [PubMed] [DOI] [Full Text] [Cited by in Crossref: 950] [Cited by in RCA: 1019] [Article Influence: 46.3] [Reference Citation Analysis (0)] |
| 6. | Rabadi MM, Xavier S, Vasko R, Kaur K, Goligorksy MS, Ratliff BB. High-mobility group box 1 is a novel deacetylation target of Sirtuin1. Kidney Int. 2015;87:95-108. [RCA] [PubMed] [DOI] [Full Text] [Full Text (PDF)] [Cited by in Crossref: 80] [Cited by in RCA: 114] [Article Influence: 10.4] [Reference Citation Analysis (0)] |
| 7. | Luna A, Aladjem MI, Kohn KW. SIRT1/PARP1 crosstalk: Connecting DNA damage and metabolism. Genome Integr. 2013;4:6. [RCA] [PubMed] [DOI] [Full Text] [Full Text (PDF)] [Cited by in Crossref: 67] [Cited by in RCA: 79] [Article Influence: 6.6] [Reference Citation Analysis (0)] |
| 8. | Walko TD, Di Caro V, Piganelli J, Billiar TR, Clark RS, Aneja RK. Poly(ADP-ribose) polymerase 1-sirtuin 1 functional interplay regulates LPS-mediated high mobility group box 1 secretion. Mol Med. 2015;20:612-624. [RCA] [PubMed] [DOI] [Full Text] [Cited by in Crossref: 15] [Cited by in RCA: 27] [Article Influence: 2.7] [Reference Citation Analysis (0)] |
| 9. | Pillai JB, Isbatan A, Imai S, Gupta MP. Poly(ADP-ribose) polymerase-1-dependent cardiac myocyte cell death during heart failure is mediated by NAD+ depletion and reduced Sir2alpha deacetylase activity. J Biol Chem. 2005;280:43121-43130. [RCA] [PubMed] [DOI] [Full Text] [Cited by in Crossref: 302] [Cited by in RCA: 332] [Article Influence: 16.6] [Reference Citation Analysis (0)] |
| 10. | Wang C, Zhang F, Wang L, Zhang Y, Li X, Huang K, Du M, Liu F, Huang S, Guan Y, Huang D, Huang K. Poly(ADP-ribose) polymerase 1 promotes oxidative-stress-induced liver cell death via suppressing farnesoid X receptor α. Mol Cell Biol. 2013;33:4492-4503. [RCA] [PubMed] [DOI] [Full Text] [Cited by in Crossref: 24] [Cited by in RCA: 30] [Article Influence: 2.5] [Reference Citation Analysis (0)] |
| 11. | Huang H, Nace GW, McDonald KA, Tai S, Klune JR, Rosborough BR, Ding Q, Loughran P, Zhu X, Beer-Stolz D, Chang EB, Billiar T, Tsung A. Hepatocyte-specific high-mobility group box 1 deletion worsens the injury in liver ischemia/reperfusion: A role for intracellular high-mobility group box 1 in cellular protection. Hepatology. 2014;59:1984-1997. [RCA] [PubMed] [DOI] [Full Text] [Cited by in Crossref: 105] [Cited by in RCA: 214] [Article Influence: 19.5] [Reference Citation Analysis (0)] |
| 12. | Jang J, Huh YJ, Cho HJ, Lee B, Park J, Hwang DY, Kim DW. SIRT1 Enhances the Survival of Human Embryonic Stem Cells by Promoting DNA Repair. Stem Cell Reports. 2017;9:629-641. [RCA] [PubMed] [DOI] [Full Text] [Full Text (PDF)] [Cited by in Crossref: 43] [Cited by in RCA: 51] [Article Influence: 6.4] [Reference Citation Analysis (0)] |
| 13. | Xie J, Zhou X, Hu X, Jiang H. H2O2 evokes injury of cardiomyocytes through upregulating HMGB1. Hellenic J Cardiol. 2014;55:101-106. [PubMed] |
| 14. | Vazquez EJ, Berthiaume JM, Kamath V, Achike O, Buchanan E, Montano MM, Chandler MP, Miyagi M, Rosca MG. Mitochondrial complex I defect and increased fatty acid oxidation enhance protein lysine acetylation in the diabetic heart. Cardiovasc Res. 2015;107:453-465. [RCA] [PubMed] [DOI] [Full Text] [Cited by in Crossref: 63] [Cited by in RCA: 73] [Article Influence: 7.3] [Reference Citation Analysis (0)] |
| 15. | Zeng T, Guo FF, Zhang CL, Zhao S, Dou DD, Gao XC, Xie KQ. The anti-fatty liver effects of garlic oil on acute ethanol-exposed mice. Chem Biol Interact. 2008;176:234-242. [RCA] [PubMed] [DOI] [Full Text] [Cited by in Crossref: 57] [Cited by in RCA: 52] [Article Influence: 3.1] [Reference Citation Analysis (0)] |
| 16. | Dąbrowska N, Wiczkowski A. Analytics of oxidative stress markers in the early diagnosis of oxygen DNA damage. Adv Clin Exp Med. 2017;26:155-166. [RCA] [PubMed] [DOI] [Full Text] [Cited by in Crossref: 33] [Cited by in RCA: 46] [Article Influence: 5.8] [Reference Citation Analysis (0)] |
| 17. | Samuni Y, Goldstein S, Dean OM, Berk M. The chemistry and biological activities of N-acetylcysteine. Biochim Biophys Acta. 2013;1830:4117-4129. [RCA] [PubMed] [DOI] [Full Text] [Cited by in Crossref: 471] [Cited by in RCA: 592] [Article Influence: 49.3] [Reference Citation Analysis (0)] |
| 18. | Ding J, Cui X, Liu Q. Emerging role of HMGB1 in lung diseases: Friend or foe. J Cell Mol Med. 2017;21:1046-1057. [RCA] [PubMed] [DOI] [Full Text] [Full Text (PDF)] [Cited by in Crossref: 48] [Cited by in RCA: 72] [Article Influence: 8.0] [Reference Citation Analysis (0)] |
| 19. | Gao E, Jiang Y, Li Z, Xue D, Zhang W. Association between high mobility group box‑1 protein expression and cell death in acute pancreatitis. Mol Med Rep. 2017;15:4021-4026. [RCA] [PubMed] [DOI] [Full Text] [Full Text (PDF)] [Cited by in Crossref: 10] [Cited by in RCA: 13] [Article Influence: 1.6] [Reference Citation Analysis (0)] |
| 20. | Yang H, Antoine DJ, Andersson U, Tracey KJ. The many faces of HMGB1: Molecular structure-functional activity in inflammation, apoptosis, and chemotaxis. J Leukoc Biol. 2013;93:865-873. [RCA] [PubMed] [DOI] [Full Text] [Cited by in Crossref: 385] [Cited by in RCA: 431] [Article Influence: 35.9] [Reference Citation Analysis (0)] |
| 21. | Tsung A, Klune JR, Zhang X, Jeyabalan G, Cao Z, Peng X, Stolz DB, Geller DA, Rosengart MR, Billiar TR. HMGB1 release induced by liver ischemia involves Toll-like receptor 4 dependent reactive oxygen species production and calcium-mediated signaling. J Exp Med. 2007;204:2913-2923. [RCA] [PubMed] [DOI] [Full Text] [Full Text (PDF)] [Cited by in Crossref: 455] [Cited by in RCA: 513] [Article Influence: 28.5] [Reference Citation Analysis (0)] |
| 22. | Kim DI, Park MJ, Choi JH, Kim IS, Han HJ, Yoon KC, Park SW, Lee MY, Oh KS, Park SH. PRMT1 and PRMT4 Regulate Oxidative Stress-Induced Retinal Pigment Epithelial Cell Damage in SIRT1-Dependent and SIRT1-Independent Manners. Oxid Med Cell Longev. 2015;2015:617919. [RCA] [PubMed] [DOI] [Full Text] [Full Text (PDF)] [Cited by in Crossref: 25] [Cited by in RCA: 36] [Article Influence: 3.6] [Reference Citation Analysis (0)] |
| 23. | Lou PH, Lucchinetti E, Scott KY, Huang Y, Gandhi M, Hersberger M, Clanachan AS, Lemieux H, Zaugg M. Alterations in fatty acid metabolism and sirtuin signaling characterize early type-2 diabetic hearts of fructose-fed rats. Physiol Rep. 2017;5:pii: e13388. [RCA] [PubMed] [DOI] [Full Text] [Full Text (PDF)] [Cited by in Crossref: 16] [Cited by in RCA: 26] [Article Influence: 3.7] [Reference Citation Analysis (0)] |
| 24. | Warner DR, Liu H, Miller ME, Ramsden CE, Gao B, Feldstein AE, Schuster S, McClain CJ, Kirpich IA. Dietary Linoleic Acid and Its Oxidized Metabolites Exacerbate Liver Injury Caused by Ethanol via Induction of Hepatic Proinflammatory Response in Mice. Am J Pathol. 2017;187:2232-2245. [RCA] [PubMed] [DOI] [Full Text] [Cited by in Crossref: 41] [Cited by in RCA: 59] [Article Influence: 7.4] [Reference Citation Analysis (0)] |
| 25. | Geng C, Xu H, Zhang Y, Gao Y, Li M, Liu X, Gao M, Wang X, Liu X, Fang F, Chang Y. Retinoic acid ameliorates high-fat diet-induced liver steatosis through sirt1. Sci China Life Sci. 2017;60:1234-1241. [RCA] [PubMed] [DOI] [Full Text] [Cited by in Crossref: 17] [Cited by in RCA: 37] [Article Influence: 4.6] [Reference Citation Analysis (0)] |
| 26. | Chang B, Xu MJ, Zhou Z, Cai Y, Li M, Wang W, Feng D, Bertola A, Wang H, Kunos G, Gao B. Short- or long-term high-fat diet feeding plus acute ethanol binge synergistically induce acute liver injury in mice: An important role for CXCL1. Hepatology. 2015;62:1070-1085. [RCA] [PubMed] [DOI] [Full Text] [Cited by in Crossref: 119] [Cited by in RCA: 174] [Article Influence: 17.4] [Reference Citation Analysis (0)] |
| 27. | Yang M, Antoine DJ, Weemhoff JL, Jenkins RE, Farhood A, Park BK, Jaeschke H. Biomarkers distinguish apoptotic and necrotic cell death during hepatic ischemia/reperfusion injury in mice. Liver Transpl. 2014;20:1372-1382. [RCA] [PubMed] [DOI] [Full Text] [Cited by in Crossref: 68] [Cited by in RCA: 73] [Article Influence: 6.6] [Reference Citation Analysis (0)] |
| 28. | Yu Y, Tang D, Kang R. Oxidative stress-mediated HMGB1 biology. Front Physiol. 2015;6:93. [RCA] [PubMed] [DOI] [Full Text] [Full Text (PDF)] [Cited by in Crossref: 138] [Cited by in RCA: 198] [Article Influence: 19.8] [Reference Citation Analysis (0)] |
| 29. | Zhao P, Ye T, Yan X, Hu X, Liu P, Wang X. HMGB1 release by H2O2-induced hepatocytes is regulated through calcium overload and 58-F interference. Cell Death Discov. 2017;3:17008. [RCA] [PubMed] [DOI] [Full Text] [Full Text (PDF)] [Cited by in Crossref: 9] [Cited by in RCA: 14] [Article Influence: 1.8] [Reference Citation Analysis (0)] |
| 30. | Ding RB, Bao J, Deng CX. Emerging roles of SIRT1 in fatty liver diseases. Int J Biol Sci. 2017;13:852-867. [RCA] [PubMed] [DOI] [Full Text] [Full Text (PDF)] [Cited by in Crossref: 160] [Cited by in RCA: 260] [Article Influence: 32.5] [Reference Citation Analysis (0)] |
| 31. | Pittelli M, Formentini L, Faraco G, Lapucci A, Rapizzi E, Cialdai F, Romano G, Moneti G, Moroni F, Chiarugi A. Inhibition of nicotinamide phosphoribosyltransferase: Cellular bioenergetics reveals a mitochondrial insensitive NAD pool. J Biol Chem. 2010;285:34106-34114. [RCA] [PubMed] [DOI] [Full Text] [Cited by in Crossref: 133] [Cited by in RCA: 153] [Article Influence: 10.2] [Reference Citation Analysis (0)] |
| 32. | Robu M, Shah RG, Purohit NK, Zhou P, Naegeli H, Shah GM. Poly(ADP-ribose) polymerase 1 escorts XPC to UV-induced DNA lesions during nucleotide excision repair. Proc Natl Acad Sci U S A. 2017;114:E6847-E6856. [RCA] [PubMed] [DOI] [Full Text] [Cited by in Crossref: 33] [Cited by in RCA: 41] [Article Influence: 5.1] [Reference Citation Analysis (0)] |
| 33. | Hanzlikova H, Kalasova I, Demin AA, Pennicott LE, Cihlarova Z, Caldecott KW. The Importance of Poly(ADP-Ribose) Polymerase as a Sensor of Unligated Okazaki Fragments during DNA Replication. Mol Cell. 2018;71:319-331.e3. [RCA] [PubMed] [DOI] [Full Text] [Full Text (PDF)] [Cited by in Crossref: 245] [Cited by in RCA: 289] [Article Influence: 41.3] [Reference Citation Analysis (0)] |
| 34. | Rajamohan SB, Pillai VB, Gupta M, Sundaresan NR, Birukov KG, Samant S, Hottiger MO, Gupta MP. SIRT1 promotes cell survival under stress by deacetylation-dependent deactivation of poly(ADP-ribose) polymerase 1. Mol Cell Biol. 2009;29:4116-4129. [RCA] [PubMed] [DOI] [Full Text] [Cited by in Crossref: 213] [Cited by in RCA: 245] [Article Influence: 15.3] [Reference Citation Analysis (0)] |
| 35. | Cantó C, Sauve AA, Bai P. Crosstalk between poly(ADP-ribose) polymerase and sirtuin enzymes. Mol Aspects Med. 2013;34:1168-1201. [RCA] [PubMed] [DOI] [Full Text] [Cited by in Crossref: 160] [Cited by in RCA: 187] [Article Influence: 15.6] [Reference Citation Analysis (0)] |


