Copyright
©The Author(s) 2016.
World J Gastroenterol. Dec 14, 2016; 22(46): 10158-10165
Published online Dec 14, 2016. doi: 10.3748/wjg.v22.i46.10158
Published online Dec 14, 2016. doi: 10.3748/wjg.v22.i46.10158
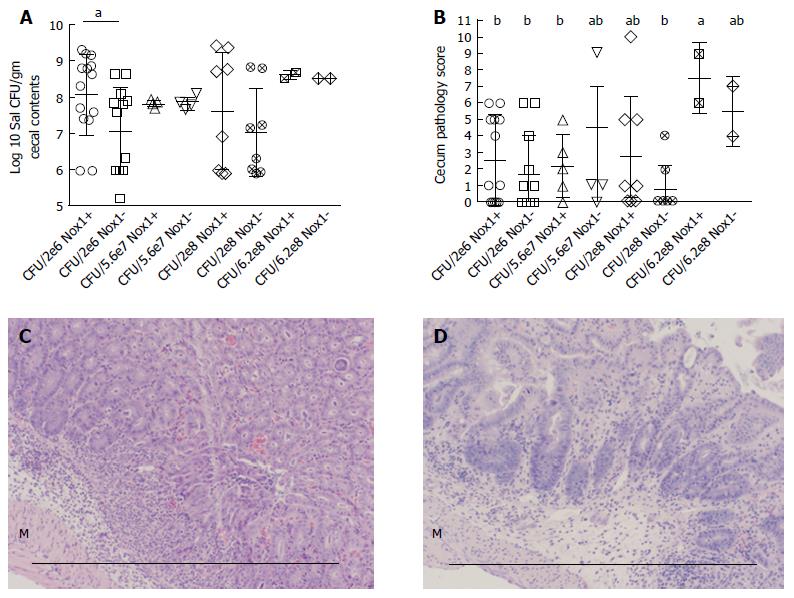
Figure 1 The CFU and pathology in the cecum between Nox1-knockout and wild-type mice with 4 different doses of S.
Tm. A: Scatter plot of log10 transformed S. Tm CFU per gram recovered from cecal contents from WT (Nox1+) and Nox1-KO mice inoculated with 2 × 10⁶, 5.6 × 10⁷, 2 × 10⁸ and 6.2 × 10⁸ of S. Tm. The contents were plated so that 1 colony would yield a count ≥ 1 × 10⁶ CFU/g. Zero colonies were assigned to 1 × 10⁶ to include all mice analyzed in the panel. “a” indicates a significant difference between the Nox1 and WT groups treated with 2 × 10⁶ S. Tm (colon-P = 0.0068; cecum-P = 0.0098); B: Scatter plot of pathology scores of mice from the groups shown in A. The groups with different letter designations in each figure are different, where a > b (α = 0.05). The groups sharing a same letter are not different; e.g., ab is not different from a or b group. Horizontal bars indicate mean ± SD; C, D: Show the worst pathology identified in Nox1-KO and WT cecum, respectively (score = 6), for mice inoculated with the lowest (2 × 10⁶) CFU. Both groups show edema and infiltration between the muscular layers (M) and the glands. The glands are devoid of goblet cells and generally distorted. Scale bars are approximately 0.5 mm. Nox1-KO: Nox1-knockout; WT: Wild-type.
- Citation: Chu FF, Esworthy RS, Doroshow JH, Shen B. NADPH oxidase-1 deficiency offers little protection in Salmonella typhimurium-induced typhlitis in mice. World J Gastroenterol 2016; 22(46): 10158-10165
- URL: https://www.wjgnet.com/1007-9327/full/v22/i46/10158.htm
- DOI: https://dx.doi.org/10.3748/wjg.v22.i46.10158


