Published online May 21, 2015. doi: 10.3748/wjg.v21.i19.5831
Peer-review started: October 6, 2014
First decision: November 26, 2014
Revised: January 1, 2015
Accepted: March 27, 2015
Article in press: March 27, 2015
Published online: May 21, 2015
Processing time: 227 Days and 0.7 Hours
AIM: To investigate the performance of Gadofluorine P-enhanced magnetic resonance imaging (MRI) on the diagnosis of diabetes in a streptozotocin (STZ) -induced diabetic rat model.
METHODS: Fischer 344 rats were treated with STZ. Rats not treated with STZ served as controls. T1-weighted MRI was performed using a 3T scanner before and after the injection of Gd-DOTA or Gadofluorine P (6 diabetic rats, 5 controls). The normalized signal intensity (SI) and the enhancement ratio (ER) of the pancreas were measured at each time point, and the values were compared between the normal and diabetic rats using the Mann-Whitney test. In addition, the values were correlated with the mean islet number. Optimal cut-off values were calculated using a positive test based on receiver operating characteristics. Intrapancreatic Gd concentration after the injection of each contrast media was measured using laser ablation-inductively coupled plasma-mass spectrometry in a separate set of rats (4 diabetic rats, 4 controls for Gadofluorine P; 2, 2 for Gd-DOTA).
RESULTS: The normalized SI and ER of the pancreas using Gd-DOTA were not significantly different between diabetic rats and controls. With Gadofluorine P, the values were significantly higher in the diabetic rats than in the control rats 30 min after injection (P < 0.05). The area under the receiver operating characteristic curve that differentiated diabetic rats from the control group was greater for Gadofluorine P than for Gd-DOTA (0.967 vs 0.667, P = 0.085). An increase in normalized SI 30 min after Gadofluorine P was correlated with a decrease in the mean number of islets (r2 = 0.510, P = 0.014). Intra-pancreatic Gd was higher in rats with Gadofluorine P injection than Gd-DOTA injection (Gadofluorine P vs Gd-DOTA, 7.37 vs 0.00, P < 0.01). A significant difference in the concentration of intrapancreatic Gd was observed between the control and diabetic animals that were sacrificed 30 min after Gadofluorine P injection (control vs diabetic, 3.25 ng/g vs 10.55 ng/g, P < 0.05)
CONCLUSION: In this STZ-induced diabetes rat model, Gadofluorine P-enhanced MRI of the pancreas showed high accuracy in the diagnosis of diabetes.
Core tip: Early changes in type 1 diabetes involve islet microvasculature such that vascular permeability increases. We used noninvasive magnetic resonance imaging to image, in vivo, the vasculature of the pancreas in streptozotocin-induced diabetic rats using Gadofluorine P. We anticipate that with further development, this technique could diagnose type 1 diabetes early, as well as monitor vascular and islet changes noninvasively and quantitatively.
- Citation: Cho HR, Lee Y, Doble P, Bishop D, Hare D, Kim YJ, Kim KG, Jung HS, Park KS, Choi SH, Moon WK. Magnetic resonance imaging of the pancreas in streptozotocin-induced diabetic rats: Gadofluorine P and Gd-DOTA. World J Gastroenterol 2015; 21(19): 5831-5842
- URL: https://www.wjgnet.com/1007-9327/full/v21/i19/5831.htm
- DOI: https://dx.doi.org/10.3748/wjg.v21.i19.5831
Type 1 diabetes is an autoimmune disease characterized by the specific destruction of insulin-producing β-cells, which are located in the islets of Langerhans in the pancreas[1]. Pancreatic islets receive 10% to 20% of the blood flow of the pancreas despite accounting for only 1% to 2% of the pancreas by weight[2]. Accumulating evidence suggests that the vascular endothelium is of crucial importance for the development of type 1 diabetes. Increases in the vascular permeability of islet blood vessels in the pancreas during the development of type 1 diabetes have been described in animal models of spontaneous autoimmune diabetes[3,4]; alloxan-induced diabetes in mice[5]; and streptozotocin (STZ)-induced diabetes in rats[6] and mice[7,8]. Moreover, vascular swelling and increased vascular permeability precede insulitis in nonobese diabetic mice and in STZ-induced diabetes models[6-12]. Accordingly, pancreatic islet vascular dysfunction can represent an early and potentially predictive biomarker for the loss of β-cell mass.
We used Gadofluorine P (invivoContrast GmbH, Berlin, Germany)-enhanced magnetic resonance imaging (MRI) in a rat model of STZ-induced diabetes. Gadofluorine P is a gadolinium (Gd)-based T1 contrast agent; it is commercially available but not approved for clinical use[13]. We hypothesized that increased vascular permeability of the islets could be detected using long-circulating Gadofluorine P, which extravasates from leaky vessels into the surrounding tissue and binds to extracellular proteins. Thus, our purpose was to determine the diagnostic performance of Gadofluorine P-enhanced MRI of the pancreas in the diagnosis of diabetes in a STZ-induced diabetic rat model and to compare the results with an extracellular agent, Gd-DOTA (Dotarem®, Guerbet, Paris, France).
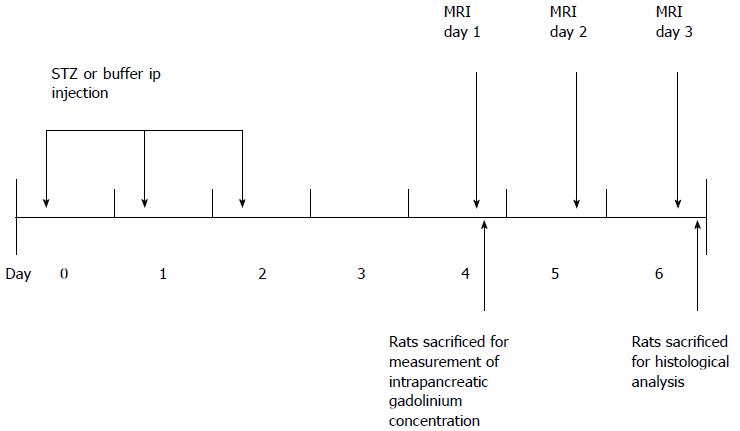
The experimental protocols were reviewed and approved by the Institutional Animal Care and Use Committee of Seoul National University Hospital (Number 11-0019). The animal protocol was designed to minimize pain or discomfort to the animals. Briefly, diabetic rats were given STZ for three consecutive days (day 0, 1, 2). MR was performed from day 4 to day 6. Blood glucose and weight were measured from day 0 to day 3. Eleven rats (6 diabetic rats, 5 control rats) that underwent MRI were euthanized on day 6 for histological analysis. Twelve rats (8 diabetic rats, 4 control rats) that were given each contrast media were euthanized on day 4 for measurement of intrapancreatic Gd concentrations using laser ablation-inductively coupled plasma-mass spectrometry (LA-ICP-MS). These rats did not undergo MRI (Figure 1).
The experiment was undertaken in female Fischer 344 rats from Charles River (Orient-Bio Inc., Seongnam, South Korea) weighing 140-210 g at 6-7 wk of age. For the insulin-dependent diabetic rat model, we used the multiple low-dose STZ model[14-16]. For three consecutive days, the diabetic rats received daily intraperitoneal injections of 15 mg/kg STZ (S0130-1G, Sigma-Aldrich Korea, Seoul, South Korea) dissolved in a citrate buffer (0.09 mol/L). For the control group, the rats received an equal volume of citrate buffer intraperitoneally.
Blood glucose concentrations were measured once a day using a commercial kit (BAROZEN®, Handok, South Korea) and blood obtained from the tail vein. On day 0, blood glucose levels were measured after 6 h of fasting, and after day 0, non-fasting blood glucose levels were measured. Hyperglycemia was defined as a blood glucose level ≥ 2 g/L in two consecutive measurements.
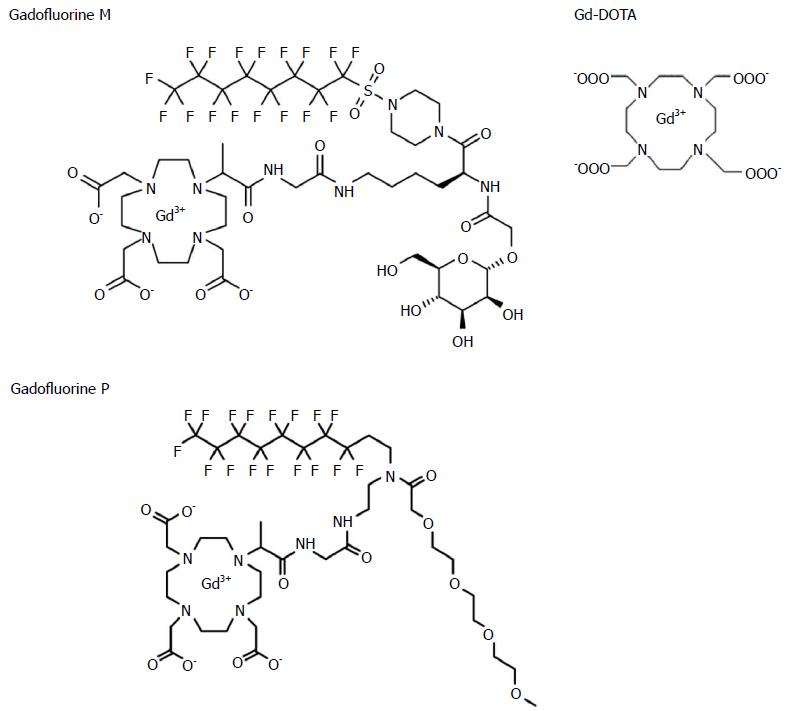
Gadofluorine P (molecular weight 1322 g/mol) is a daughter product of Gadofluorine M (Bayer Schering Pharma, Berlin, Germany) (molecular weight 1528 g/mol) with improved tolerability. Gadofluorine agents are amphiphilic gadolinium complexes, synthesized by adding a perfluoroctyl chain to a gadolinium-containing macrocycle (Figure 2)[13]; therefore, they form micelles in water. In blood or extracellular tissue, Gadofluorine agents strongly interact with hydrophobic proteins (e.g., albumin, extracellular matrix proteins), leading to a breakdown of the micelles[17,18]. After intravenous injection, Gadofluorine P also binds reversibly to plasma proteins and forms semi-stable, macromolecular Gadofluorine-protein complexes[19]. In 37 °C plasma, the R1 relaxation rate of Gadofluorine P at 1.41 T was about 17.5 mmol-1s-1[20]. The median lethal dose of Gadofluorine P is twice of that of Gadofluorine M and similar to that of Gd-DOTA (5 mmol/kg for Gadofluorine M; 12.5 for Gadofluorine P; and 11 for Gd-DOTA). Blood retention is shorter for Gadofluorine P than for Gadofluorine M. In rabbits, the plasma elimination half-life of Gadofluorine P is approximately 2 h, and Gadofluorine P is almost completely eliminated from blood/plasma within 24 h after intravenous injection[19]. In contrast, the plasma half-life of Gadfluorine M in rabbits is approximately 10 h[21,22]. In mice, contrast enhancement in the blood almost disappeared 6 h after the injection of Gadofluorine P, whereas it was 24 h for Gadofluorine M[23]. Gd-DOTA is a macrocyclic gadolinium paramagnetic complex with a molecular weight of approximately 558 g/mol (Figure 2)[24]. In 37 °C plasma, the R1 relaxation rates of Gd-DOTA at 1.5 T were approximately 3.5 mmol-1s-1[25]. Gd-DOTA is a first generation extracellular fluid space contrast MR agents. After intravenous injection, Gd-DOTA randomly distributes in intravascular and interstitial extracellular fluid spaces, and is eliminated rapidly through glomerular filtration in the kidney[26]. In rats, the biodistribution of Gd-DOTA has a distribution half-life of 3 min and an elimination half-life of 18 min[25,27].
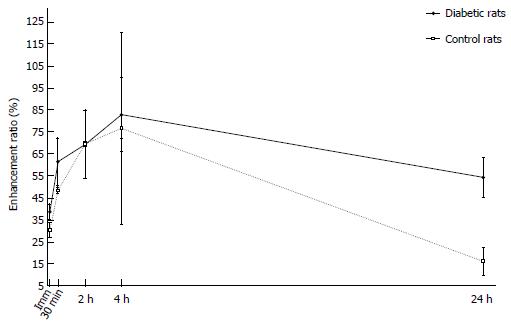
Before MRI acquisition, animals were sedated with an intramuscular injection of tiletamine hydrochloride with the sedative zolazepam hydrochloride at 30 mg/kg body weight (Zoletil®; Virbac, Carros, France) and xylazine hydrochloride (Rompun®; Bayer, Seoul, Korea) at 10 mg/kg body weight. We used a 3.0 T MRI scanner (Trio; Siemens, Erlangen, Germany) with a 4-channel wrist coil. On day 4, we obtained T1-weighted image (T1WI) before, immediately and 3 min after injection of Gd-DOTA (0.1 mmol/kg body weight). On day 5, we obtained T1WI data immediately and 30 min after Gadofluorine P injection (0.1 mmol/kg body weight). On day 6, we obtained T1WI data at 24 h after the injection of Gadofluorine P. Both contrast media injections were in the tail vein using an injection cap followed by flushing with 1 mL of normal saline. The 6 diabetic rats and the 5 controls underwent MRI for 3 d. We performed MRI first with Gd-DOTA and 24 h later with Gadofluorine P because the elimination half-life of Gd-DOTA is much shorter than that of Gadofluorine P[19,25]. The imaging time point for Gd-DOTA and Gadofluorine P was based on our time-intensity curve data (Figure 3) and data from other studies[13,23].
The rats were scanned in the supine position with no respiratory gating. A water phantom of normal saline was positioned alongside the body during the imaging of each rat. Transverse T1WI with a 3D gradient-echo sequence was obtained as follows: repetition time, 25 ms; echo time, 5.1 ms; flip angle, 25°; number of excitations, 2; slice thickness, 1 mm; FOV 100 mm × 50 mm; matrix 256 × 123; and spatial resolution, 0.39 mm × 0.41 mm × 1 mm. Transverse images obtained from the level of liver dome to the mid pole of the kidney to cover the entire pancreas.
For the time-intensity curve, four rats were used to generate a time-enhancement ratio curve pattern for Gadofluorine P (Separate rats from rats for MRI imaging, and measurement of intrapancreatic Gd concentrations using laser ablation-inductively coupled plasma-mass spectrometry). Two diabetic rats and two control rats underwent this MRI. The blood glucose level of both diabetic rats was greater than 2 g/L from day 1. In MR image analysis, the pancreas signal intensity was normalized to the paravertebral muscle. With Gadofluorine P, the mean enhancement ratio of the pancreas increased for 240 min, with a maximal difference in enhancement ratio between the groups at 30 min after Gadofluorine P injection (Figure 3). However, no significant difference was found at any time point for both contrast media.
The MR images were analyzed by a radiologist who was blinded to the group (control or diabetic) and the histological results. The MR data from each animal were processed with ImageJ (http://rsb.info.nih.gov/ij/) and a software program developed in-house (Y-J.K. and K.G.K.) using Visual C++ (Microsoft, Redmond, Wash). In each rat, regions of interest (ROIs) were drawn within the entire pancreas through consecutive transverse planes while avoiding surrounding structures including the stomach lumen, the caudate lobe of the liver and the spleen. The signal intensities (SIs) of the pancreata were normalized using the SIs of a water phantom (normalized SI of the pancreas = SI of the pancreas/SI of a water phantom). The mean value of the summation of consecutive ROIs was used for interpretation of the normalized SIs of the pancreas. The contrast enhancement ratio (ER) was calculated as follows: ER (%) = 100 × (normalized SIenhanced - normalized SIunenhanced)/normalized SIunenhanced, and the ER of the pancreas was calculated at each time point (e.g., immediately and 3 min after Gd-DOTA injection; and immediately, 30 min and 24 h after the Gadofluorine P injection).
After the acquisition of the MRIs (day 6), the pancreata (n = 11) were immediately removed and fixed in 10% buffered formalin. Paraffin-embedded pancreata were cut into 4-μm-thick sections and stained with hematoxylin and eosin (HE). The islet size and number were measured for statistical analysis. Slides were observed under a light microscope at magnification × 100 by a pathologist. Ten non-consecutive slides were chosen from each rat, and the islet size was measured using an Olympus DP70 digital microscope camera and its associated software (Olympus Corporation, Tokyo, Japan). The largest diameter of each islet was measured using a digital scale bar. The number of islets was determined as the mean number of islets in a field of 2.2 mm diameter at 100 × magnification. Three separate fields were viewed in each slide.
We measured Gd concentrations in 10 μm sections of the pancreas using laser ablation-inductively coupled plasma-mass spectrometry (LA-ICP-MS). The pancreas was sectioned on a coronal plane to cover the entire pancreas (head, body, tail); the representative section of the whole pancreas was used. On day 4, four diabetic rats and four control rats were euthanized 30 min after Gadofluorine P injection, and two diabetic rats and two control rats were sacrificed 3 min after Gd-DOTA injection. They did not undergo MRI.
We measured the intrapancreatic Gd levels of the rat in the diabetic and normal groups using LA-ICP-MS for pancreas sections. The analysis was performed using a New Wave Research NWR193 laser ablation instrument (Kennelec Technologies) fitted with a Large Format Cell. Argon was used as the carrier gas. The laser unit was hyphenated to an Agilent Technologies 7700s ICP-MS instrument fitted with a “cs” lens system, a platinum sampler, and skimmer cones. Prior to analysis, the system was tuned for sensitivity using a NIST 612 Trace element in glass and in-house-produced tissue standards. Oxide formation was controlled by limiting the amount of 248Th16O+/232Th+ to < 0.3% for the ablation of NIST 612.
Data were acquired by ablating adjacent lines down each specimen (10 μm thick) with a beam diameter of 50 m and a scan speed of 200 m/s. Mass spectrometer integration times were chosen in order to maintain the true image dimensions[28] when processed, such that a single pixel represented 50 (or is that 2500) m2. Variations in laser power output and instrument drift were compensated for through normalization to the 13C signal[29].
Quantitative data were produced through representative ablation of tissue standards, using a previously described method[30,31]. Briefly, chicken breast tissue was purchased from a local market and stripped of all fatty and connective tissue. Five-gram aliquots of dissected tissue were partially homogenized using an OmniTech TH tissue homogenizer (Kelly Scientific) fitted with a polycarbonate probe. Then, 5 to 50 L aliquots of high purity standard solution (Choice Analytical) were added to each standard preparation, which were then further homogenized. Next, six approximately 250 mg aliquots of each standard were digested in HNO3:H2O2 (3:1 ratio) in a Milestone MLS 1200 microwave digester (John Morris Scientific), and each standard was analyzed by solution nebulization ICP-MS to accurately determine the trace metal concentration and homogeneity of the standards.
Data were reduced into multispectral images using the Interactive Data Imaging Spectral Data Analysis Software (ISIDAS) developed by the University of Technology, Sydney Computational Research Support Unit. ISIDAS is a specialized data reduction package written in the Python programming language. Images were exported from ISIDAS in a Visualization Toolkit (.vtk) format into Enthought MayaVi2 for color rendering. Quantitative data were extracted by freehand outlining of the ROIs using ISIDAS.
Statistical analyses were performed using MedCalc version 14.8.1 for Windows (MedCalc Software, Mariakerke, Belgium). Descriptive statistical measures, including the mean, median, standard deviation (SD), and range were calculated for quantitative measurement.
Data are expressed as the mean ± SD or median (lowest value, highest value). Differences in the blood glucose levels, intrapancreatic gadolinium concentration using LA-ICP-MS and the normalized SI and ER of the pancreata between the diabetic and control group at each time point were compared using the Mann-Whitney test. We obtained the area under the receiver operating characteristics (ROC)-curve (AUC), and the sensitivity, specificity, and accuracy of the ER to determine the diabetic rat group with an optimal cut-off value which was calculated using a ROC-based positive test with the categorical variables of diabetes or control.
We used linear regression analysis to determine the association between the histological results and the normalized SI and ER of the pancreata.
A P value < 0.05 was considered statistically significant.
The statistical methods of this study were reviewed by Yunhee Choi, PhD, from the Medial Research Collaborating Center at Seoul National University Hospital.
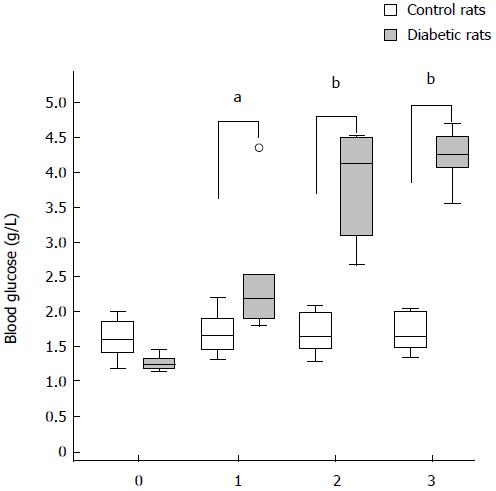
The blood glucose levels for STZ-injected rats were elevated compared with control rats from day 1 after the injection of STZ (day 1, P < 0.05; day 2, P < 0.01; day 3, P < 0.01). The blood glucose level of rats that underwent MRI are shown in Figure 4 (from day 0 to day 3).
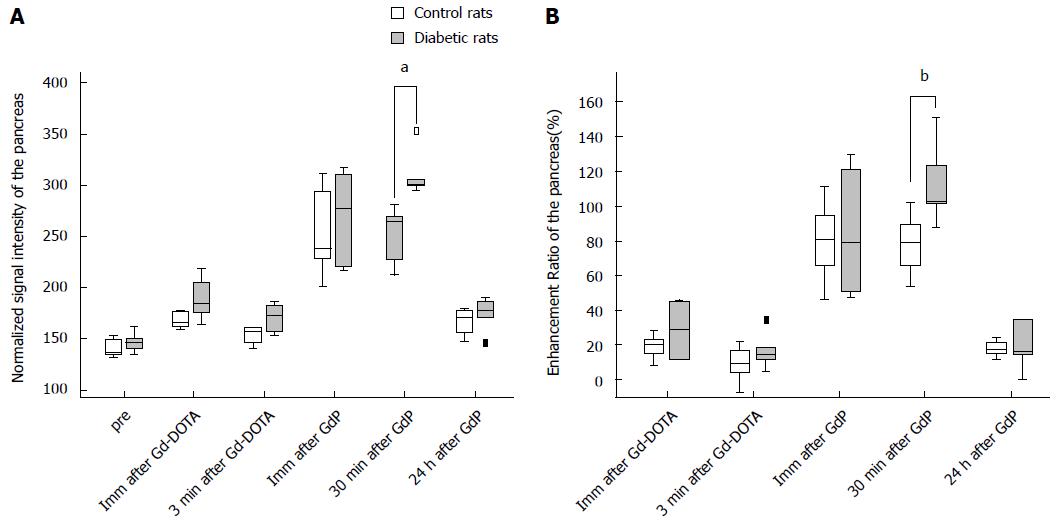
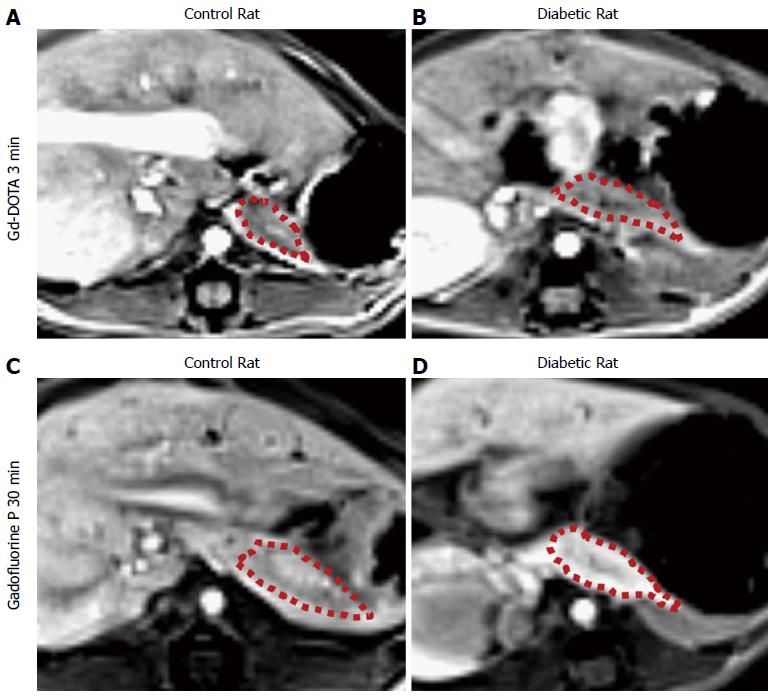
Table 1 summarizes the normalized SI and ER of the pancreata after the injection of Gd-DOTA and Gadofluorine P in control and diabetic rats. After the injection of Gd-DOTA, we did not observe a significant difference in either normalized SI or ER of the pancreata between control and diabetic rats at each time point. In terms of Gadofluorine P-enhanced MRI, both the normalized SI and ER of the pancreata of the diabetic rats were significantly higher than those of the control rats 30 min after injection (309.8 ± 21.5 vs 251.7 ± 27.6; 111.8 ± 22.3 vs 78.0 ± 17.5, respectively), whereas we did not observe a significant difference at any other time point. Figure 5 shows the change in the normalized SI and ER of the pancreata after the injection of Gd-DOTA and Gadofluorine P in the control and diabetic rats; representative images (Figure 6) are included for each group.
| Pre | Imm after Gd-DOTA | 3 min after Gd-DOTA | Imm after GdP | 30 min after GdP | 24 h after GdP | |
| Normalized signal intensity of the pancreas | ||||||
| Control rats | 137.9 (132.0, 152.4) | 165.6 (160.0, 177.8) | 158.2 (141.2, 161.3) | 238.4 (201.8, 311.6) | 264.7 (212.5, 280.7)b | 171.0 (147.3, 178.9) |
| Diabetic rats | 146.6 (135.2, 161.7) | 184.4 (164.0, 218.7) | 173.3 (153.2, 185.9) | 277.1 (217.0, 317.4) | 302.6 (295.6, 353.3)b | 177.9 (145.9, 189.7) |
| Enhancement ratio of the pancreas (%) | ||||||
| Control rats | 20.5 (8.7, 27.9) | 9.3 (-7.3, 21.6) | 80.8 (46.3, 111.2) | 79.5 (54.1, 101.6)a | 17.4 (11.6, 24.0) | |
| Diabetic rats | 29.3 (11.8, 45.5) | 14.8 (4.9, 34.4) | 79.3 (47.5, 129.3) | 103.3 (87.9, 151.1)a | 16.5 (-0.1, 34.8) | |
To differentiate diabetic rats from the control group, ROC analysis showed that ER 30 min after Gadofluorine P injection had a greater AUC than did ER 3 min after Gd-DOTA injection (Table 2), which was not statistically significant (P = 0.085). The optimal ER value 30 min after Gadofluorine P injection was > 101.6%; the sensitivity, specificity and accuracy were 83.3% (5 of 6 rats), 100% (5 of 5 rats) and 90.9% (10 of 11 rats). The optimal ER value 3 min after Gd-DOTA injection was > 9.4%; the sensitivity, specificity and accuracy were 83.3% (5 of 6 rats), 60% (3 of 5 rats) and 72.8% (8 of 11 rats).
| AUC | |
| Enhancement ratio 3 min after Gd-DOTA | 0.667 (0.334-0.908) |
| Enhancement ratio 30 min after GdP | 0.967 (0.664-1.000) |
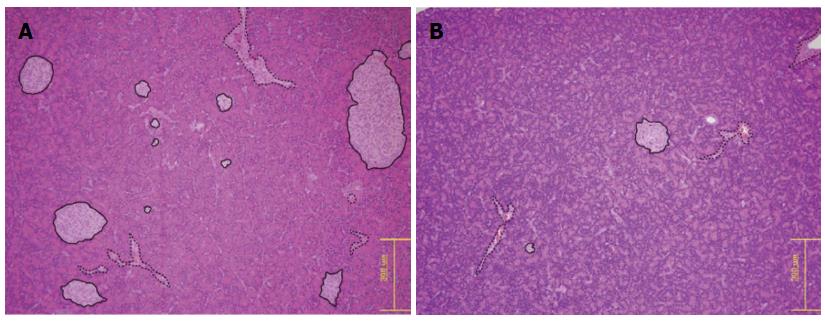
The mean islet diameters were 315.89 ± 101.44 and 481.34 ± 69.32 μm in the diabetic and control rat groups, respectively, which were significantly different (P = 0.013). The mean numbers of islets per 2.2-mm diameter field were 3.7 ± 1.5 and 6.8 ± 2.3 in the diabetic and control rat groups, respectively, which were also statistically significant (P = 0.023) (Figure 7).
The pathologist did not report any specific HE findings other than decreased islet numbers and sizes.
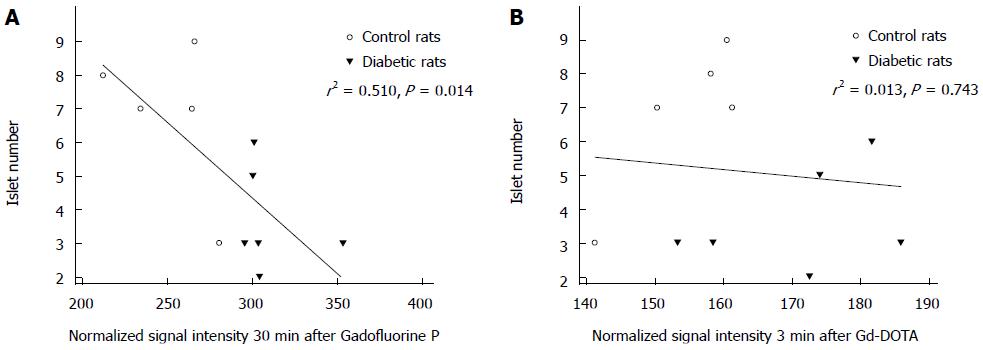
Simple linear regression analysis revealed that the increase in normalized SI 30 min after Gadofluorine P injection was associated with a decrease in the mean number of islets per field (r2 = 0.510, P = 0.014) but that normalized SI 3 min after Gd-DOTA was not associated (r2 = 0.013, P = 0.743) (Figure 8).
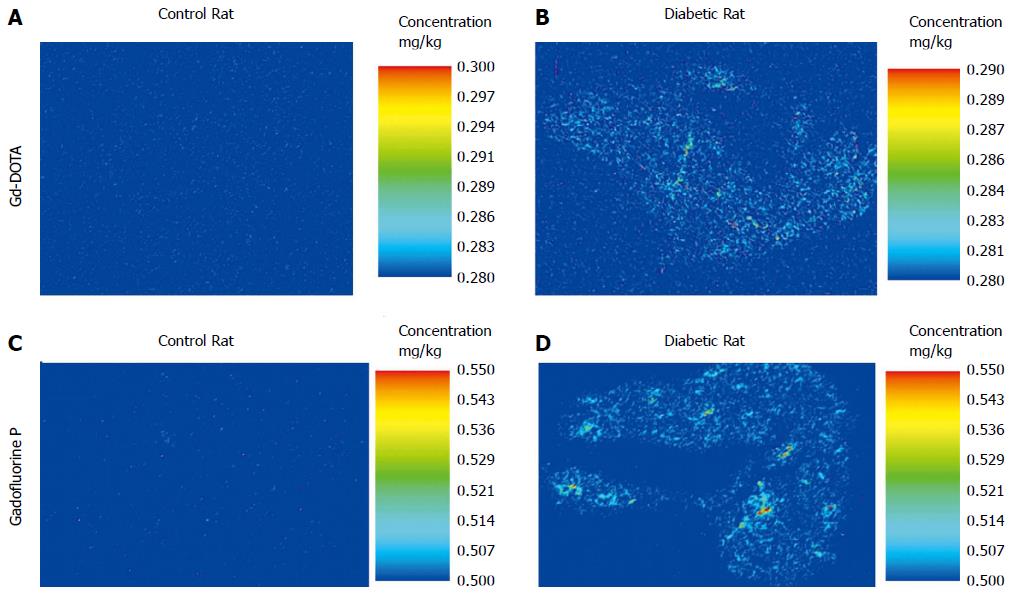
A significant difference in the concentration of intrapancreatic Gd was observed between the control and diabetic animals that were euthanized 30 min after Gadofluorine P injection (control (n = 4) vs diabetic (n = 4), 3.25 (2.48, 5.35) ng/g vs 10.55 (9.39, 14.92) ng/g, P < 0.05; Figure 9A, B). No significant difference was noted between the control and diabetic rats that were euthanized 3 min after Gd-DOTA injection [control (n = 2) vs diabetic (n = 2), 0.00 (0.00, 0.00) vs 0.78 (0.00, 1.55) ng/g; Figure 9C, D]. The concentration of intrapancreatic Gd was higher in rats treated with Gadofluorine P than the rats treated with Gd-DOTA injection [Gd-DOTA (n = 4) vs Gadofluorine P (n = 8), 0.00 (0.00, 1.55) vs 7.37 (2.48, 14.92), P < 0.01].
This study demonstrates that Gadofluorine P-enhanced MRI can be used to assess the changes in the pancreas in the STZ-induced diabetes model. This is attributed to the increased vascular permeability of the pancreas and the physicochemical properties of Gadofluorine P.
We suggest several working mechanisms of Gadofluorine P enhancement of the pancreas in STZ-induced diabetes. First, Gadofluorine P has a strong blood pool effect[23]. Unlike Gd-DOTA, which is also T1 contrast media but is rapidly cleared from the intravascular space and eliminated[32], Gadofluorine P can re-circulate in the blood by binding to albumin via its nonspecific protein binding properties[19]. The elimination half-life of Gadofluorine P is approximately six times greater than that of Gd-DOTA[19,25]. In addition, the R1 relaxivity of Gadofluorine P is approximately four times greater than that of Gd-DOTA. Second, Gadofluorine P can extravasate in regions of increased vascular permeability and bind to extracellular protein in the interstitial space. In our results obtained from LA-ICP-MS, the concentration of intrapancreatic Gd was significantly higher in diabetic rats than the control rats with Gadofluorine P injection. With Gd-DOTA injection, intrapancreatic Gd was significantly lower than with Gadofluroine P injection in the pancreas of diabetic or control rats. These results revealed the extravasation and accumulation of Gadofluorine P in the pancreas of the diabetic rat. Gadofluorine M accumulation in the extracellular matrix in regions with disturbed epithelial membranes has been confirmed in other disease models including atherosclerosis, and inflammatory bowel disease[18,22]. In atherosclerotic plaques, the Gadofluorine M-albumin complex leaks into the extravascular space and then accumulates within the extracellular compartment and the fibrous parts of the plaque by binding to collagens, proteoglycans and tenascin[18]. In inflammatory bowel disease, Gadofluorine M accumulates in the lamina propria mucosae of the bowel beyond the intravascular space[22]. We also demonstrated the accumulation of Gadofluorine P in the pancreas using LA-ICP-MS.
In our results, the normalized SI of the pancreas 30 min after Gadofluorine P injection negatively correlated with pancreatic islet number of the pancreas. These results correspond with the results of an earlier study by Medarova et al[33] which demonstrated that T1 relaxation time was significantly lower compared to controls after the injection of T1 contrast medium (protected graft copolymer covalently linked to Gd-diethylenetriaminepentaacetic acid residues labeled with fluorescein isothiocyanate) in the pancreata of STZ-induced diabetic animals. However, they did not quantitatively correlate the MR parameters with islet mass or β-cell function.
There have been other studies evaluating the pancreas of type 1 diabetes using MRI: Denis et al[34] used long-circulating magnetofluorescent nanoparticles (iron oxide cored particle attached fluorochrome) in nonobese diabetic mice and Gaglia et al[35] used iron-based magnetic nanoparticles in recent onset type 1 diabetes patients. In contrast to our study, these studies used iron-based negative T2 contrast agents. They postulated that their iron-based contrast agents extravasate from leaky vessels into the surrounding tissue and are engulfed by activated macrophages in the tissue. Denis et al[34] demonstrated that accumulation of the nanoparticles in mice correlates with insulitis intensity as revealed by HE histological analysis. However, in our study, we could not find evidence of insulitis in the histological analysis of the pancreas: there was no inflammatory cell accumulation. Similarly, Medarova et al[33] reported that in an STZ-induced model of type 1 diabetes, the pancreatic islets were less abundant and islet morphology was abnormal, but there was no inflammatory cell infiltrates.
Antkowiak et al[36] reported that measurements of pancreatic R1 in manganese-enhanced MRI accurately reflected changes of functional β cell mass in their mouse model of type 1 diabetes. Manganese ion, which is a T1 contrast medium, enters β cells through voltage-gated calcium channels and specific β cell uptake occurs after glucose stimulation[37]. However, that study, which emphasizes the detection of early changes before overt diabetes, does not account for the increase of vascular permeability that can influence manganese ion uptake by β cell.
Dhyani et al[38] reported that the kinetic parameters of dynamic manganese-enhanced MRI could be used to assess β-cell functionality; however, this method is limited by motion artifacts and low signal-to-noise ratios during pancreatic imaging. In our study, we used noninvasive MRI to image in vivo the vasculature of the pancreas in STZ-induced diabetic rats using the blood-pool agent Gadofluorine P. The strengths of the present method are as follows: (1) possible application for pancreatic MRI using conventional sequences; (2) relatively short circulation time as a blood pool agent; and (3) strong T1 contrast between the normal and diabetic pancreas.
In addition, MRI can evaluate pancreatic morphology, allowing the assessment of pancreatic volume and other pancreatic diseases (chronic pancreatitis, pancreatic cancer) that can cause diabetes.
The next logical step of our study is to test whether this method can detect early changes before overt diabetes, as blood glucose was significantly elevated one day after STZ injection in our model. We anticipate that with further development, this technique could diagnose type 1 diabetes early, as well as monitor vascular and islet changes noninvasively and quantitatively.
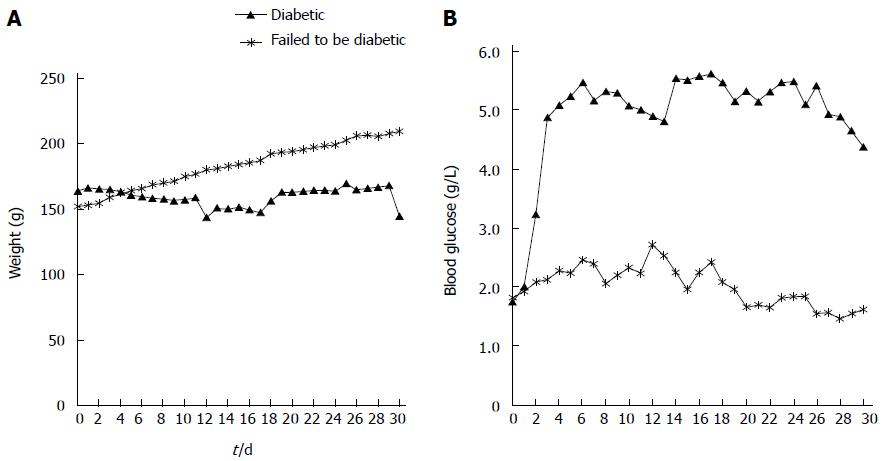
There are several limitations to this study. First, we used sequential imaging in the same rats for both contrast media. If we use a longer time interval, contrast media are more easily eliminated from the body, so the potential interaction between the contrast media might be avoided. However, the elimination half-life of Gd-DOTA is 18 min; therefore, the 24-h interval is considered sufficient for rats with healthy kidneys. In addition, the changes in the pancreas may progress during the delay between MRI. However, we did not perform histological analyses of the pancreas on day 4, which is a limitation of our study. However, we had a separate set of rats for blood glucose level monitoring for 30 d. In Figure 10, blood glucose level was elevated and plateaued above 4.5 g/L from day 3. MRI, which was selected for comparison of Gd-DOTA and Gadolinium P in our study, was obtained on day 4 and day 5. Moreover, we attempted to minimize the number of animals following the policy of our institutional animal care and use committee. Second, there was a 24 h interval between the times of rat euthanasia for HE staining for islet number count (day 6) and the time when normalized SI and ER of control and diabetic rats showed a significant difference (day 5). Therefore, it is possible that islet number may be greater at 30 min after Gadofluorine P injection than at 24 h. Third, we demonstrated that Gadofluorine P accumulated in the pancreata of diabetic rats using LA-ICP-MS but Gd-DOTA did not; however, we did not demonstrate the location of Gadofluorine P in the pancreas. However, in the study of Medarova et al[33] of an STZ-induced mouse model of type 1 diabetes, they observed their fluorescence-conjugated T1 contrast medium in islet interstitium and islet-feeding blood vessels in diabetic rats but not in control rats using fluorescence microscopy.
In conclusion, in this STZ-induced diabetic rat model, Gadofluorine P-enhanced MRI of the pancreas showed high accuracy in the diagnosis of diabetes.
The authors appreciate comments and feedback from the Medial Research Collaborating Center at Seoul National University Hospital on the manuscript.
Diabetes mellitus is a group of metabolic diseases resulting from defects in insulin secretion or insulin action. Type 1 diabetes is characterized by insulin deficiency, which is caused by specific destruction of insulin-producing β-cells, which are located in the islets of Langerhans in the pancreas.
Magnetic resonance imaging (MRI) is used in diabetes research including imaging of islet vasculature, imaging of islet transplantation, imaging of autoimmune attack in type 1 diabetes, and imaging of β cell mass.
This study compared two MRI T1 contrast media to detect diabetes in rats. This study showed that an increase in normalized signal intensity 30 min after Gadofluorine P injection was correlated with a decrease in the mean number of islets.
The ability to detect changes in the pancreas through noninvasive methods can have diverse important clinical benefits. For example, it can reduce potentially harmful biopsy during the pancreas transplantation. With further development, MRI and MRI contrast media or probes can detect the early changes of diabetes earlier than blood tests.
Gd-DOTA is a first generation nonspecific extracellular MR contrast medium, which distributes into the intravascular and interstitial spaces and does not have a protein interaction. Gadofluorine P is an amphiphilic, water-soluble Gd complex. Gadofluorine P has strong interactions with hydrophobic proteins in blood (albumin) or extracellular tissue (extracellular matrix proteins). Therefore, Gadofluorine P has longer half-life in the blood and a higher tissue protein binding than that provided by standard extracellular MR contrast media. However, the protein binding of Gadofluorine P has no direct specific molecular targeting.
The authors utilized MRI and contrast media in the diagnosis of type 1 diabetes in rats and compare two MRI contrast media. Imaging methods can also evaluate other pancreatic disease (chronic pancreatitis and pancreatic cancer) with known association with diabetes. The manuscript is very well written.
P- Reviewer: Grassi G, Mihaila RG, Miki K, Wakiyama S S- Editor: Ma YJ L- Editor: A E- Editor: Liu XM
| 1. | Ahlgren U, Gotthardt M. Approaches for imaging islets: recent advances and future prospects. Adv Exp Med Biol. 2010;654:39-57. [RCA] [PubMed] [DOI] [Full Text] [Cited by in Crossref: 20] [Cited by in RCA: 21] [Article Influence: 1.4] [Reference Citation Analysis (0)] |
| 2. | Bonner-Weir S, Orci L. New perspectives on the microvasculature of the islets of Langerhans in the rat. Diabetes. 1982;31:883-889. [RCA] [PubMed] [DOI] [Full Text] [Cited by in Crossref: 91] [Cited by in RCA: 78] [Article Influence: 1.9] [Reference Citation Analysis (0)] |
| 3. | De Paepe ME, Corriveau M, Tannous WN, Seemayer TA, Colle E. Increased vascular permeability in pancreas of diabetic rats: detection with high resolution protein A-gold cytochemistry. Diabetologia. 1992;35:1118-1124. [PubMed] |
| 4. | Majno G, Joris I, Handler ES, Desemone J, Mordes JP, Rossini AA. A pancreatic venular defect in the BB/Wor rat. Am J Pathol. 1987;128:210-215. [PubMed] |
| 5. | Jansson L, Sandler S. Alloxan-induced diabetes in the mouse: time course of pancreatic B-cell destruction as reflected in an increased islet vascular permeability. Virchows Arch A Pathol Anat Histopathol. 1986;410:17-21. [PubMed] |
| 6. | Enghofer M, Usadel KH, Beck O, Kusterer K. Superoxide dismutase reduces islet microvascular injury induced by streptozotocin in the rat. Am J Physiol. 1997;273:E376-E382. [PubMed] |
| 7. | Sandler S, Jansson L. Vascular permeability of pancreatic islets after administration of streptozotocin. Virchows Arch A Pathol Anat Histopathol. 1985;407:359-367. [PubMed] |
| 8. | Carlsson PO, Flodström M, Sandler S. Islet blood flow in multiple low dose streptozotocin-treated wild-type and inducible nitric oxide synthase-deficient mice. Endocrinology. 2000;141:2752-2757. [RCA] [PubMed] [DOI] [Full Text] [Cited by in Crossref: 8] [Cited by in RCA: 10] [Article Influence: 0.4] [Reference Citation Analysis (0)] |
| 9. | Papaccio G, Latronico MV, Pisanti FA, Federlin K, Linn T. Adhesion molecules and microvascular changes in the nonobese diabetic (NOD) mouse pancreas. An NO-inhibitor (L-NAME) is unable to block adhesion inflammation-induced activation. Autoimmunity. 1998;27:65-77. [PubMed] |
| 10. | Papaccio G. Insulitis and islet microvasculature in type 1 diabetes. Histol Histopathol. 1993;8:751-759. [PubMed] |
| 11. | Beppu H, Maruta K, Kürner T, Kolb H. Diabetogenic action of streptozotocin: essential role of membrane permeability. Acta Endocrinol (Copenh). 1987;114:90-95. [PubMed] |
| 12. | Carlsson PO, Sandler S, Jansson L. Pancreatic islet blood perfusion in the nonobese diabetic mouse: diabetes-prone female mice exhibit a higher blood flow compared with male mice in the prediabetic phase. Endocrinology. 1998;139:3534-3541. [RCA] [PubMed] [DOI] [Full Text] [Cited by in Crossref: 24] [Cited by in RCA: 29] [Article Influence: 1.1] [Reference Citation Analysis (0)] |
| 13. | Kiryu S, Inoue Y, Sheng F, Watanabe M, Yoshikawa K, Shimada M, Ohtomo K. Interstitial MR lymphography in mice: comparative study with gadofluorine 8, gadofluorine M, and gadofluorine P. Magn Reson Med Sci. 2012;11:99-107. [PubMed] |
| 14. | Like AA, Rossini AA. Streptozotocin-induced pancreatic insulitis: new model of diabetes mellitus. Science. 1976;193:415-417. [PubMed] |
| 15. | Rossini AA, Like AA, Chick WL, Appel MC, Cahill GF. Studies of streptozotocin-induced insulitis and diabetes. Proc Natl Acad Sci USA. 1977;74:2485-2489. [PubMed] |
| 16. | Leiter EH. Multiple low-dose streptozotocin-induced hyperglycemia and insulitis in C57BL mice: influence of inbred background, sex, and thymus. Proc Natl Acad Sci USA. 1982;79:630-634. [PubMed] |
| 17. | Raatschen HJ, Swain R, Shames DM, Fu Y, Boyd Z, Zierhut ML, Wendland MF, Misselwitz B, Weinmann HJ, Wolf KJ. MRI tumor characterization using Gd-GlyMe-DOTA-perfluorooctyl-mannose-conjugate (Gadofluorine M), a protein-avid contrast agent. Contrast Media Mol Imaging. 2006;1:113-120. [RCA] [PubMed] [DOI] [Full Text] [Cited by in Crossref: 13] [Cited by in RCA: 14] [Article Influence: 0.8] [Reference Citation Analysis (0)] |
| 18. | Meding J, Urich M, Licha K, Reinhardt M, Misselwitz B, Fayad ZA, Weinmann HJ. Magnetic resonance imaging of atherosclerosis by targeting extracellular matrix deposition with Gadofluorine M. Contrast Media Mol Imaging. 2007;2:120-129. [RCA] [PubMed] [DOI] [Full Text] [Cited by in Crossref: 75] [Cited by in RCA: 68] [Article Influence: 4.0] [Reference Citation Analysis (0)] |
| 19. | Braeutigam M, Kiessling F. Former Schering AG data on file, courtesy to invivoContrast GmbH, Berlin. Available from: http://www.invivocontrast.com/?rubrik=gadofluorine_p. |
| 20. | Misselwitz B, Meding J, Reinhardt M, Weinmann H. Gadofluorine P. Initial Experiences with a New MR Contrast Medium: MRI of Atherosclerotic Plaques Proceedings of the Radiological Society of North America 2007; Scientific Assembly and Annual Meeting; 2007, Nov 25-30; Chicago, IL, United States. |
| 21. | Barkhausen J, Ebert W, Heyer C, Debatin JF, Weinmann HJ. Detection of atherosclerotic plaque with Gadofluorine-enhanced magnetic resonance imaging. Circulation. 2003;108:605-609. [RCA] [PubMed] [DOI] [Full Text] [Cited by in Crossref: 139] [Cited by in RCA: 121] [Article Influence: 5.5] [Reference Citation Analysis (0)] |
| 22. | Frericks BB, Kühl AA, Loddenkemper C, Stroux A, Valdeig S, Hotz B, Misselwitz B, Hoffmann JC, Wacker FK. Gadofluorine M-enhanced magnetic resonance imaging of inflammatory bowel disease: quantitative analysis and histologic correlation in a rat model. Invest Radiol. 2011;46:478-485. [RCA] [PubMed] [DOI] [Full Text] [Cited by in Crossref: 6] [Cited by in RCA: 7] [Article Influence: 0.5] [Reference Citation Analysis (0)] |
| 23. | Sheng F, Inoue Y, Kiryu S, Watanabe M, Ohtomo K. Long-term assessment of contrast effects of gadofluorine M and gadofluorine P in magnetic resonance imaging of mice. Jpn J Radiol. 2012;30:86-91. [RCA] [PubMed] [DOI] [Full Text] [Cited by in Crossref: 1] [Cited by in RCA: 1] [Article Influence: 0.1] [Reference Citation Analysis (0)] |
| 24. | Laurent S, Elst LV, Muller RN. Comparative study of the physicochemical properties of six clinical low molecular weight gadolinium contrast agents. Contrast Media Mol Imaging. 2006;1:128-137. [RCA] [PubMed] [DOI] [Full Text] [Cited by in Crossref: 335] [Cited by in RCA: 324] [Article Influence: 18.0] [Reference Citation Analysis (0)] |
| 25. | Fries P, Runge VM, Bücker A, Schürholz H, Reith W, Robert P, Jackson C, Lanz T, Schneider G. Brain tumor enhancement in magnetic resonance imaging at 3 tesla: intraindividual comparison of two high relaxivity macromolecular contrast media with a standard extracellular gd-chelate in a rat brain tumor model. Invest Radiol. 2009;44:200-206. [RCA] [PubMed] [DOI] [Full Text] [Cited by in Crossref: 24] [Cited by in RCA: 23] [Article Influence: 1.4] [Reference Citation Analysis (0)] |
| 26. | Ni Y. MR Contrast Agents for Cardiac Imaging. Clinical Cardiac MRI. 2nd ed. Berlin Heidelberg: Springer-Verlag 2012; 31-51. |
| 27. | Runge VM, Jacobson S, Wood ML, Kaufman D, Adelman LS. MR imaging of rat brain glioma: Gd-DTPA versus Gd-DOTA. Radiology. 1988;166:835-838. [RCA] [PubMed] [DOI] [Full Text] [Cited by in Crossref: 33] [Cited by in RCA: 35] [Article Influence: 0.9] [Reference Citation Analysis (0)] |
| 28. | Lear J, Hare D, Adlard P, Finkelstein D, Doble P. Improving acquisition times of elemental bio-imaging for quadrupole-based LA-ICP-MS. J Anal At Spectrom. 2012;27:159-164. [DOI] [Full Text] |
| 29. | Austin C, Fryer F, Lear J, Bishop D, Hare D, Rawling T, Kirkup L, McDonagh A, Doble P. Factors affecting internal standard selection for quantitative elemental bio-imaging of soft tissues by LA-ICP-MS. J Anal At Spectrom. 2011;26:1494-1501. [DOI] [Full Text] |
| 30. | Hare D, Reedy B, Grimm R, Wilkins S, Volitakis I, George JL, Cherny RA, Bush AI, Finkelstein DI, Doble P. Quantitative elemental bio-imaging of Mn, Fe, Cu and Zn in 6-hydroxydopamine induced Parkinsonism mouse models. Metallomics. 2009;1:53-58. [RCA] [DOI] [Full Text] [Cited by in Crossref: 107] [Cited by in RCA: 108] [Article Influence: 6.8] [Reference Citation Analysis (0)] |
| 31. | Hare DJ, George JL, Grimm R, Wilkins S, Adlard PA, Cherny RA, Bush AI, Finkelstein DI, Doble P. Three-dimensional elemental bio-imaging of Fe, Zn, Cu, Mn and P in a 6-hydroxydopamine lesioned mouse brain. Metallomics. 2010;2:745-753. [RCA] [DOI] [Full Text] [Cited by in Crossref: 64] [Cited by in RCA: 66] [Article Influence: 4.4] [Reference Citation Analysis (0)] |
| 32. | Bellin MF, Van Der Molen AJ. Extracellular gadolinium-based contrast media: an overview. Eur J Radiol. 2008;66:160-167. [RCA] [PubMed] [DOI] [Full Text] [Cited by in Crossref: 163] [Cited by in RCA: 161] [Article Influence: 9.5] [Reference Citation Analysis (0)] |
| 33. | Medarova Z, Castillo G, Dai G, Bolotin E, Bogdanov A, Moore A. Noninvasive magnetic resonance imaging of microvascular changes in type 1 diabetes. Diabetes. 2007;56:2677-2682. [RCA] [PubMed] [DOI] [Full Text] [Cited by in Crossref: 41] [Cited by in RCA: 39] [Article Influence: 2.2] [Reference Citation Analysis (0)] |
| 34. | Denis MC, Mahmood U, Benoist C, Mathis D, Weissleder R. Imaging inflammation of the pancreatic islets in type 1 diabetes. Proc Natl Acad Sci USA. 2004;101:12634-12639. [RCA] [PubMed] [DOI] [Full Text] [Cited by in Crossref: 151] [Cited by in RCA: 136] [Article Influence: 6.5] [Reference Citation Analysis (0)] |
| 35. | Gaglia JL, Guimaraes AR, Harisinghani M, Turvey SE, Jackson R, Benoist C, Mathis D, Weissleder R. Noninvasive imaging of pancreatic islet inflammation in type 1A diabetes patients. J Clin Invest. 2011;121:442-445. [RCA] [PubMed] [DOI] [Full Text] [Cited by in Crossref: 157] [Cited by in RCA: 160] [Article Influence: 10.7] [Reference Citation Analysis (0)] |
| 36. | Antkowiak PF, Stevens BK, Nunemaker CS, McDuffie M, Epstein FH. Manganese-enhanced magnetic resonance imaging detects declining pancreatic β-cell mass in a cyclophosphamide-accelerated mouse model of type 1 diabetes. Diabetes. 2013;62:44-48. [RCA] [PubMed] [DOI] [Full Text] [Full Text (PDF)] [Cited by in Crossref: 26] [Cited by in RCA: 23] [Article Influence: 1.9] [Reference Citation Analysis (0)] |
| 37. | Antkowiak PF, Vandsburger MH, Epstein FH. Quantitative pancreatic β cell MRI using manganese-enhanced Look-Locker imaging and two-site water exchange analysis. Magn Reson Med. 2012;67:1730-1739. [RCA] [PubMed] [DOI] [Full Text] [Cited by in Crossref: 18] [Cited by in RCA: 17] [Article Influence: 1.2] [Reference Citation Analysis (0)] |
| 38. | Dhyani AH, Fan X, Leoni L, Haque M, Roman BB. Empirical mathematical model for dynamic manganese-enhanced MRI of the murine pancreas for assessment of β-cell function. Magn Reson Imaging. 2013;31:508-514. [RCA] [PubMed] [DOI] [Full Text] [Cited by in Crossref: 6] [Cited by in RCA: 8] [Article Influence: 0.6] [Reference Citation Analysis (0)] |


