Copyright
©2014 Baishideng Publishing Group Inc.
World J Gastroenterol. Aug 14, 2014; 20(30): 10537-10544
Published online Aug 14, 2014. doi: 10.3748/wjg.v20.i30.10537
Published online Aug 14, 2014. doi: 10.3748/wjg.v20.i30.10537
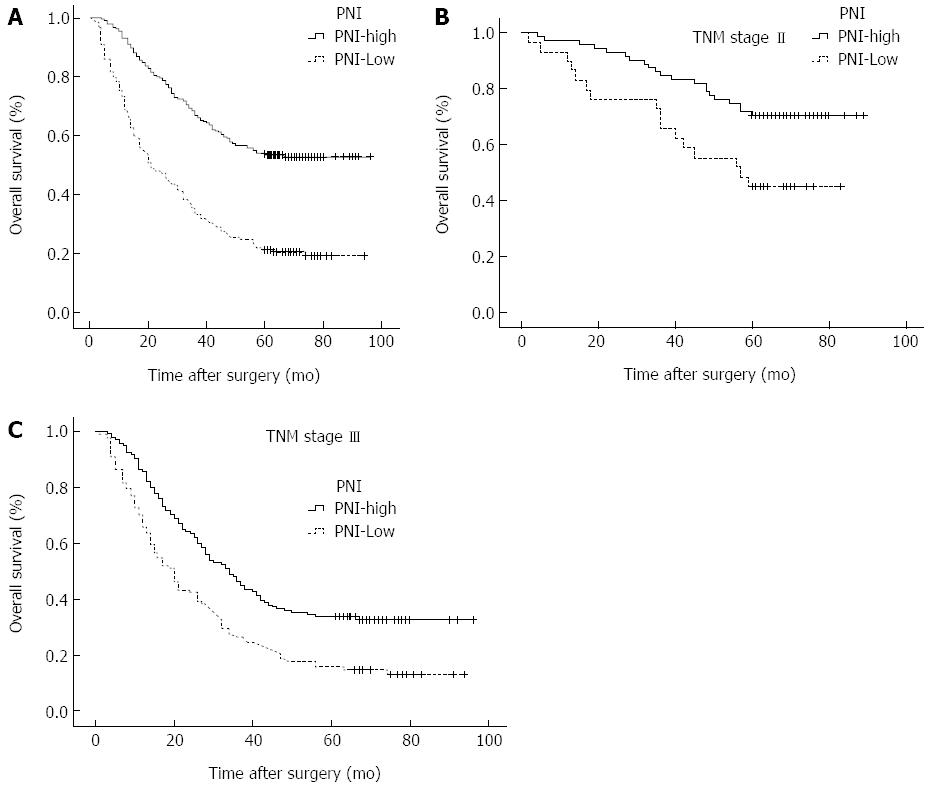
Figure 1 Overall survival curves.
A: For patients between PNI-low group and PNI-high group. The 5-year OS rates were 54.1% and 21.1% in PNI-high group and PNI-low group, respectively (P < 0.001); B: For patients with TNM II stage disease. The 5-year OS rates were 72.9% in PNI-high group and 40.0% in PNI-low group (χ2 = 11.591, P = 0.001); C: For patients with TNM III stage disease. The 5-year OS rates were 36.6% in PNI-high group and 12.4 % in PNI-low group (χ2 = 33.020, P < 0.001). PNI: Prognostic nutritional index; OS: Overall survival.
- Citation: Jiang N, Deng JY, Ding XW, Ke B, Liu N, Zhang RP, Liang H. Prognostic nutritional index predicts postoperative complications and long-term outcomes of gastric cancer. World J Gastroenterol 2014; 20(30): 10537-10544
- URL: https://www.wjgnet.com/1007-9327/full/v20/i30/10537.htm
- DOI: https://dx.doi.org/10.3748/wjg.v20.i30.10537


