Copyright
©2012 Baishideng Publishing Group Co.
World J Gastroenterol. Feb 21, 2012; 18(7): 646-653
Published online Feb 21, 2012. doi: 10.3748/wjg.v18.i7.646
Published online Feb 21, 2012. doi: 10.3748/wjg.v18.i7.646
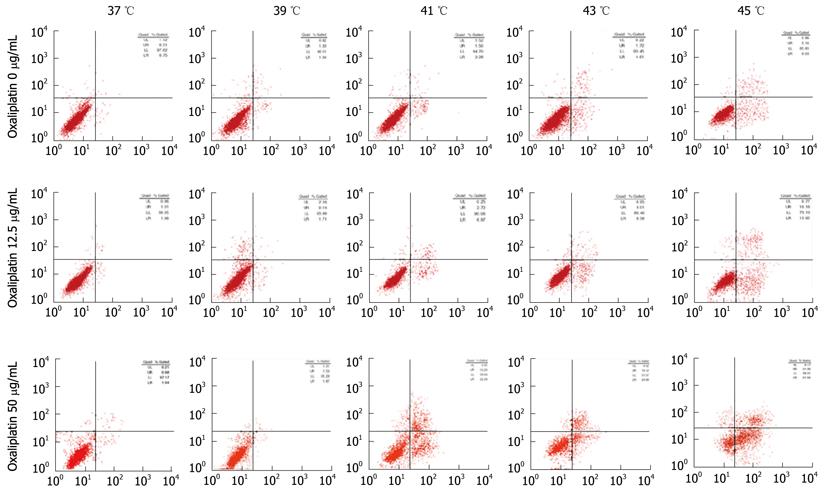
Figure 4 Measurement of Lovo cell apoptosis using apoptosis detection kit.
Data are presented as dot plots in which the vertical axis represents propidium iodide (PI)-positive cells and the horizontal axis annexin V-positive cells. The upper left quadrant region contains necrotic (PI-positive) cells, the upper right region contains the late stage of apoptotic and necrotic (PI- and annexin V-positive) cells, the lower left region contains viable non-apoptotic (PI- and annexin-V-negative) cells, and the lower right region contains early apoptotic (PI-unstained and annexin-V-positive) cells.
- Citation: Zhang XL, Hu AB, Cui SZ, Wei HB. Thermotherapy enhances oxaliplatin-induced cytotoxicity in human colon carcinoma cells. World J Gastroenterol 2012; 18(7): 646-653
- URL: https://www.wjgnet.com/1007-9327/full/v18/i7/646.htm
- DOI: https://dx.doi.org/10.3748/wjg.v18.i7.646


