Published online Aug 21, 2012. doi: 10.3748/wjg.v18.i31.4102
Revised: April 26, 2012
Accepted: May 6, 2012
Published online: August 21, 2012
Diffusion-weighted magnetic resonance imaging (DWI) is a well established method for the evaluation of intracranial diseases, such as acute stroke. DWI for extracranial application is more difficult due to physiological motion artifacts and the heterogeneous composition of the organs. However, thanks to the newer technical development of DWI, DWI has become increasingly used over the past few years in extracranial organs including the abdomen and pelvis. Most previous studies of DWI have been limited to the evaluation of diffuse parenchymal abnormalities and focal lesions in abdominal organs, whereas there are few studies about DWI for the evaluation of the biliopancreatic tract. Although further studies are needed to determine its performance in evaluating bile duct, gallbladder and pancreas diseases, DWI has potential in the assessment of the functional information on the biliopancreatic tract concerning the status of tissue cellularity, because increased cellularity is associated with impeded diffusion, as indicated by a reduction in the apparent diffusion coefficient. The detection of malignant lesions and their differentiation from benign tumor-like lesions in the biliopancreatic tract could be improved using DWI in conjunction with findings obtained with conventional magnetic resonance cholagiopancreatography. Additionally, DWI can be useful for the assessment of the biliopancreatic tract in patients with renal impairment because contrast-enhanced computed tomography or magnetic resonance scans should be avoided in these patients.
- Citation: Lee NK, Kim S, Kim GH, Kim DU, Seo HI, Kim TU, Kang DH, Jang HJ. Diffusion-weighted imaging of biliopancreatic disorders: Correlation with conventional magnetic resonance imaging. World J Gastroenterol 2012; 18(31): 4102-4117
- URL: https://www.wjgnet.com/1007-9327/full/v18/i31/4102.htm
- DOI: https://dx.doi.org/10.3748/wjg.v18.i31.4102
Diffusion-weighted magnetic resonance imaging (DWI) provides information on the random (Brownian) motion of water molecules in the body. It is well established that DWI is a useful tool for the evaluation of intracranial diseases, such as acute stroke. The development of phased-array surface coils, high-gradient amplitudes, and rapid imaging techniques such as echo planar imaging (EPI) and parallel imaging have been instrumental in allowing the extracranial application of DWI[1-3].
The degree of restriction to water diffusion in biological tissues is directly proportional to tissue cellularity and the integrity of cell membranes. In tissues with a high cell density and associated with many intact cell membranes, such as malignant tumors, the motion of water molecules is more restricted than in less cellular tissue. The degree of water motion is found to be proportional to the degree of signal attenuation in DWI. Thus, more cellular solid tumors show relatively higher signal intensities and exhibit lower apparent diffusion coefficient (ADC, expressed in mm2/s) values on DWI using two or more b values than do less cellular tissues. Recently, this utility of DWI has been expanded to examination of abdominal organs; the ADC values of malignant masses are significantly lower than those of benign masses in the liver, pancreas, kidney, and prostate, although there is a small degree of overlap[4-9]. Most previous studies on DWI have been limited to the evaluation of diffuse parenchymal abnormalities and focal lesions in abdominal organs, whereas there are few studies about DWI for the evaluation of the biliopancreatic tract[10].
To date, contrast-enhanced magnetic resonance imaging (MRI) combined with magnetic resonance cholagiopancreatography (MRCP) has been found to be accurate for diagnosis of biliopancreatic diseases. The role of DWI for the evaluation of biliopancreatic diseases is not yet well established. However, because DWI yields qualitative and quantitative information reflecting cell membrane integrity and tissue cellularity, DWI can be used to differentiate normal and abnormal structures of tissues better, and thus may help in the characterization of various abnormalities in the biliopancreatic tract when added to conventional MRI.
In this article, we briefly review the basic concepts for the biological basis of DWI and its technical considerations. Additionally, we illustrate clinical applications of DWI for the following: evaluation of the biliopancreatic tract, including stone-related complications such as acute cholangitis, hepatic abscesses, and acute gallstone pancreatitis; characterization and diagnosis of gallbladder lesions, including cholecystitis, gallbladder empyema, and gallbladder carcinoma; characterization of intrahepatic biliary lesions and diagnosis of malignant lesions in the intrahepatic bile ducts; and characterization of extrahepatic biliary lesions and diagnosis of malignant lesions in the extrahepatic bile ducts, including extrahepatic cholangiocarcinoma, pancreatic carcinoma, and focal pancreatitis. We also describe pitfalls of DWI misinterpretation.
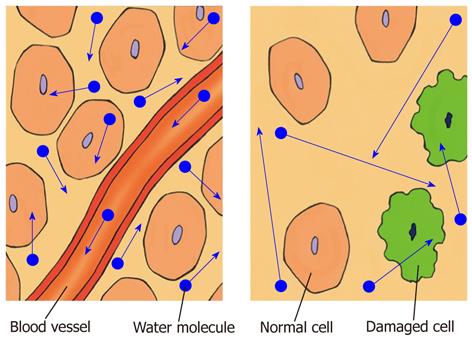
In biological tissue, the diffusion of water molecules is impeded or restricted by natural barriers, such as cell membranes, large protein molecules, and tissue cellularity. Pathological conditions, such as tumors, cytotoxic edema, abscesses, and fibrosis, in which the physical nature of the intracellular and extracellular spaces changes, result in increased restriction of the diffusion of water molecules. In tissues of low cellularity or where the cellular membranes have been disrupted, the diffusion of water molecules is relatively free or less restricted (Figure 1)[1-3,8,11].
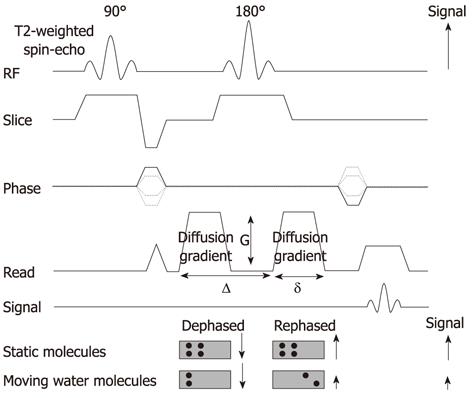
DWI is typically obtained using an ultrafast T2-weighted single-shot spin-echo EPI sequence by applying a symmetric pair diffusion-sensitizing gradient, known as the Stejskal-Tanner sequence. It provides information on the random (Brownian) motion of water molecules in tissues between the first dephasing (diffusion-sensitizing) gradient and the second rephasing gradient on either side of the 180° refocusing pulse. Static molecules acquire phase information from the first diffusion-sensitizing gradient, but information will be cancelled out by the second gradient. As a result, signal intensity is preserved, with the exception of T2 decay. In contrast, less restricted water molecules move a considerable distance between the first dephasing (diffusion-sensitizing) and second rephasing gradients. The moving water molecules are not entirely rephased, resulting in reduction of the overall T2 signal intensity (Figure 2)[1-3].
The sensitivity of a DWI sequence to water diffusion can be altered by changing the parameter known as the b value, which represents the diffusion factor (measured in s/mm2) and the strength of the diffusion gradients. DWI is obtained with at least two different b values. DWI using lower b values (50-100 s/mm2) is sensitive only to fast motion of water molecules. On DWI using lower b values, water molecules in vessels are depicted as dark blood flow (black-blood images). DWI using higher b values (> 500 s/mm2) is sensitive to both fast and slow motion of water molecules. Water movements in highly cellular tissue are restricted and retain their signals even at higher b values. The images obtained at different b values allow the quantification of the ADC of tissues, which is usually displayed as a parametric (ADC) map. The mean or median ADC value can be measured by drawing regions of interest (ROIs) on the ADC map. Tissues with restricted diffusion and high cellular density show low ADC values, whereas tissues with less cellular density show higher ADC values[1,2].
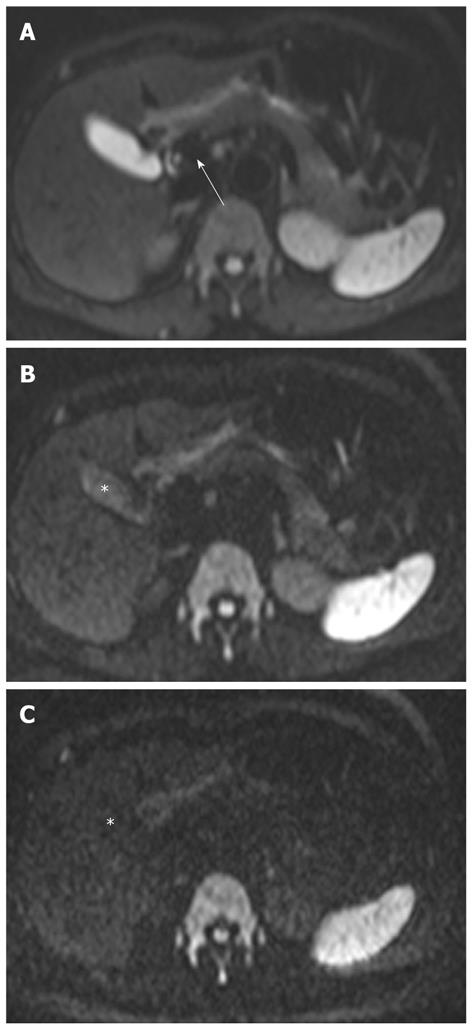
The signal intensity on DWI is dependent on diffusion of water molecules and T2 relaxation time. Thus, an area with a very long T2 relaxation time (e.g., bile in the biliary tract) maintains high signals on high-b-value DWI, and can be mistaken for restricted diffusion. This phenomenon is known as the “T2 shine-through” effect (Figure 3). The T2 shine-through effect inevitably confounds DWI images, and the ADC map eliminates this effect. In clinical practice, higher-b-value DWI (usually 800-1000 s/mm2) results in a reduction of the signal from moving protons in the bile ducts, cyst, vessels, and fluid in the bowel. This leads to a reduction in the T2 shine-through effect, resulting in increased contrast between lesions and visceral organs such as the liver or gallbladder. However, the tradeoffs of higher-b-value DWI are a lower signal-to-noise ratio, the possibility of ADC error, and increased image distortion due to the longer echo time required[1,2,8,12].
DWI performed during free breathing can lead to substantial signal loss. Thus, breath-hold or respiration-triggered DWI would be necessary to prevent signal loss as a result of respiratory movement. Breath-hold DWI is generally used because of its short acquisition time. However, only a limited number of image sections of relatively large section thicknesses can be acquired. Moreover, because this technique is usually performed using a single-shot EPI technique, the signal-to-noise ratio and lesion conspicuity is reduced. In contrast, respiration-triggered DWI provides higher signal-to-noise and contrast-to-noise ratios, although its acquisition time is longer than that of breath-hold DWI[13,14].
Fat suppression is necessary to increase the dynamic range of DWI and reduce the chemical shift artifacts that are prevalent in EPI. Inversion recovery sequence is preferred when performing DWI over a large area of the body, because it is likely to produce more uniform fat suppression[13].
Unlike brain imaging where b values are well established, b values in other parts of the body vary widely between investigators. Thus, b values for body imaging require optimization. Biexponential signal intensity in the abdominal organs has been shown in DWI with increasing b values; the initial rapid decrease in signal intensity is noted with a small increase in b value, and is followed by a more gradual decrease of signal intensity beyond approximately b = 100 s/ mm2. ADC measurement using at least three b values adequately reflects this biexponential behavior, compared with the use of only two b values. Low b values are sensitive to capillary perfusion, which can increase the amount of perfusion contamination in ADC measurement. In contrast, high b values enable less perfusion contamination in the ADC measurement and reflect tissue sensitivity[13].
In our institution, MRI is performed with a superconductive 1.5-T imaging unit (Magnetom Avanto; Siemens Medical Solutions, Erlangen, Germany), and a 3.0-T imaging unit (Magnetom Trio; Siemens Medical Solutions) by using a phased-array multicoil. For DWI, respiration-triggered, fat-suppressed, single-shot EPI is performed in the transverse plane with a parallel imaging (generalized autocalibrating partially parallel acquisition) acceleration factor of two. DWI is performed prior to the intravenous injection of gadolinium chelates. Pre-contrast DWI is usually preferred because gadolinium chelates may affect the ADC values by decreasing the signal intensity on these T2-sequences due to shortening of the T1 and T2 relaxation time. However, it has been reported that DWI after administration of gadolinium chelates does not appear to affect ADC values significantly[15]. The imaging parameters of DWI in the 1.5-T unit are as follows: 5000/103 (repetition time ms/echo time ms), 90° flip angle, 4-mm section thickness, 1-mm intersection gap, 964-Hz/pixel bandwidth, 20 slices, 230-mm field of view, 192 × 192 matrix, and 85-s acquisition time. Imaging parameters in the 3.0-T unit are as follows: 3900/92 (repetition time ms/echo time ms), 90° flip angle, 5-mm section thickness, 0.5-mm intersection gap, 1184-Hz/pixel bandwidth, 24 slices, 230-mm field of view, 192 × 192 matrix, and 85-s acquisition time. Each acquisition is obtained using five different b values including low values (0 s/mm2 and 50 s/mm2) and high values (500 s/mm2, 800 s/mm2 and 1000 s/mm2)[16,17]. The ADC map is generated automatically with the built-in software of the MRI unit.
The signal intensity of the normal liver on DWI is the same as on T2-weighted images. The liver is hypointense compared to the kidney and spleen, and isointense or hypointense compared to the pancreas (Figure 3). The reported ADC value of the normal liver ranges from 1.02 × 10⁻³ mm2/s to 1.83 × 10⁻³ mm2/s[4,18-20]. Yoshikawa et al[18] have reported that the mean ADC value of the pancreas ranges from 1.02 × 10⁻³ mm2/s to 1.94 × 10⁻³ mm2/s using DWI with two values (0 s/mm2 and 600 s/mm2). On higher DWI (usually 800-1000 s/mm2), the walls of the bile duct and gallbladder are not identified (Figure 3).
Acute cholangitis is the most frequently encountered benign inflammatory lesion and is usually related to bile duct stones. Acute cholangitis usually manifests as a dilated bile duct, due to bile duct obstruction, mild and diffuse bile duct wall thickening, and hepatic parenchymal changes on MRI. Hepatic parenchymal changes appear as patchy or wedge-shaped areas of increased parenchymal signal intensity on T2-weighted images and transient inhomogeneous parenchymal enhancement in arterial dominant phase imaging[21,22].
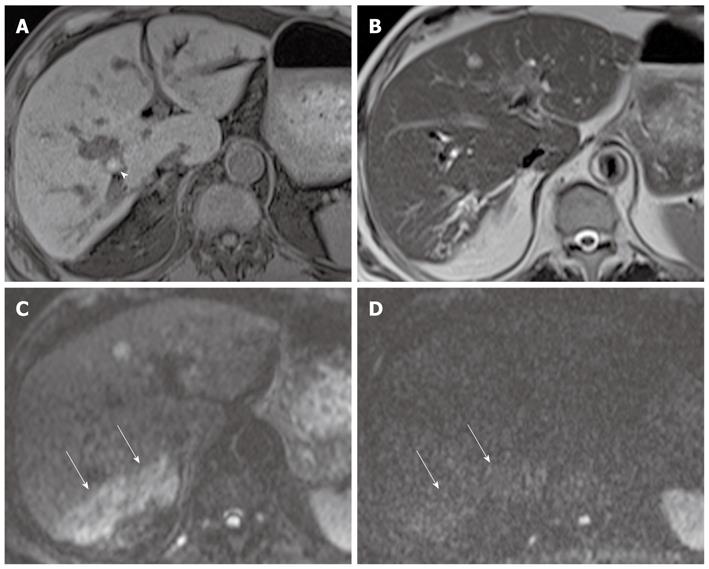
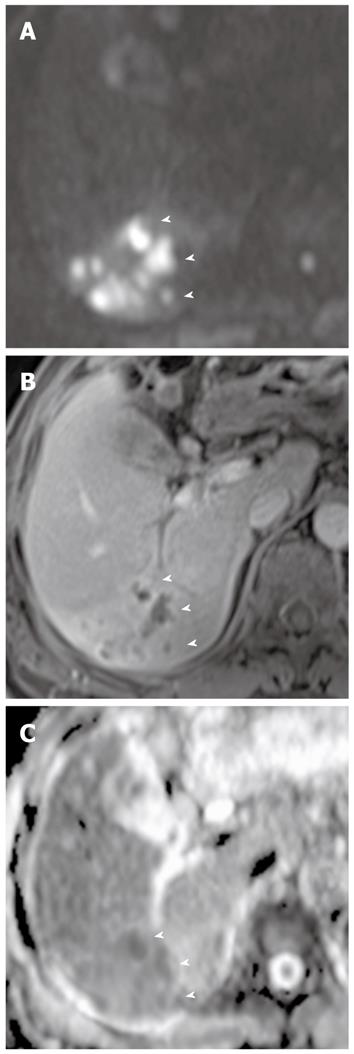
In a recent study, DWI using low b values (< 100 s/mm2), giving black-blood images, detected focal hepatic lesions more clearly than routine turbo spin-echo T2-weighted images, and can potentially replace the routine turbo spin-echo T2-weighted images for lesion detection[23]. In our experience, the increased parenchymal signal intensity is more conspicuous on black-blood images than on routine T2-weighted images in patients with acute cholangitis. On DWI using high b values, areas of increased parenchymal signal intensity usually return to signal isointensity, and infrequently remain at high signal intensity (Figure 4). This may suggest the differentiation of parenchymal changes due to cholangitis from abscesses, which remain at very high signal intensity on DWI using high b values. The causes for signal changes on DWI in the setting of acute inflammation have not been studied extensively. On DWI using low b values, signal changes in cholangitis are influenced by both perfusion and diffusion; perfusion effects may be attributed to vasodilatation involving both arterioles and capillary beds, leading to increase blood flow, and diffusion effects may be explained by increases in the size and numbers of inflammatory cells, leading to restriction of water molecules. However, when going to higher b values, the perfusion effect is decreased, leading to decreased signal intensity on DWI. Increased parenchymal signal intensity on DWI may be reversible after treatment, although further studies are needed to confirm this.
Hepatic abscesses are defined as intrahepatic single or multiple collections of pus within the liver. They result from infectious cholangitis and are usually seen in patients with suppurative cholangitis. Pyogenic abscesses have variable signal intensities on T1- and T2-weighted images. However, most lesions appear hypointense on T1-weighted images and hyperintense on T2-weighted images. Peripheral rim enhancement and transient hepatic intensity differences associated with abscesses can be seen after administration of gadolinium. Abscesses can be a life-threatening emergency if not recognized and treated promptly[24].
DWI is helpful in the early detection of abscesses and their differentiation from cystic or necrotic tumors. On DWI using high b values, abscesses appear hyperintense with low ADC values (Figure 5). This appearance is explained by the dense viscous content of the abscess and the presence of cellular infiltrates within the abscess. In comparison, cystic or necrotic tumors have a greater degree of signal attenuation on higher-b-value DWI and return higher ADC values[25].
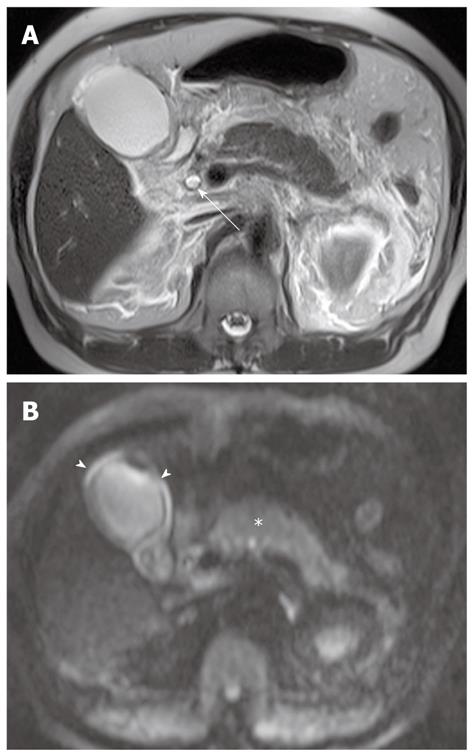
In a recent study, there was no difference in the ability to detect acute pancreatitis between DWI and computed tomography (CT)[26]. However, DWI can be useful to detect gallstone pancreatitis more clearly than can nonenhanced CT in the setting of contrast contraindications. Acute pancreatitis has restricted diffusion because of acute inflammation, and thus may appear as hyperintense on high-b-value DWI (Figure 6). Peripancreatic fluid usually has no restricted diffusion on high-b-value DWI, but infected fluid may have restricted diffusion. Signal changes in pancreatitis on DWI may be also reversible after treatment.
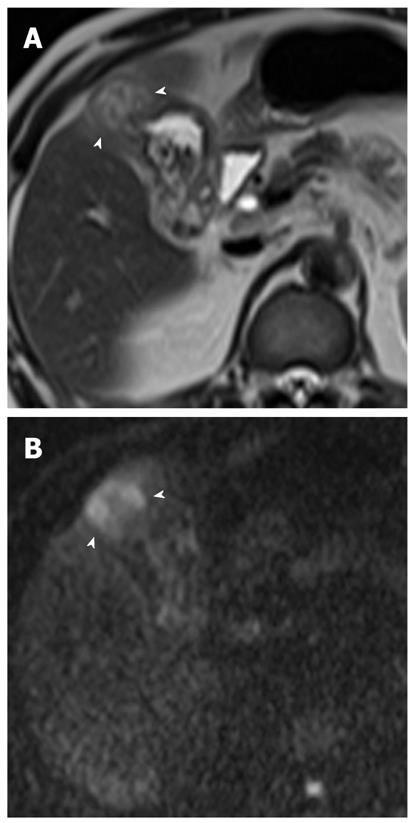
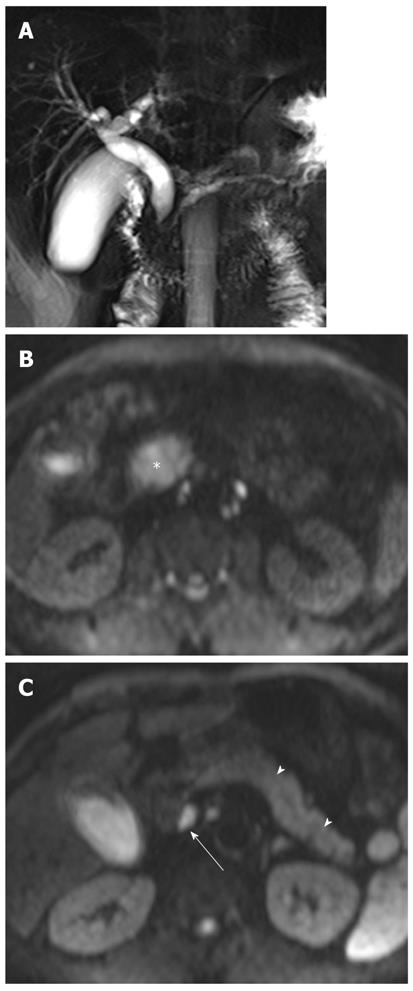
Cholecystitis: Cholecystitis is defined as inflammation of the gallbladder and is usually related to the presence of gallstones. In patients clinically suspected to have acute cholecystitis, ultrasonography (US) is usually favored as the initial imaging technique. CT and MRI usually provide morphological information similar to that provided by US, and can be performed initially if the clinical presentation is atypical. Increased wall enhancement of the gallbladder and increased pericholecystic hepatic parenchymal enhancement are frequent and specific CT and MRI findings of acute cholecystitis. In acute cholecystitis, the wall of the distended gallbladder is typically thickened due to inflammatory edema, inflammatory exudates, and hemorrhage[21]. DWI can provide additional important information in cholecystitis when added to conventional MRI or MRCP. On DWI using high b values, diffuse and symmetric hyperintensity in the wall of the gallbladder is seen in acute cholecystitis, because of restricted diffusion in the inflamed gallbladder wall (Figure 6). However, restricted diffusion in the gallbladder wall can be also seen in malignant lesions of the gallbladder.
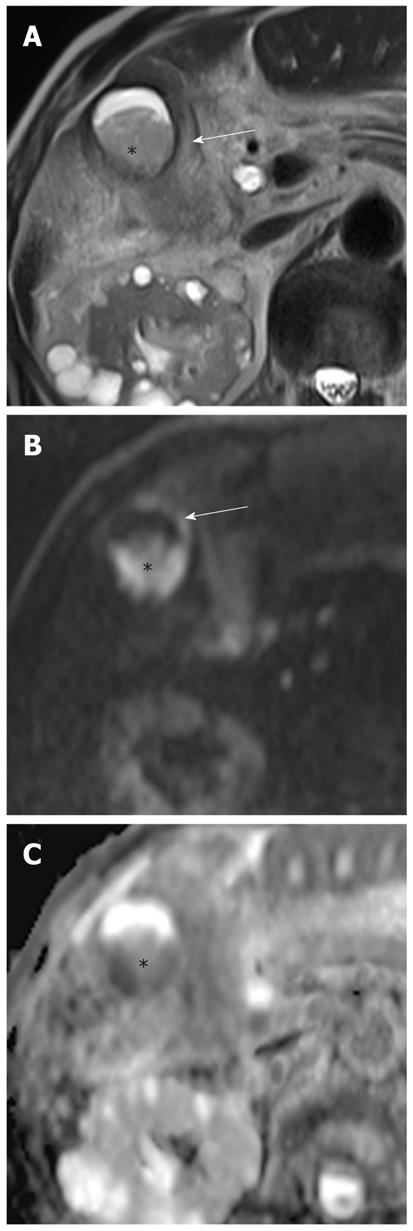
Pus in the gallbladder (empyema) occurs in approximately 2%-3% of patients with acute cholecystitis. Empyema carries a high risk of sepsis and perforation. Thus, urgent drainage or surgical resection with systemic antibiotic coverage is required as soon as the diagnosis is suspected. A diagnosis of empyema may be suggested by the identification of pus as a fluid-fluid level in the dependent portion of the gallbladder on T2-weighted images. However, a fluid-fluid level of the bile in the gallbladder is not specific for empyema; this can be seen in other conditions, such as concentrated bile, sludge, or hemobilia[21]. It has been reported that DWI is a reliable imaging technique for differentiating pyonephrosis from hydronephrosis. The pus in pyonephrosis has high viscosity and cellularity, thus leading to impeded diffusion and a low ADC value[27]. DWI findings of gallbladder empyema on DWI may be similar to those of pyonephrosis (Figure 7). Thus, DWI may be helpful in differentiating pus from concentrated bile, sludge, or hemobilia in the gallbladder.
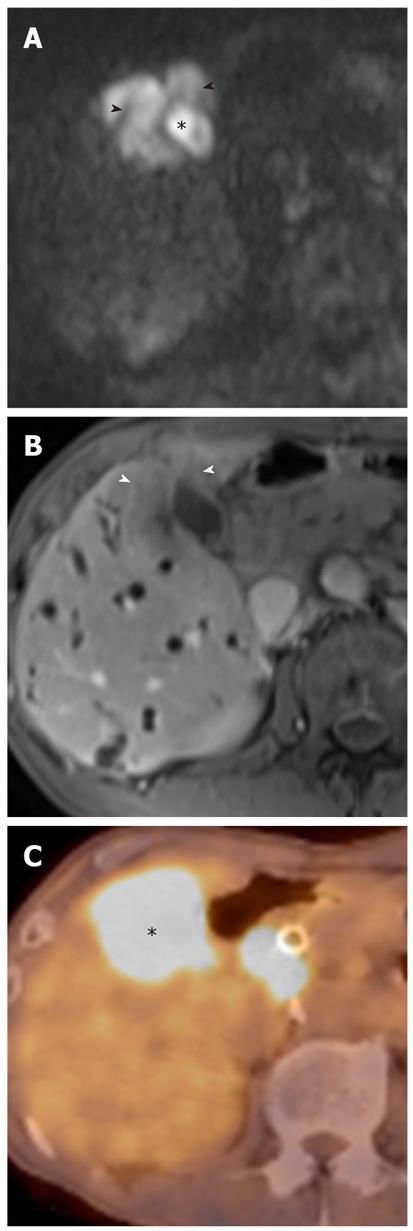
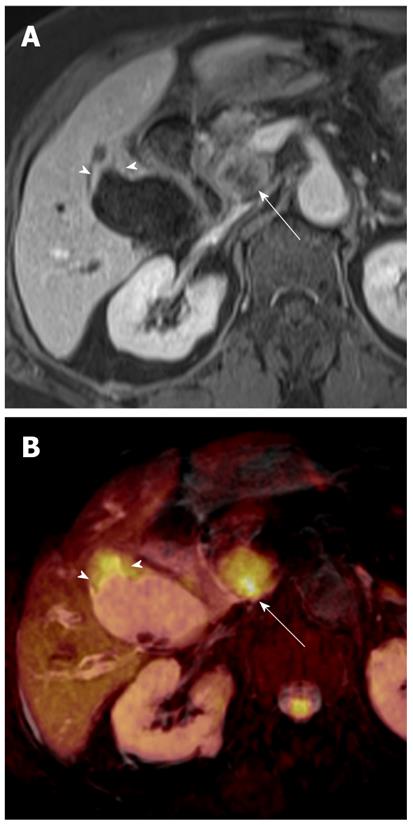
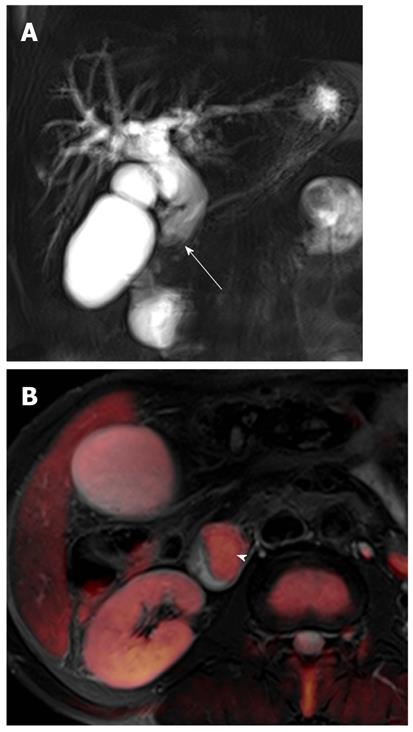
Gallbladder carcinoma: Imaging findings of focal or diffuse wall thickening or a mass replacing the gallbladder mimics the appearance of acute cholecystitis. DWI can be helpful in the diagnosis of gallbladder carcinoma, the detection of liver and lymph node metastasis, and differentiation from inflammatory conditions of the gallbladder. A hyperintense mass occupying the entire gallbladder lumen or focal and asymmetric high signal intensity in or around the gallbladder wall is more common in malignant lesions of the gallbladder (Figures 8 and 9)[28]. In contrast, diffuse and smooth high signal intensity in the wall of the gallbladder due to acute inflammation is more common in cholecystitis on DWI using high b values. In our experience, however, focal and irregular high signal intensities in the gallbladder wall on DWI are also seen in xanthogranulomatous cholecystitis and papillary adenomatous polyps (Figure 10). Thus, differentiating gallbladder carcinoma from some adenomatous polyps or xanthogranulomatous cholecystitis may be difficult, even with DWI. Additionally, the presence of associated findings on DWI, such as direct invasion of the liver or adjacent structures, hematogenous liver metastasis, and nodal metastasis, favor the diagnosis of gallbladder carcinoma rather than benign gallbladder lesions (Figures 8 and 9).
Depending on their sites of origin, cholangiocarcinoma is classified as intrahepatic or extrahepatic. Based on its growth pattern, it is also classified as mass-forming, periductal-infiltrating, or intraductal-growing type. Intrahepatic cholangiocarcinoma originates from second-order or greater peripheral branches of the intrahepatic bile duct. The mass-forming cholangiocarcinoma is the most common type of intrahepatic cholangiocarcinoma, but periductal-infiltrating and intraductal-growing intrahepatic cholangiocarcinoma is also seen[29,30].
Mass-forming intrahepatic cholangiocarcinoma appears as a single, predominantly homogeneous mass with well-circumscribed lobulated margins. Satellite nodules are frequent and vary in size. They usually appear as noncapsulated tumors, hypointense on T1-weighted images, and mild-to-moderately hyperintense on T2-weighted images, depending on the amount of fibrous tissue, necrosis, and mucin content. Dynamic-enhanced MRI reveals minimal-to-moderate initial peripheral rim enhancement followed by progressive and concentric incomplete filling of the tumor with contrast material[29].
In several studies, DWI is useful for detection of focal hepatic lesions, differentiation of cystic and solid hepatic lesions, and differentiation of benign and malignant focal hepatic lesions[4,19,31]. In one investigation using two b values (0 and 500 s/mm2), there were significant differences between the ADCs of benign and malignant focal hepatic lesions (2.45 ± 0.96 × 10⁻³ and 1.08 ± 0.50 × 10⁻³ mm2/s for b = 0 and 500 s/mm2, respectively; P < 0.001), although there was some overlap[4].
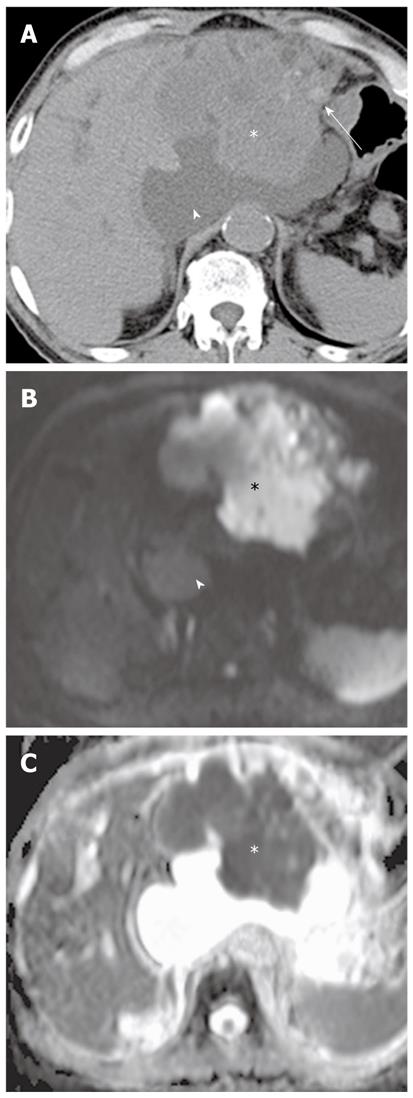
Mass-forming intrahepatic cholangiocarcinoma is usually large, achieving a diameter of up to 15 cm because early symptoms are rarely present. Thus, it is readily depicted on DWI and remains hyperintense on DWI using high b values with low ADC values; similar to values of other malignant focal hepatic lesions (Figure 11). Central hypointensity of the mass lesion may be seen on T2-weighted images and DWI using high b values, which may reflect fibrotic tissue in the central portion of the tumor. Peripheral hyperintensity can be demonstrated on DWI using high b values, corresponding to the more highly cellular region. As mentioned earlier, it is, however, difficult to distinguish mass-forming intrahepatic cholangiocarcinoma, hepatocellular carcinoma (HCC), and metastasis. Thus, DWI should be used along with conventional MRI sequences, such as dynamic-enhanced MRI, to differentiate mass-forming intrahepatic cholangiocarcinoma from other hepatic malignancies.
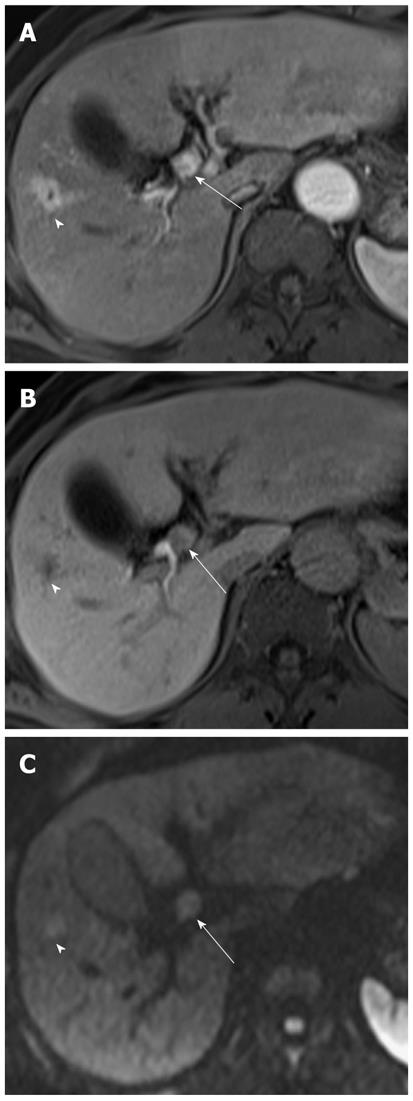
Cholangiocarcinoma tends to occur in atrophied or heavily stone-burdened segments. On cross-sectional images, it is difficult to diagnose cholangiocarcinoma associated with hepatolithiasis. A diagnosis of cholangiocarcinoma associated with hepatolithiasis should be considered when a mass involving or surrounding the bile duct is seen, or when focal nodular biliary wall thickening with increased enhancement is present in the region of the stricture[32]. DWI using high b values can be useful for the detection of cholangiocarcinoma associated with hepatolithiasis (Figure 11).
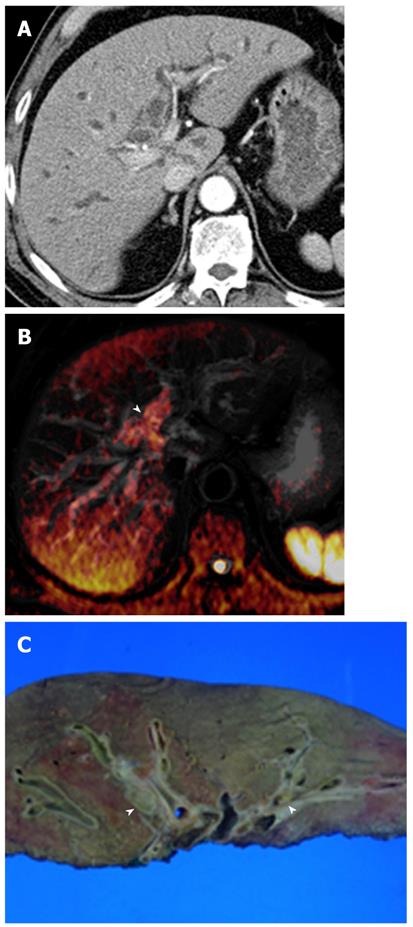
Diffuse periductal thickening along the bile duct in the periductal-infiltrating type, causing mild-to-marked bile duct dilatation, is seen in intrahepatic cholangiocarcinoma[29]. DWI may be helpful for the detection of malignant bile duct lesions causing a variable degree of intrahepatic bile duct dilatation, as well as for differentiating between intrahepatic malignant and benign bile duct lesions (Figure 12).
Intraductal-growing cholangiocarcinoma appears as hyperintense intraluminal filling defects on DWI using high b values with low ADC values (Figure 13). However, detection of small malignant bile duct lesions is limited on DWI because tumor detection with DWI is affected by variable causes, such as low spatial resolution of higher-b-value DWI, tumor cellularity, bowel peristalsis, and artifacts.
Invasion of the intrahepatic bile duct is infrequent in HCC, and seen in approximately 3.3%-9.0% of cases[33]. Obstruction of the bile duct in patients with HCC is caused by invasion of the intrahepatic bile duct, blood clots from the tumor, and tumor fragments. HCC with bile duct tumor thrombi can be distinguished from hematomas in the bile duct based on the presence of mass enhancement on dynamic-enhanced CT or MRI[34,35]. DWI can be useful for the differentiation of HCC and bile duct tumor thrombi from blood clots within the bile on the basis of identification of restricted diffusion of the mass lesion in the bile duct. They appear as hyperintense intraluminal filling defects on DWI using high b values with low ADC values (Figure 14). However, because imaging findings of HCC with bile duct thrombi are similar to those of intraductal-growing cholangiocarcinoma, conventional MRI findings of a mass outside the ductal system, hypervascularity on dynamic imaging, and underlying cirrhosis favor the diagnosis of HCC with bile duct tumor thrombi rather than intraductal cholangiocarcinoma.
Approximately two-thirds of extrahepatic bile duct cancer arises at the hepatic hilum (known as hilar cholangiocarcinoma or Klatskin tumor), and approximately one-third originates from the distal common bile duct. The most common pattern of tumor growth is focal infiltration of the ductal wall or the periductal-infiltrating type, resulting in focal strictures. Other tumor growth patterns include the mass-forming and intraductal-growing types[29].
Extrahepatic bile duct carcinoma causes varying degrees of upstream bile duct dilatation. MRCP is highly accurate in identifying the presence and level of bile duct obstruction. Although differentiation between benign and malignant biliary lesions by MRCP is sometimes difficult, inspection of the bile duct lumen and wall on thin-section images helps to identify malignancies, which often cause an eccentric, abrupt change in the bile duct caliber, with irregular shouldering at the transition point from large obstructed to small-caliber decompressed ducts. Benign strictures tend to show short-segment involvement with smooth, gradual, and concentric narrowing[36].
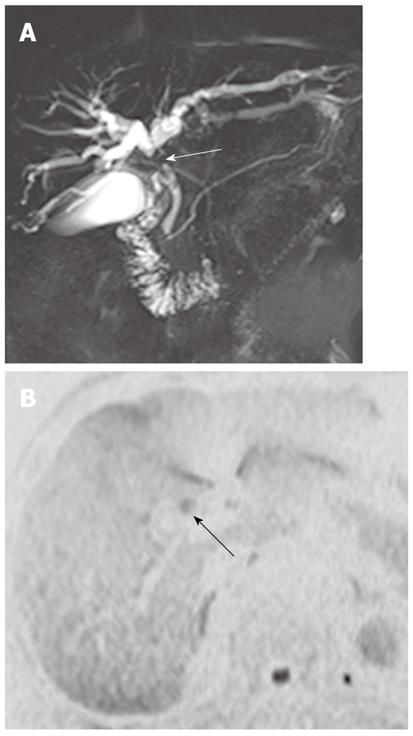
It has been reported that DWI is useful for the detection of extrahepatic cholangiocarcinoma and differentiation between malignant and benign biliary lesions. In a study using two b values (0 s/mm2 and 500 s/mm2), the sensitivity, specificity and accuracy of the detection of extrahepatic carcinoma were 94.3%, 100% and 96.4%, respectively[10]. On DWI using high b values, a high signal intensity with a low ADC value at the transition point from large obstructed to small-caliber decompressed ducts is a highly suggestive finding for malignant, rather than benign, biliary lesions because benign lesions usually show no hyper- or isointensity to the surrounding structures in the transitional area (Figure 15). Thus, this finding can be a clue for differentiating between malignant and benign biliary lesions. However, there is some degree of overlap; benign active inflammatory conditions rarely have hyperintensity, and some malignant lesions are not demonstrated on DWI using high b values[10].
Pancreatic carcinoma, cholangiocarcinoma, or chronic pancreatitis should be considered when a bile duct stricture is limited to the distal (intrapancreatic) common bile duct. Pancreatitis remains difficult to distinguish from pancreatic carcinoma on the basis of MRI findings, particularly in cases of acute or chronic mass-forming pancreatitis, because both appear as hypointense masses or mass-like lesions in the pancreas on T1-weighted images and are associated with ductal obstruction[37].
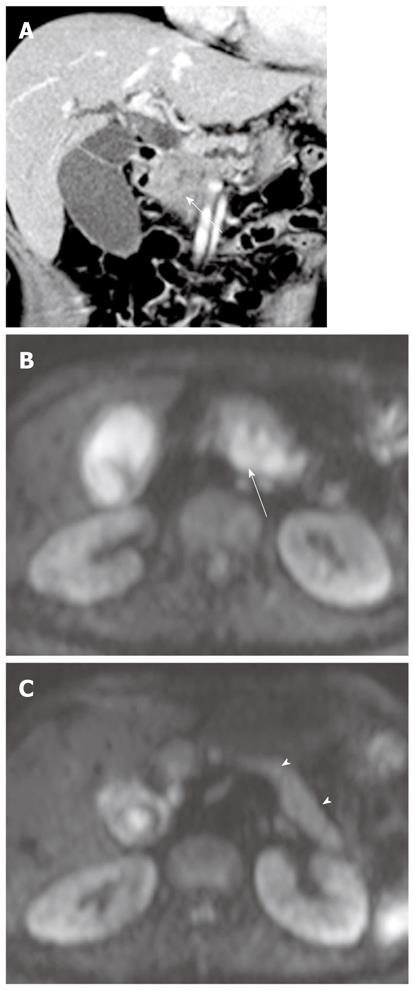
In a study using b values (0 s/mm2 and 600 s/mm2), DWI is helpful in detecting focal pancreatic lesions and differentiating between pancreatic carcinoma and mass-forming pancreatitis. Mass-forming pancreatitis has either lower or higher ADC values than pancreatic carcinoma, but ultimately follows the ADC values of the remaining pancreatic parenchyma, whereas the focal lesion in pancreatic carcinoma is invariably lower than the remaining parenchyma (Figures 16 and 17)[7]. In a study using a high b value (1000 s/mm2), the sensitivity and specificity for the detection of pancreatic adenocarcinoma was 96.2% and 98.6%, respectively[38]. ADC values in pancreatic carcinoma tend to be lower than in the normal pancreas in most studies, although there is some degree of overlap[7,38]. Pancreatic carcinoma invokes a fibrotic response similar to desmoplastic reaction, therefore, ADC values are correlated with the degree of fibrosis; the ADC value of pancreatic carcinoma with loose fibrosis is higher than that of pancreatic carcinoma with dense fibrosis[39]. In a recent study, ADC at lower b values (< 500 s/mm2) was higher in mass-forming pancreatitis than in pancreatic carcinoma, whereas ADC at high b values was not significantly different between mass-forming pancreatitis and pancreatic carcinoma[17]. This was attributed to increasing perfusion effects at lower b values, which was correlated with high vascularity in chronic pancreatitis. Thus, DWI alone is suboptimal for the differentiation of pancreatic masses and mass-like lesions, and should be interpreted in conjunction with conventional MRI.
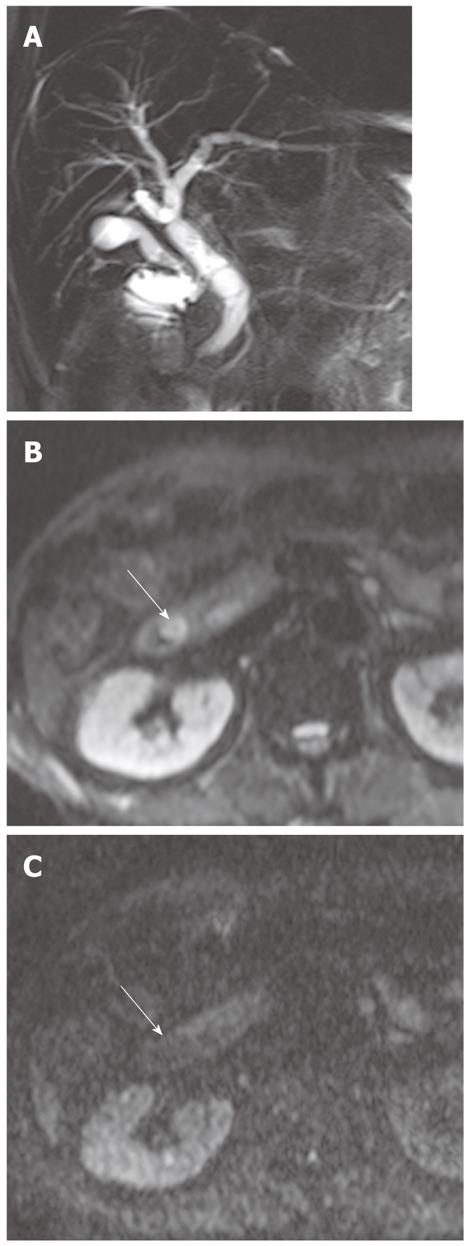
Periampullary lesions have one or more of the following MRI features: the presence of biliary dilatation at the level of the ampulla of Vater with or without a dilated pancreatic duct, bulging of the papilla, a mass lesion in or around the ampulla of Vater, and abnormal enhancement of the papilla. It is not always easy to distinguish between neoplastic and non-neoplastic conditions in or around the ampulla of Vater using conventional MRI, because of the confusing or overlapping findings[40].
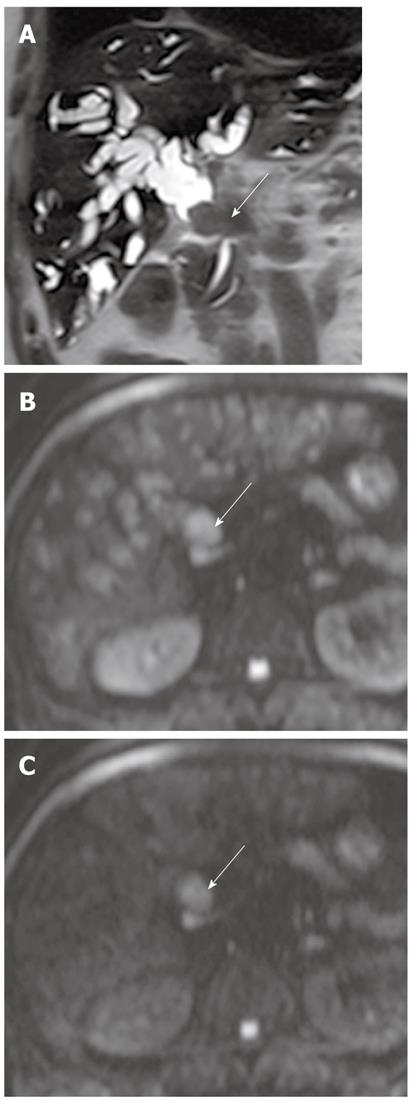
In our experience, ampullary or periampullary carcinoma displays mild-to-moderately high signal intensity on DWI using high b values with low ADC values, reflecting the high cellularity of tumors, whereas benign lesions, such as sphincter of Oddi dysfunction or papillary stenosis, show no high signal intensity in or around the ampulla of Vater (Figures 18 and 19). Thus, DWI can be helpful for detecting highly cellular malignant lesions and distinguishing between malignant and benign conditions in or around the ampulla of Vater. However, as mentioned earlier, some small malignant lesions in or around the ampulla of Vater are not identified on DWI using high b values.
DWI is susceptible to a variety of artifacts that arise from motion, use of strong gradient pulses, and EPI technique. Physiological motion artifacts such as respiratory motion, cardiac pulsation, movement of the diaphragm, and motility of the bowel lead to ghosting images and blurring. The pulsatile motion of the heart and aorta obscure or diminish visualization of and increase ADC in the left lobe of the liver. These artifacts can be overcome using respiratory or electrocardiographic triggering. The EPI technique produces a low spatial resolution and signal-to-noise ratio. The rapid on-and-off switching of the high-intensity gradient field easily produce eddy currents, leading to geometrical distortion and image shearing artifacts that may become more pronounced with increased b values. DWI is also highly sensitive to magnetic field inhomogeneity. Susceptibility artifacts caused by field inhomogeneity are prevalent at air-tissue interfaces or around tissue-metal interfaces[13,41].
Although restricted diffusion is generally considered to be associated with malignant lesions, some malignant lesions may not be detected on DWI. Some malignant tumors are too small for the DWI signal change to be obvious, or restriction to water diffusion is likely to be limited in malignant tumors with low cellularity, such as tumors with large cystic components. In contrast, some benign lesions sometimes exhibit restricted diffusion on imaging with high b values. The highly cellular tissue in reactive lymph nodes may show restricted diffusion (Figure 17). Thus, the role of DWI and ADC in distinguishing between benign and malignant lymph nodes remains unclear[42]. Additionally, diffusion of water in hematoma may be significantly restricted. Decreased ADC values in hemorrhage with intact red blood cell (RBC) membranes (i.e., hyperacute, acute, and early subacute hematoma) and increased ADCs after lysis of RBC membranes (i.e., ‘‘free’’ methemoglobin in subacute-to-chronic hematoma) have been reported (Figure 20). This may be mistaken for malignant lesions on DWI or the ADC map, causing erroneous detection or characterization of lesions[43].
Thus, the radiologists have to be aware of potential pitfalls and limitation of the technique, and it should be kept in mind that DWI should be interpreted in conjunction with other conventional MRI.
DWI results for evaluating biliopancreatic diseases are still preliminary, and further studies are needed to determine its performance in the biliopancreatic tract. Additionally, correlation of DWI with pathological findings is required to define better the pathophysiology of various biliopancreatic diseases. Nevertheless, DWI can complement morphological information obtained by conventional MRCP by providing additional functional information concerning the alteration of tissue cellularity due to pathological processes. The detection of abnormal lesions and the differentiation of malignant from benign tumor-like lesions in the biliopancreatic tract can be improved by combined evaluation using both DWI and conventional MRI (Table 1). Moreover, DWI can be a reasonable alternative technique for the assessment of the biliopancreatic tract in the setting of a contraindication to contrast agents such as renal insufficiency or contrast allergy.
| Categories | Diagnosis | Characteristic DWI features |
| DWI for the evaluation of gallstone-related complications | Acute cholangitis | Hyperintense parenchyma on low b values usually returns to isointense on high b values |
| Hepatic abscess | Hyperintense on high b values with low ADC values | |
| Acute pancreatitis | Hyperintense on high b values | |
| DWI for the characterization and diagnosis of gallbladder lesions | Cholecystitis | Diffuse and symmetric hyperintensity in the gallbladder wall on high b values Pus in the dependent portion: hyperintense on high b values with low ADC values |
| Gallbladder carcinoma | Hyperintense mass occupying the entire gallbladder lumen or focal and asymmetric hyperintensity in or around the gallbladder wall on high b values | |
| DWI for the characterization of intrahepatic biliary lesions and diagnosis of malignant lesions in the intrahepatic bile duct | Mass-forming cholangiocarcinoma | Hyperintense on high b values with low ADC values, similar to that of other malignant hepatic masses |
| Periductal-infiltrative cholangiocarcinoma | Hyperintense periductal thickening along the bile duct on high b values with low ADC values | |
| Intraductal-growing cholangiocarcinoma | Hyperintense intraluminal filling defect on high b values with low ADC values | |
| HCC with bile duct thrombi | Similar to that of intraductal-growing cholangiocarcinoma | |
| DWI for characterization of extrahepatic biliary lesions and diagnosis of malignant lesions in the extrahepatic bile duct | Extrahepatic cholangiocarcinoma | Hyperintense on high b values with low ADC values, at the transition point from large obstructed to small-caliber decompressed ducts |
| Pancreatic carcinoma | Lower ADC values than those of the remaining pancreas | |
| Mass-forming pancreatitis | Similar ADC values to those of remaining pancreas | |
| Ampullary or periampullary carcinoma | Mild to moderate hyperintensity in or around ampulla of Vater on high b values with low ADC values | |
| Sphincter Oddi dysfunction or papillary stenosis | Isointensity in or around ampulla of vater on high b values |
Peer reviewer: Xiao-Peng Zhang, Professor, Department of Radiology, Beijing Cancer Hospital and Institute, Peking University School of Oncology, No.52 Haidian District, Beijing 100142, China
S-Editor Gou SX L-Editor Kerr C E-Editor Zhang DN
| 1. | Koh DM, Collins DJ. Diffusion-weighted MRI in the body: applications and challenges in oncology. AJR Am J Roentgenol. 2007;188:1622-1635. [RCA] [PubMed] [DOI] [Full Text] [Cited by in Crossref: 1418] [Cited by in RCA: 1461] [Article Influence: 81.2] [Reference Citation Analysis (0)] |
| 2. | Qayyum A. Diffusion-weighted imaging in the abdomen and pelvis: concepts and applications. Radiographics. 2009;29:1797-1810. [RCA] [PubMed] [DOI] [Full Text] [Cited by in Crossref: 248] [Cited by in RCA: 262] [Article Influence: 17.5] [Reference Citation Analysis (0)] |
| 3. | Thoeny HC, De Keyzer F. Extracranial applications of diffusion-weighted magnetic resonance imaging. Eur Radiol. 2007;17:1385-1393. [RCA] [PubMed] [DOI] [Full Text] [Cited by in Crossref: 210] [Cited by in RCA: 203] [Article Influence: 11.3] [Reference Citation Analysis (0)] |
| 4. | Taouli B, Vilgrain V, Dumont E, Daire JL, Fan B, Menu Y. Evaluation of liver diffusion isotropy and characterization of focal hepatic lesions with two single-shot echo-planar MR imaging sequences: prospective study in 66 patients. Radiology. 2003;226:71-78. [RCA] [PubMed] [DOI] [Full Text] [Cited by in Crossref: 463] [Cited by in RCA: 446] [Article Influence: 20.3] [Reference Citation Analysis (0)] |
| 5. | Parikh T, Drew SJ, Lee VS, Wong S, Hecht EM, Babb JS, Taouli B. Focal liver lesion detection and characterization with diffusion-weighted MR imaging: comparison with standard breath-hold T2-weighted imaging. Radiology. 2008;246:812-822. [RCA] [PubMed] [DOI] [Full Text] [Cited by in Crossref: 427] [Cited by in RCA: 415] [Article Influence: 24.4] [Reference Citation Analysis (0)] |
| 6. | Matsuki M, Inada Y, Nakai G, Tatsugami F, Tanikake M, Narabayashi I, Masuda D, Arisaka Y, Takaori K, Tanigawa N. Diffusion-weighed MR imaging of pancreatic carcinoma. Abdom Imaging. 2007;32:481-483. [RCA] [PubMed] [DOI] [Full Text] [Cited by in Crossref: 118] [Cited by in RCA: 113] [Article Influence: 6.6] [Reference Citation Analysis (0)] |
| 7. | Fattahi R, Balci NC, Perman WH, Hsueh EC, Alkaade S, Havlioglu N, Burton FR. Pancreatic diffusion-weighted imaging (DWI): comparison between mass-forming focal pancreatitis (FP), pancreatic cancer (PC), and normal pancreas. J Magn Reson Imaging. 2009;29:350-356. [RCA] [PubMed] [DOI] [Full Text] [Cited by in Crossref: 147] [Cited by in RCA: 150] [Article Influence: 9.4] [Reference Citation Analysis (0)] |
| 8. | Saremi F, Knoll AN, Bendavid OJ, Schultze-Haakh H, Narula N, Sarlati F. Characterization of genitourinary lesions with diffusion-weighted imaging. Radiographics. 2009;29:1295-1317. [RCA] [PubMed] [DOI] [Full Text] [Cited by in Crossref: 37] [Cited by in RCA: 43] [Article Influence: 2.7] [Reference Citation Analysis (0)] |
| 9. | Zhang J, Tehrani YM, Wang L, Ishill NM, Schwartz LH, Hricak H. Renal masses: characterization with diffusion-weighted MR imaging--a preliminary experience. Radiology. 2008;247:458-464. [RCA] [PubMed] [DOI] [Full Text] [Cited by in Crossref: 161] [Cited by in RCA: 166] [Article Influence: 9.8] [Reference Citation Analysis (0)] |
| 10. | Cui XY, Chen HW. Role of diffusion-weighted magnetic resonance imaging in the diagnosis of extrahepatic cholangiocarcinoma. World J Gastroenterol. 2010;16:3196-3201. [RCA] [PubMed] [DOI] [Full Text] [Full Text (PDF)] [Cited by in CrossRef: 47] [Cited by in RCA: 45] [Article Influence: 3.0] [Reference Citation Analysis (0)] |
| 11. | Patterson DM, Padhani AR, Collins DJ. Technology insight: water diffusion MRI--a potential new biomarker of response to cancer therapy. Nat Clin Pract Oncol. 2008;5:220-233. [RCA] [PubMed] [DOI] [Full Text] [Cited by in Crossref: 276] [Cited by in RCA: 290] [Article Influence: 17.1] [Reference Citation Analysis (0)] |
| 12. | Whittaker CS, Coady A, Culver L, Rustin G, Padwick M, Padhani AR. Diffusion-weighted MR imaging of female pelvic tumors: a pictorial review. Radiographics. 2009;29:759-774; discussion 774-778. [RCA] [PubMed] [DOI] [Full Text] [Cited by in Crossref: 141] [Cited by in RCA: 125] [Article Influence: 7.8] [Reference Citation Analysis (0)] |
| 13. | Koh DM, Takahara T, Imai Y, Collins DJ. Practical aspects of assessing tumors using clinical diffusion-weighted imaging in the body. Magn Reson Med Sci. 2007;6:211-224. [RCA] [PubMed] [DOI] [Full Text] [Cited by in Crossref: 169] [Cited by in RCA: 158] [Article Influence: 9.3] [Reference Citation Analysis (0)] |
| 14. | Kandpal H, Sharma R, Madhusudhan KS, Kapoor KS. Respiratory-triggered versus breath-hold diffusion-weighted MRI of liver lesions: comparison of image quality and apparent diffusion coefficient values. AJR Am J Roentgenol. 2009;192:915-922. [RCA] [PubMed] [DOI] [Full Text] [Cited by in Crossref: 154] [Cited by in RCA: 161] [Article Influence: 10.1] [Reference Citation Analysis (0)] |
| 15. | Chiu FY, Jao JC, Chen CY, Liu GC, Jaw TS, Chiou YY, Hsu FO, Hsu JS. Effect of intravenous gadolinium-DTPA on diffusion-weighted magnetic resonance images for evaluation of focal hepatic lesions. J Comput Assist Tomogr. 2005;29:176-180. [RCA] [PubMed] [DOI] [Full Text] [Cited by in Crossref: 55] [Cited by in RCA: 54] [Article Influence: 2.7] [Reference Citation Analysis (0)] |
| 16. | Thoeny HC, De Keyzer F, Oyen RH, Peeters RR. Diffusion-weighted MR imaging of kidneys in healthy volunteers and patients with parenchymal diseases: initial experience. Radiology. 2005;235:911-917. [RCA] [PubMed] [DOI] [Full Text] [Cited by in Crossref: 321] [Cited by in RCA: 308] [Article Influence: 15.4] [Reference Citation Analysis (0)] |
| 17. | Klauss M, Lemke A, Grünberg K, Simon D, Re TJ, Wente MN, Laun FB, Kauczor HU, Delorme S, Grenacher L. Intravoxel incoherent motion MRI for the differentiation between mass forming chronic pancreatitis and pancreatic carcinoma. Invest Radiol. 2011;46:57-63. [RCA] [PubMed] [DOI] [Full Text] [Cited by in Crossref: 114] [Cited by in RCA: 115] [Article Influence: 8.2] [Reference Citation Analysis (0)] |
| 18. | Yoshikawa T, Kawamitsu H, Mitchell DG, Ohno Y, Ku Y, Seo Y, Fujii M, Sugimura K. ADC measurement of abdominal organs and lesions using parallel imaging technique. AJR Am J Roentgenol. 2006;187:1521-1530. [RCA] [PubMed] [DOI] [Full Text] [Cited by in Crossref: 236] [Cited by in RCA: 240] [Article Influence: 12.6] [Reference Citation Analysis (0)] |
| 19. | Bruegel M, Holzapfel K, Gaa J, Woertler K, Waldt S, Kiefer B, Stemmer A, Ganter C, Rummeny EJ. Characterization of focal liver lesions by ADC measurements using a respiratory triggered diffusion-weighted single-shot echo-planar MR imaging technique. Eur Radiol. 2008;18:477-485. [PubMed] |
| 20. | Kim T, Murakami T, Takahashi S, Hori M, Tsuda K, Nakamura H. Diffusion-weighted single-shot echoplanar MR imaging for liver disease. AJR Am J Roentgenol. 1999;173:393-398. [PubMed] |
| 21. | Watanabe Y, Nagayama M, Okumura A, Amoh Y, Katsube T, Suga T, Koyama S, Nakatani K, Dodo Y. MR imaging of acute biliary disorders. Radiographics. 2007;27:477-495. [RCA] [PubMed] [DOI] [Full Text] [Cited by in Crossref: 109] [Cited by in RCA: 86] [Article Influence: 4.8] [Reference Citation Analysis (0)] |
| 22. | Bader TR, Braga L, Beavers KL, Semelka RC. MR imaging findings of infectious cholangitis. Magn Reson Imaging. 2001;19:781-788. [RCA] [PubMed] [DOI] [Full Text] [Cited by in Crossref: 47] [Cited by in RCA: 48] [Article Influence: 2.0] [Reference Citation Analysis (0)] |
| 23. | Hussain SM, De Becker J, Hop WC, Dwarkasing S, Wielopolski PA. Can a single-shot black-blood T2-weighted spin-echo echo-planar imaging sequence with sensitivity encoding replace the respiratory-triggered turbo spin-echo sequence for the liver? An optimization and feasibility study. J Magn Reson Imaging. 2005;21:219-229. [RCA] [PubMed] [DOI] [Full Text] [Cited by in Crossref: 67] [Cited by in RCA: 62] [Article Influence: 3.1] [Reference Citation Analysis (0)] |
| 24. | Méndez RJ, Schiebler ML, Outwater EK, Kressel HY. Hepatic abscesses: MR imaging findings. Radiology. 1994;190:431-436. [PubMed] |
| 25. | Chan JH, Tsui EY, Luk SH, Fung AS, Yuen MK, Szeto ML, Cheung YK, Wong KP. Diffusion-weighted MR imaging of the liver: distinguishing hepatic abscess from cystic or necrotic tumor. Abdom Imaging. 2001;26:161-165. [RCA] [PubMed] [DOI] [Full Text] [Cited by in Crossref: 150] [Cited by in RCA: 135] [Article Influence: 5.6] [Reference Citation Analysis (0)] |
| 26. | Shinya S, Sasaki T, Nakagawa Y, Guiquing Z, Yamamoto F, Yamashita Y. The efficacy of diffusion-weighted imaging for the detection and evaluation of acute pancreatitis. Hepatogastroenterology. 2009;56:1407-1410. [PubMed] |
| 27. | Chan JH, Tsui EY, Luk SH, Fung SL, Cheung YK, Chan MS, Yuen MK, Mak SF, Wong KP. MR diffusion-weighted imaging of kidney: differentiation between hydronephrosis and pyonephrosis. Clin Imaging. 2001;25:110-113. [RCA] [PubMed] [DOI] [Full Text] [Cited by in Crossref: 105] [Cited by in RCA: 88] [Article Influence: 3.7] [Reference Citation Analysis (0)] |
| 28. | Sugita R, Yamazaki T, Furuta A, Itoh K, Fujita N, Takahashi S. High b-value diffusion-weighted MRI for detecting gallbladder carcinoma: preliminary study and results. Eur Radiol. 2009;19:1794-1798. [RCA] [PubMed] [DOI] [Full Text] [Cited by in Crossref: 43] [Cited by in RCA: 46] [Article Influence: 2.9] [Reference Citation Analysis (0)] |
| 29. | Chung YE, Kim MJ, Park YN, Choi JY, Pyo JY, Kim YC, Cho HJ, Kim KA, Choi SY. Varying appearances of cholangiocarcinoma: radiologic-pathologic correlation. Radiographics. 2009;29:683-700. [RCA] [PubMed] [DOI] [Full Text] [Cited by in Crossref: 286] [Cited by in RCA: 275] [Article Influence: 17.2] [Reference Citation Analysis (0)] |
| 30. | Lim JH. Cholangiocarcinoma: morphologic classification according to growth pattern and imaging findings. AJR Am J Roentgenol. 2003;181:819-827. [PubMed] |
| 31. | Moteki T, Horikoshi H, Oya N, Aoki J, Endo K. Evaluation of hepatic lesions and hepatic parenchyma using diffusion-weighted reordered turboFLASH magnetic resonance images. J Magn Reson Imaging. 2002;15:564-572. [RCA] [PubMed] [DOI] [Full Text] [Cited by in Crossref: 41] [Cited by in RCA: 43] [Article Influence: 1.9] [Reference Citation Analysis (0)] |
| 32. | Park HS, Lee JM, Kim SH, Jeong JY, Kim YJ, Lee KH, Choi SH, Han JK, Choi BI. CT Differentiation of cholangiocarcinoma from periductal fibrosis in patients with hepatolithiasis. AJR Am J Roentgenol. 2006;187:445-453. [RCA] [PubMed] [DOI] [Full Text] [Cited by in Crossref: 34] [Cited by in RCA: 32] [Article Influence: 1.7] [Reference Citation Analysis (0)] |
| 33. | Wang HJ, Kim JH, Kim JH, Kim WH, Kim MW. Hepatocellular carcinoma with tumor thrombi in the bile duct. Hepatogastroenterology. 1999;46:2495-2499. [PubMed] |
| 34. | Jung AY, Lee JM, Choi SH, Kim SH, Lee JY, Kim SW, Han JK, Choi BI. CT features of an intraductal polypoid mass: Differentiation between hepatocellular carcinoma with bile duct tumor invasion and intraductal papillary cholangiocarcinoma. J Comput Assist Tomogr. 2006;30:173-181. [RCA] [PubMed] [DOI] [Full Text] [Cited by in Crossref: 28] [Cited by in RCA: 26] [Article Influence: 1.4] [Reference Citation Analysis (0)] |
| 35. | Gabata T, Terayama N, Kobayashi S, Sanada J, Kadoya M, Matsui O. MR imaging of hepatocellular carcinomas with biliary tumor thrombi. Abdom Imaging. 2007;32:470-474. [RCA] [PubMed] [DOI] [Full Text] [Cited by in Crossref: 14] [Cited by in RCA: 11] [Article Influence: 0.6] [Reference Citation Analysis (0)] |
| 36. | Park MS, Kim TK, Kim KW, Park SW, Lee JK, Kim JS, Lee JH, Kim KA, Kim AY, Kim PN. Differentiation of extrahepatic bile duct cholangiocarcinoma from benign stricture: findings at MRCP versus ERCP. Radiology. 2004;233:234-240. [RCA] [PubMed] [DOI] [Full Text] [Cited by in Crossref: 192] [Cited by in RCA: 170] [Article Influence: 8.1] [Reference Citation Analysis (0)] |
| 37. | Johnson PT, Outwater EK. Pancreatic carcinoma versus chronic pancreatitis: dynamic MR imaging. Radiology. 1999;212:213-218. [PubMed] |
| 38. | Ichikawa T, Erturk SM, Motosugi U, Sou H, Iino H, Araki T, Fujii H. High-b value diffusion-weighted MRI for detecting pancreatic adenocarcinoma: preliminary results. AJR Am J Roentgenol. 2007;188:409-414. [RCA] [PubMed] [DOI] [Full Text] [Cited by in Crossref: 195] [Cited by in RCA: 194] [Article Influence: 10.8] [Reference Citation Analysis (0)] |
| 39. | Muraoka N, Uematsu H, Kimura H, Imamura Y, Fujiwara Y, Murakami M, Yamaguchi A, Itoh H. Apparent diffusion coefficient in pancreatic cancer: characterization and histopathological correlations. J Magn Reson Imaging. 2008;27:1302-1308. [RCA] [PubMed] [DOI] [Full Text] [Cited by in Crossref: 136] [Cited by in RCA: 138] [Article Influence: 8.1] [Reference Citation Analysis (0)] |
| 40. | Kim TU, Kim S, Lee JW, Woo SK, Lee TH, Choo KS, Kim CW, Kim GH, Kang DH. Ampulla of Vater: comprehensive anatomy, MR imaging of pathologic conditions, and correlation with endoscopy. Eur J Radiol. 2008;66:48-64. [RCA] [PubMed] [DOI] [Full Text] [Cited by in Crossref: 47] [Cited by in RCA: 39] [Article Influence: 2.3] [Reference Citation Analysis (0)] |
| 41. | Le Bihan D, Poupon C, Amadon A, Lethimonnier F. Artifacts and pitfalls in diffusion MRI. J Magn Reson Imaging. 2006;24:478-488. [RCA] [PubMed] [DOI] [Full Text] [Cited by in Crossref: 538] [Cited by in RCA: 560] [Article Influence: 29.5] [Reference Citation Analysis (0)] |
| 42. | Feuerlein S, Pauls S, Juchems MS, Stuber T, Hoffmann MH, Brambs HJ, Ernst AS. Pitfalls in abdominal diffusion-weighted imaging: how predictive is restricted water diffusion for malignancy. AJR Am J Roentgenol. 2009;193:1070-1076. [RCA] [PubMed] [DOI] [Full Text] [Cited by in Crossref: 76] [Cited by in RCA: 75] [Article Influence: 4.7] [Reference Citation Analysis (0)] |
| 43. | Atlas SW, DuBois P, Singer MB, Lu D. Diffusion measurements in intracranial hematomas: implications for MR imaging of acute stroke. AJNR Am J Neuroradiol. 2000;21:1190-1194. [PubMed] |


