Published online Jul 14, 2009. doi: 10.3748/wjg.15.3298
Revised: April 18, 2009
Accepted: April 25, 2009
Published online: July 14, 2009
AIM: To study the liver and spleen volume variations in hepatic fibrosis patients at different histopathological stages.
METHODS: Multidetector computed tomography (MDCT) scan was performed in 85 hepatic fibrosis patients. Liver volume (LV) and spleen volume (SV) were measured. Fifteen healthy individuals served as a control group (S0). The patients were divided into stage 1 (S1) group (n = 34), stage 2 (S2) group (n = 25), stage 3 (S3) group (n = 16), and stage 4 (S4) group (n = 10) according to their histopathological stage of liver fibrosis.
RESULTS: The LV and standard LV(SLV)had a tendency to increase with the severity of fibrosis, but no statistical difference was observed in the 5 groups (LV: F = 0.245, P = 0.912; SLV: F = 1.902, P = 0.116). The SV was gradually increased with the severity of fibrosis, and a statistically significant difference in SV was observed among the 5 groups (P < 0.01). The LV/SV ratio and SLV/SV ratio were gradually decreased with the aggravation of hepatic fibrosis, and statistically significant differences in both LV/SV and SLV/SV were found among the 5 groups (P < 0.01).
CONCLUSION: The absence of obvious LV reduction in patients with chronic liver disease may be a morphological index of patients without liver cirrhosis. The SV is related to the severity of fibrosis, and the spleen of patients with advanced fibrosis is enlarged evidently. The LV/SV ratio and SLV/SV ratio are of a significant clinical value in the diagnosis of advanced liver fibrosis.
- Citation: Liu P, Li P, He W, Zhao LQ. Liver and spleen volume variations in patients with hepatic fibrosis. World J Gastroenterol 2009; 15(26): 3298-3302
- URL: https://www.wjgnet.com/1007-9327/full/v15/i26/3298.htm
- DOI: https://dx.doi.org/10.3748/wjg.15.3298
Hepatic fibrosis is an important histopathological stage of chronic liver disease, and can progress to hepatocirrhosis. Studies have shown that hepatic fibrosis can be reversed[12]. Therefore, hepatic fibrosis can be halted if it is early diagnosed and treated with intervention therapy. Liver biopsy is the golden diagnosis standard for hepatic fibrosis and cirrhosis, but it cannot be used widely and repeatedly due to its invasive nature. This study was to observe the liver volume (LV) and spleen volume (SV) variations in patients with hepatic fibrosis by 64-row multidetector computed tomography (MDCT).
Eighty-five patients (66 males and 19 females, mean age 41 years) with liver fibrosis in our hospital between November 2007 and September 2008 were included in this study. All of them had chronic hepatitis B. The patients were divided into stage 1 (S1) group (n = 34), stage 2 (S2) group (n = 25), stage 3 (S3) group (n = 16), and stage 4 (S4) group (n = 10) according to their histopathological stage of fibrosis. The patients had no liver and spleen tumor. Fifteen patients (10 males and 5 females, mean age 35.5 years) with no history of liver and spleen disease served as a control group (S0). They underwent abdominal computed tomography (CT) scan for liver disease. Routine abdominal CT scanning showed no liver, bile and spleen disease. Liver test was normal and antigen test was negative for hepatitis B and C.
All patients with chronic hepatitis B were diagnosed according to the results of pathological examination of liver biopsy. The patients were divided into four groups according to the diagnostic criteria for virus hepatitis as previously described[3].
Abdominal CT scan was performed with a 64-row MDCT scanner (GE LightSpeed VCT). Protocols included a non-enhancement scan and an enhancement scan of the upper abdomen from the dome of diaphragm to the entire liver and spleen (5 mm thickness, 80-120 mAs, and 120 kVp). All patients received an injection of 100 mL iopromide (300 mg I/mL; Ultravist, Schering) through a peripheral vein (generally an antecubital vein) at a flow rate of 4.0 mL/s. The arterial phases were tracked with a scanning monitor and a time delay of 25 s after arterial phases was applied in all patients for the venous phases. Bolus-injection technique was used to administer contrast material with a power injector. All patients underwent CT scan at a supine position during a single breath.
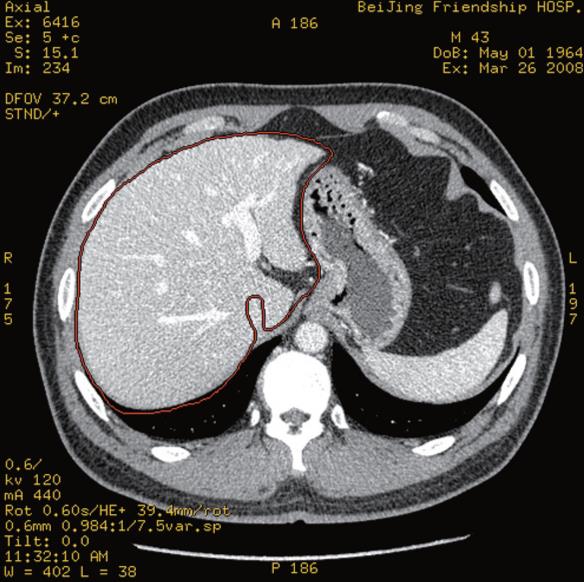
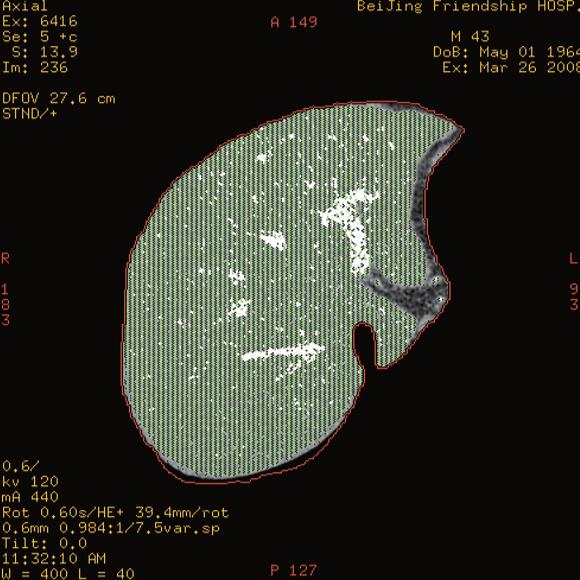
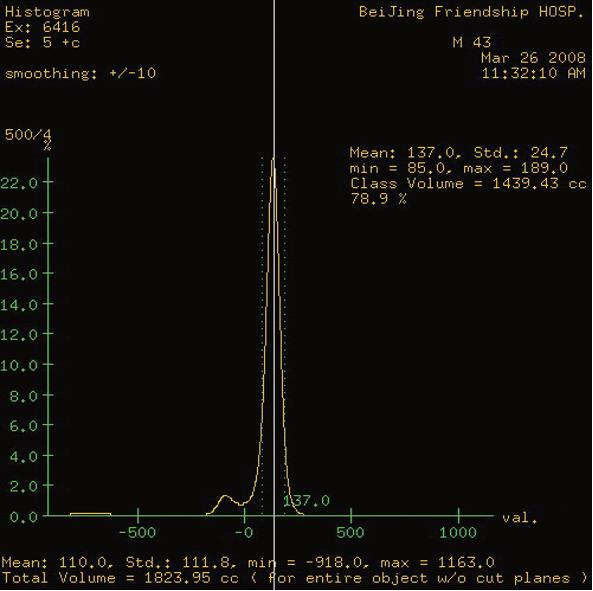
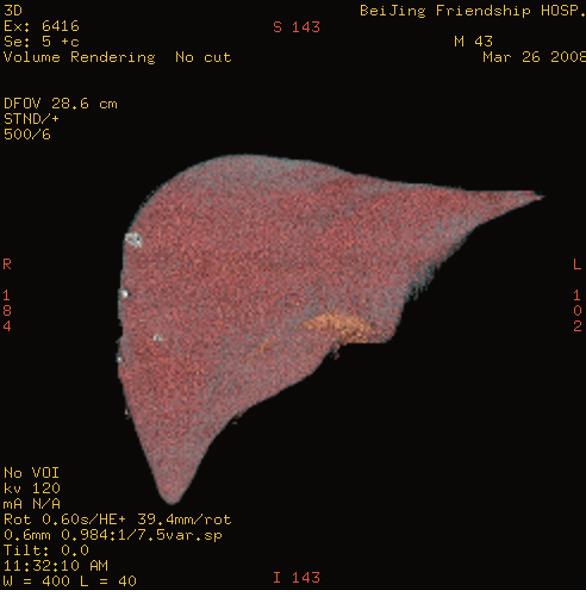
After scanning, 5 mm portal vein phase reconstruction images obtained from the raw data were divided (0.625 mm) and transferred to an interactive workstation (AW4.2 or AW4.3) to measure LV and SV. The profile of liver was outlined manually to exclude the inferior vena cava with an interval of several sections. Gallbladder, main liver blood vessels and fat were excluded by regulating the threshold value. The enclosed liver parenchymal area was then calculated automatically[45] and expressed as the LV (Figures 1,2,3,4).
Body weight (BW) and body height (BH) recorded at the time of CT examination were used to calculate the body surface area (BSA) following the equation: BSA (m2) = [0.0071 × BH (cm) + 0.0133 × BW (kg) - 0.1971]. LV is significantly related with BW, BH, and BSA as described elsewhere[67]. Therefore, standard liver volume (SLV) was measured following the equation: SLV (cm3/m2) = LV (cm3)/BSA (m2).
The measurement of SV and LV was similar. Since SV does not correlate with BW, BH and body mass index (BMI)[8–10], it is not necessary to make the SV standard.
Then, the LV/SV ratio and SLV/SV ratio were calculated.
Results were expressed as mean ± SD. One way analysis of variance(ANOVA) was used for multiple mean comparisons. Bonferroni correction was used for comparison of two samples. If heterogeneity of variance was found, a log transformation was used to normalize the data distribution, and ANOVA was run with an equal variance. P < 0.05 was considered statistically significant. Statistical analysis was performed using SPSS (version 14.0, SPSS).
The total LV and SLV were 1133.39 ± 131.84 cm3 and 637.98 ± 65.93 cm3 in the control group. The LV (F = 0.245) and SLV (F = 1.902) in patients with hepatic fibrosis tended to increase with the severity of fibrosis, but no statistically significant difference was observed among the 5 groups (Table 1).
| Group | Patients (n) | Liver volume (cm3) | Standard liver volume (cm3) | Spleen volume (cm3) | Liver/spleen volume ratio | Standard liver/spleen volume ratio |
| Control | 15 | 1133.39 ± 131.84 | 637.98 ± 65.93 | 190.94 ± 70.37bd | 6.70 ± 2.56bd | 3.81 ± 1.62bde |
| Stage 1 | 34 | 1117.33 ± 190.37 | 575.96 ± 73.82 | 213.20 ± 77.30bd | 5.84 ± 2.05bd | 3.05 ± 1.14ad |
| Stage 2 | 25 | 1158.30 ± 229.10 | 592.49 ± 65.31 | 253.53 ± 113.43bd | 5.13 ± 1.55d | 2.69 ± 0.96c |
| Stage 3 | 16 | 1168.23 ± 202.82 | 607.35 ± 69.81 | 358.67 ± 154.63 | 3.83 ± 1.77 | 2.00 ± 0.87 |
| Stage 4 | 10 | 1126.40 ± 271.38 | 590.11 ± 114.70 | 479.65 ± 181.56 | 2.67 ± 1.12 | 1.39 ± 0.53 |
| F value | 0.245 | 1.902 | 12.383 | 9.702 | 9.784 | |
| P value | 0.912 | 0.116 | 0.000 | 0.000 | 0.000 |
A log transformation was used to normalize the data distribution and ANOVA was run with an equal variance due to the heterogeneity of variance in SV. The SV was larger in patients with liver fibrosis than in control group and increased gradually with the severity of fibrosis (Table 1). There was a significant difference among the 5 groups (F = 12.383, P = 0.000). Statistically significant differences were observed between S3, S4 and other groups(S0, S1 and S2, P < 0.01).
The LV/SV ratio and SLV/SV ratio decreased gradually with the severity of fibrosis (Table 1). The differences in LV/SV (F = 9.702, P = 0.000) and SLV/SV (F = 9.784, P = 0.000) were significant among the 5 groups. Statistically significant differences in LV/SV were observed between S3 and S0, S1, and between S4 and S0, S1, S2 (P < 0.01). There were statistically significant differences in SLV/SV between S3 and S0, S4 and S0, S1 (P < 0.01), and between S2 and S0, S3 and S1, S4 and S2 (P < 0.05).
Measurement of LV and SV is a mature technique[4510–12]. The method, which combines profile outline and threshold value regulation, is convenient with a good veracity and repeatability[5]. Liver and spleen vary in size among different individuals[1314]. LV is obviously related with BW, BH, and BSA in normal persons[15–17]. BSA is calculated according to BW and BH, and therefore can equalize the difference in BW and BH. It is more reasonable to choose SLV (per BSA volume) to analyze LV change in hepatic fibrosis patients at different histopathological stages. Because SV does not correlate with BW, BH, and BMI[8–10], there is no need to make the spleen volume standard.
Reports are available on LV changes in patients with hepatic fibrosis[1819]. Chen et al[18] reported that the left, right and caudate lobe volumes tend to increase with the aggravation of inflammatory activity and the severity of fibrosis, with significant changes in vertical diameter and volume index of the left lobe but no obvious change in the right and caudate lobe volume. Tarao et al[19] reported that the LV is significantly larger in grade 2 alcoholic liver fibrosis patients than in grade 1 alcoholic liver fibrosis patients and healthy controls, and the LV is larger in grade 3 alcoholic liver fibrosis patients than in grade 2 alcoholic liver fibrosis patients, suggesting that LV in patients with alcoholic liver fibrosis increases gradually with the severity of fibrosis. The results of this study show that the LV and SLV in patients with liver fibrosis tended to increase with the severity of fibrosis from S1 to S3, but decrease in S4,indicating that LV tends to increase gradually with the severity of chronic liver diseases or fibrosis. Since the number of hepatic cells accounts for 70%-80% of the liver parenchyma, and the reserved liver function is closely related to the total functional hepatic cells, LV measurement can partly show changes in hepatic cells and stages of liver fibrosis or cirrhosis, and thus can be used as an indicator of liver function. It has been shown that LV significantly correlates with Child-Pugh classification of cirrhosis[52021]. In this study, LV and SLV changes were observed in patients with fibrosis (P > 0.05), which may be attributed to the limited number of cases. On the other hand, it may indicate that hepatic fibrosis has not yet led to obvious liver volume reduction and the decrease of hepatic cellular components.
It has been reported that changes in SV are related to the severity of fibrosis[192223]. Tarao et al[19] showed that SV is significantly larger in grade 3 hepatic fibrosis patients than in grade 1 and 2 hepatic fibrosis patients and healthy controls, indicating that SV in patients with hepatic fibrosis at an early stage is inconspicuously changed, but conspicuously at the advanced stage. Hoefs et al[22] reported that different percentages of SV above the upper normal limits can be noted in patients with histologically proven liver disease: no fibrosis (10%), or mild- moderate fibrosis (36.7%), early liver cirrhosis (52%), and advanced liver disease (75%), indicating that SV is closely related with the severity of liver fibrosis and cirrhosis. Ding et al[23] reported that SV is closely correlated with the histopathological stage of hepatic fibrosis and cirrhosis. In their study, the SV increased gradually in patients with hepatic fibrosis compared with normal subjects, and the differences between S3,S4 and the others were significant (P < 0.01).
In our study, the SV was larger in patients with liver fibrosis and increased gradually with the severity of fibrosis, and statistically significant differences were seen between S3, S4 and other groups (P < 0.01), suggesting that SV in patients with advanced fibrosis increases obviously compared with normal persons and patients with early fibrosis.
The underlying mechanism may be that extensive fibrosis with formation of fibrous septum occurs at the advanced stages of fibrosis, thus leading to portal congestion and hypertension, obstruction of spleen vein and splenomegaly.
It has been shown that the SV/LV ratio and SLV/SV ratio are significantly different between normal individuals and liver cirrhosis patients. The SV/LV ratio is considered a better index for the diagnosis of liver cirrhosis due to its minor coefficient of variation[11]. It was reported that the SV/LV ratio is of prognostic importance in patients with primary biliary cirrhosis[24]. The SV/LV ratio and SLV/SV ratio, calculated in this study, were 6.70 ± 2.56 and 3.81 ± 1.62, respectively in the control group, and decreased gradually with the aggravation of fibrosis in the other groups. The differences in LV/SV between S3 and S0, S1, and between S4 and S0, S1, S2 were statistically significant (P < 0.01). The differences in SLV/SV between S3 and S0, between S4 and S0, S1 and between S3 and S1, S4, S2 were statistically significant (P < 0.01), indicating that the SV/LV ratio and SLV/SV ratio are smaller in patients with advanced hepatic fibrosis than in patients with early hepatic fibrosis and normal persons, which may contribute to the diagnosis of advanced fibrosis.
Liver biopsy is the golden standard for the differential diagnosis of liver fibrosis from cirrhosis. However, some CT image findings may be useful in pathologic staging of liver fibrosis and cirrhosis. Studies have shown that LV is smaller in cirrhosis patients than in normal individuals[5112021]. Since this study showed that there was no statistical difference in LV between the fibrosis and control groups, no obvious LV reduction in patients with chronic liver disease may be a morphological and predictive index for the absence of liver cirrhosis. However, its accuracy needs to be further evaluated.
The SV range is wide in normal cases[12], and can be easily influenced by factors, such as venous congestion and disorders of the hematology system. Therefore, using SV as a dependable index for the severity of liver fibrosis needs to be further studied. However, SV can be used as a reference index based on the fact that changes in SV are related to the severity of liver fibrosis. The significance of changes in LV/SV ratio and SLV /SV ratio is similar to that of SV, because variations in LV/SV ratio and SLV/SV ratio mainly depend on the increased SV.
When the LV and SV are measured, some other parameters, such as main portal and spleen vein diameter, and collateral circulation of portal vein, can be detected and evaluated, all of which are the indirect signs of liver disease and portal hypertension. However, changes in LV are a direct sign of the severity of chronic liver disease.
Hepatic fibrosis is an important histopathological stage of chronic liver disease, and can progress to liver cirrhosis. Its diagnosis and staging remain difficult.
Liver biopsy is considered the golden diagnosis standard for hepatic fibrosis and cirrhosis, but it is an invasive procedure. Changes in liver volume (LV) and spleen volume (SV) are the morphological index of chronic liver disease.
Eighty-five cases of liver fibrosis underwent 64-row multidetector computed tomography (MDCT) scanning, and their LV and SV were measured. The results showed that the LV was not obviously reduced in liver fibrosis and cirrhosis patients, indicating that which may be a morphological and predictive index for the absence of liver cirrhosis.
Measurement of LV and SV with a 64-row MDCT is a noninvasive method to display the morphological changes in liver fibrosis and can contribute to the clinical diagnosis and treatment of chronic liver disease.
The measurement of LV and SV with MDCT is a noninvasive method to estimate the severity of chronic liver disease, and is of potential usefulness in differentiating liver fibrosis from cirrhosis and in staging of liver fibrosis. Further study is needed to evaluate its accuracy.
| 1. | Bonis PA, Friedman SL, Kaplan MM. Is liver fibrosis reversible? N Engl J Med. 2001;344:452-454. |
| 2. | Bataller R, Brenner DA. Liver fibrosis. J Clin Invest. 2005;115:209-218. |
| 3. | Chinese Society of Infectious Diseases and Parasitology and Chinese Society of Hepatology, Chinese Medical Association. The program of prevention and treatment for viral hepatitis. Zhonghua Chuanranbing Zazhi. 2001;19:56-62. |
| 4. | Geraghty EM, Boone JM, McGahan JP, Jain K. Normal organ volume assessment from abdominal CT. Abdom Imaging. 2004;29:482-490. |
| 5. | Sun CJ, He W. Investigation to liver volume change of hepatic cirrhosis by multi-slice spiral CT. Zhongguo Yixue Yingxiang Jishu. 2007;23:566-569. |
| 6. | Li YM, Lv F, Bai ZL, Ji H, Lei TJ, Yang QX. The investigation significance of volume formula of normal people in our country. Shanxi Yixue Zazhi. 2002;31:634-636. |
| 7. | Zhou XP, Lu T, Wei YG, Chen XZ. Liver volume variation in patients with virus-induced cirrhosis: findings on MDCT. AJR Am J Roentgenol. 2007;189:W153-W159. |
| 8. | Prassopoulos P, Daskalogiannaki M, Raissaki M, Hatjidakis A, Gourtsoyiannis N. Determination of normal splenic volume on computed tomography in relation to age, gender and body habitus. Eur Radiol. 1997;7:246-248. |
| 9. | Kaneko J, Sugawara Y, Matsui Y, Ohkubo T, Makuuchi M. Normal splenic volume in adults by computed tomography. Hepatogastroenterology. 2002;49:1726-1727. |
| 10. | Wang HB, Liu C. Measurement of normal spleen volume in vivo by multislice spiral CT. Zhongguo Linchuang Jiepouxue Zazhi. 2004;22:481-484. |
| 11. | Tu R, Zhang YD, Wu BZ, Huang HW, Liu H, Zheng MQ. Evaluation study of CT volumetry in quantitative diagnosis of liver cirrhosis. Linchuang Gandanbing Zazhi. 2004;20:28-29. |
| 12. | Nawaratne S, Fabiny R, Brien JE, Zalcberg J, Cosolo W, Whan A, Morgan DJ. Accuracy of volume measurement using helical CT. J Comput Assist Tomogr. 1997;21:481-486. |
| 13. | Abdalla EK, Denys A, Chevalier P, Nemr RA, Vauthey JN. Total and segmental liver volume variations: implications for liver surgery. Surgery. 2004;135:404-410. |
| 14. | Geraghty EM, Boone JM. Determination of height, weight, body mass index, and body surface area with a single abdominal CT image. Radiology. 2003;228:857-863. |
| 15. | Urata K, Hashikura Y, Ikegami T, Terada M, Kawasaki S. Standard liver volume in adults. Transplant Proc. 2000;32:2093-2094. |
| 16. | Vauthey JN, Abdalla EK, Doherty DA, Gertsch P, Fenstermacher MJ, Loyer EM, Lerut J, Materne R, Wang X, Encarnacion A. Body surface area and body weight predict total liver volume in Western adults. Liver Transpl. 2002;8:233-240. |
| 17. | Hashimoto T, Sugawara Y, Tamura S, Hasegawa K, Kishi Y, Kokudo N, Makuuchi M. Estimation of standard liver volume in Japanese living liver donors. J Gastroenterol Hepatol. 2006;21:1710-1713. |
| 18. | Chen KM, Zhong L, Chai WM, Ding XL, Wang PJ, Tian JM, Zeng MS, Zhou KR, Li HM, Xiao XS. Morphological changes of liver in patients with hepatic fibrosis by CT-MR assessment. Ganzang. 2000;5:209-210. |
| 19. | Tarao K, Hoshino H, Motohashi I, Iimori K, Tamai S, Ito Y, Takagi S, Oikawa Y, Unayama S, Fujiwara T. Changes in liver and spleen volume in alcoholic liver fibrosis of man. Hepatology. 1989;9:589-593. |
| 20. | Li YM, Lv F, Ji H, Bai ZL, Lei TJ. A study on the correlation between hepatic volume and liver functional reserve. Zhonghua Putong Waike Zazhi. 2003;18:79-81. |
| 21. | Lu T, Zhou XP, Wei YG, Chen XZ. The correlation between hepatic lobe volume as evaluation by compute tomography and liver function reserve in post-hepatitis cirrhosis patients. Zhonghua Putong Waike Zazhi. 2007;22:42-45. |
| 22. | Hoefs JC, Wang FW, Lilien DL, Walker B, Kanel G. A novel, simple method of functional spleen volume calculation by liver-spleen scan. J Nucl Med. 1999;40:1745-1755. |
| 23. | Ding K, Huang ZK, Long LL, Lin SC, Li CL, Sun LW. Correlation of CT measurement of spleen size with histopathological stage of chronic hepatic fibrosis and cirrhosis. Shijie Huaren Xiaohua Zazhi. 2007;15:3535-3539. |
| 24. | Murata Y, Abe M, Hiasa Y, Azemoto N, Kumagi T, Furukawa S, Matsuura B, Michitaka K, Horiike N, Onji M. Liver/spleen volume ratio as a predictor of prognosis in primary biliary cirrhosis. J Gastroenterol. 2008;43:632-636. |


