Published online Dec 14, 2005. doi: 10.3748/wjg.v11.i46.7272
Revised: September 9, 2005
Accepted: September 12, 2005
Published online: December 14, 2005
AIM: To investigate dose-response and time-course of the effects of ethanol on the cell viability and antioxidant capacity in isolated rat hepatocytes.
METHODS: Hepatocytes were isolated from male adult Wistar rats and seeded into 100-mm dishes. Hepatocytes were treated with ethanol at concentrations between 0 (C), 10 (E10), 50 (E50), and 100 (E100) mmol/L (dose response) for 12, 24, and 36 h (time course). Then, lactate dehydrogenase (LDH) leakage, malondialdehyde (MDA) concentration, glutathione (GSH) level, and activities of glutathione peroxidase (GPX), glutathione reductase (GRD), superoxide dismutase (SOD), and catalase (CAT) were measured.
RESULTS: Our data revealed that LDH leakage was significantly increased by about 30% in group E100 over those in groups C and E10 at 24 and 36 h, The MDA concentration in groups C, E10 and E50 were significantly lower than that in group E100 at 36 h. Furthermore, the concentration of MDA in group E100 at 36 h was significantly higher by 4.5- and 1.7-fold, respectively, than that at 12 and 24 h. On the other hand, the GSH level in group E100 at 24 and 36 h was significantly decreased, by 32% and 28%, respectively, compared to that at 12 h. The activities of GRD and CAT in group E100 at 36 h were significantly less than those in groups C and E10. However, The GPX and SOD activities showed no significant change in each group.
CONCLUSION: These results suggest that long-time incubation with higher concentration of ethanol (100 mmol/L) decreased the cell viability by means of reducing GRD and CAT activities and increasing lipid peroxidation.
- Citation: Yang SS, Huang CC, Chen JR, Chiu CL, Shieh MJ, Lin SJ, Yang SC. Effects of ethanol on antioxidant capacity in isolated rat hepatocytes. World J Gastroenterol 2005; 11(46): 7272-7276
- URL: https://www.wjgnet.com/1007-9327/full/v11/i46/7272.htm
- DOI: https://dx.doi.org/10.3748/wjg.v11.i46.7272
Ethanol is metabolized to acetaldehyde by some enzymes in the body, including alcohol dehydrogenase (ADH), cytochrome P450 2E1 (CYP 2E1), catalase (CAT), xanthine oxidase (XO), etc. Then acetaldehyde is decomposed to acetic acid by acetaldehyde dehydrogenase (ALDH) in mitochondria. Several studies have provided evidences for reactive oxygen species (ROS) generation during ethanol metabolism, including superoxide radical[1], hydrogen peroxide[2], hydroxyl radical[3], and 1-hydroxyethyl radical[4]. Numerous studies have indicated that excessive ethanol intake induces the mass production of free radicals in the body, which are considered to be associated with alcoholic liver disease[5]. Furthermore, a number of experimental studies demonstrated that either acute or chronic alcohol administration to experimental animals increases the formation of lipid peroxidation products, such as malondialdehyde (MDA), and decreases tissue levels of antioxidants, such as glutathione (GSH), in the liver[6]. Bailey and Cunningham also indicated that the exposure of hepatocytes to ethanol resulted in increased production of ROS, which correlated with decreased cell viability[7]. The impairment of cellular antioxidant defenses along with the formation of oxygen-derived radicals has been proposed to play a role in causing oxidative damage associated with alcoholic liver disease. Moreover, the individual differences in animals always makes the results inconsistent; therefore, the purpose of this study was to investigate and clarify the influences of different concentrations of ethanol on the cell viability, antioxidant capacity, and antioxidant enzymes activities in the isolated liver parenchymal cells during different incubation times.
Hepatocytes were isolated from rats according to the two-step collagenase perfusion technique described by Berry and Friend[8]. Isolated cells were cultured as monolayers in William’s medium E with 5% fetal bovine serum and 1 μmol/L dexamethasone at a density of 1×10⁵ cells/mL. After 24 h of incubation at 37 °C in 50 mL/L CO2, hepatocytes were treated with ethanol at concentrations between 0 (C), 10 (E10), 50 (E50), and 100 (E100) mmol/L (dose response) for 12, 24, and 36 h (time course). Then, the cells were collected using a scraper and resuspended in Tris buffer (50 mmol/L Tris-HCl, 5 mmol/L EDTA, and 1 mmol/L DTT, pH 7.5) for analysis as follows.
The viability of hepatocytes was expressed as the percentage of LDH leakage, which was the LDH activity in the culture medium relative to the total LDH activity including the culture medium and cytosolic fraction. The LDH level was determined using the method described by a previous study[9].
The MDA concentration of hepatocytes was assessed colorimetrically at 586 nm using a commercial kit (Calbiochem 437634; Calbiochem-Novabiochem, La Jolla, CA, USA). The concentration was expressed as nmol/mg protein in hepatocytes.
The concentration of reduced GSH in hepatocytes was measured spectrophotometrically at 400 nm using a commercial kit (Calbiochem 354102; Calbiochem-Novabiochem). The concentration was expressed as nmol/mg protein in hepatocytes.
GPX activity of hepatocytes was determined with a commercial kit (RS 504; Randox Laboratories, Antrim, UK). Twenty microliters of the diluted sample was added to 1 mL of mixed substrate (4 mmol/L GSH, 0.5 U/L GRD and 0.34 mmol/L NADPH dissolved in 50 mmol/L phosphate buffer, pH 7.2, 4.3 mmol/L EDTA). Forty microliters of cumene hydroperoxide (diluted in deionized water) was added to the mixture and GPX activity was measured at 37 °C on a Hitachi U-2000 Spectrophotometer at 340 nm for 3 min. The activity was expressed as mU/mg protein in hepatocytes.
GRD activity of hepatocytes was measured with a commercial kit (Calbiochem 359962; Calbiochem-Novabiochem). Two hundred microliters of the diluted sample was added to 400 μL of 2.4 mmol/L GSSG buffer (dissolved in 125 mmol/L potassium phosphate buffer, pH 7.5, 2.5 mmol/L EDTA). Four hundred microliters of 0.55 mmol/L NADPH (dissolved in deionized water) was added to the mixture and GRD activity was measured at 340 nm for 5 min on a Hitachi U-2000 Spectrophotometer. The activity was expressed as mU/mg protein in hepatocytes.
SOD activity of hepatocytes was measured with a commercial kit (SD 125; Randox Laboratories). Fifty microliters of the diluted sample was added to 1.7 mL of mixed substrate (50 μmol/L xanthine and 25 μmol/L 2-(4-iodophenyl)-3-(4-nitrophenyl)-5-phenyl tetrazolium chloride, INT). Two hundred and fifty microliters of XO was added to the mixture and SOD activity was measured at 37 °C on a Hitachi U-2000 Spectrophotometer at 505 nm for 3 min. The activity was expressed as U/mg protein in hepatocytes.
CAT activity of hepatocytes was determined at 25 °C with Hitachi U-2000 Spectrophotometer UV-VIS Spectrophotometer according to the previous study[10]. Diluted sample was added to 59 mmol/L H2O2 (dissolved in 50 mmol/L potassium phosphate buffer, pH 7.0) and CAT activity was measured at 240 nm for 3 min. One unit of CAT activity was defined as the mmol of H2O2 degraded/min/mg protein. The activity was expressed as U/mg protein in hepatocytes.
In order to express the antioxidant enzymes activities per gram of protein, total protein concentration of hepatocytes was determined colorimetrically by using a Bio-Rad DC protein assay kit (Cat. No. 500-0116; Bio-Rad Laboratories, Hercules, CA, USA).
Values were expressed as mean±SD. To evaluate the differences between the groups studied, two-way analysis of variance (ANOVA) with Fisher’s post hoc test was used. The SAS software (Vers. 8.2, SAS Institute Inc., Cary, NC, USA) was used to analyze all the data. Differences were considered statistically significant when P<0.05.
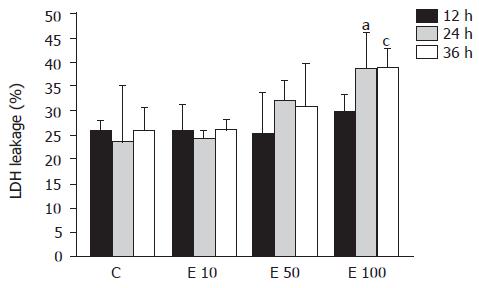
LDH leakage into the culture media of hepatocyte was used to assess the hepatotoxicity of ethanol (Figure 1). LDH leakage in group E10 was nearly the same as that in group C at 12, 24, and 36 h. In contrast, LDH leakage in group E100 was significantly increased by about 30% more than that in groups C and E10 at 24 and 36 h (P<0.05). Furthermore, the LDH leakage showed dose-dependent correlation with the ethanol concentrations (P = 0.0026). However, there was no significant correlation between LDH leakage and incubation time of ethanol (P>0.05).
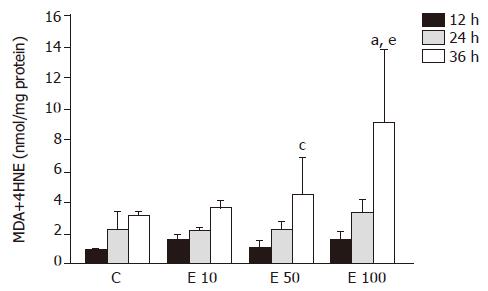
The level of MDA in group E100 at 36 h was significantly increased by 1.9-, 1.5-, and 1.0-fold, respectively, over that in groups C, E10, and E50 (P<0.05, Figure 2). In group E50 and group E100, the lipid peroxidation product was significantly elevated at 36 h (P<0.05), by 2.9- and 4.5-fold, respectively, when compared to that at 12 h. In addition, there was no significant difference in group C and group E10. The level of MDA also showed significant correlation with the incubation concentration and time of ethanol (P = 0.0105 and P = 0.0001, respectively).
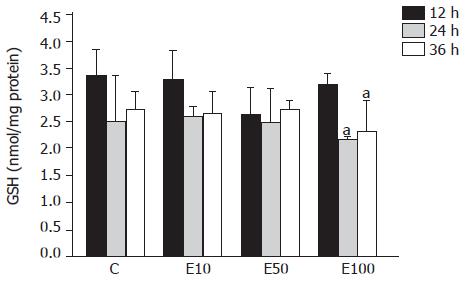
There was no significant difference across the groups at different times (Figure 3). However, in group E100, the GSH level was significantly decreased at 24 and 36 h, by 32% and 28%, respectively, over that at 12 h (P<0.05).
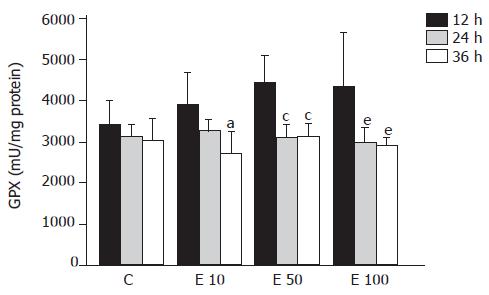
There was no significant difference in GPX activity in each group at different times (Figure 4). However, in group E10, the GPX activity was significantly decreased at 36 h from that at 12 h (P<0.05). Furthermore, both in groups E50 and E100, GPX activities were significantly lowered at 24 and 36 h from those at 12 h (P<0.05). As a result, the activity of GPX was significantly correlated with the incubation time course (P = 0.0004).
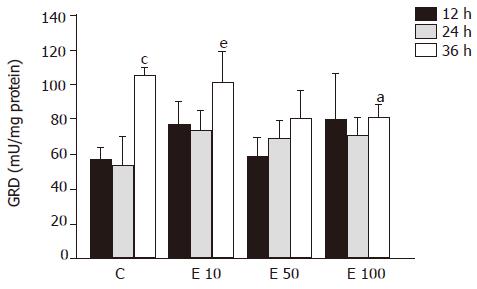
After 36-h incubation, there were significantly fewer GRD activities in groups E50 and E100 than in groups C and E10 (P<0.05, Figure 5). However, both in group C and group E10 at 36 h, the activities of GRD were significantly increased over those at 12 and 24 h (P<0.05). On the other hand, the relation of GRD activity and the incubation time showed positive correlation (P = 0.0002).
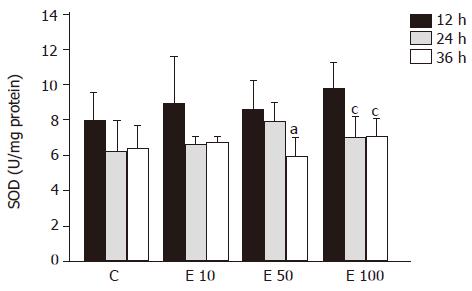
There were no significant differences among the groups at different times in SOD activity (Figure 6). SOD activity of group E50 was significantly decreased at 36 h, by 45%, from that at 12 h (P<0.05). Furthermore, in group E100, the SOD activities were significantly decreased at 24 and 36 h, by 40% and 38%, respectively, from that at 12 h (P<0.05). In addition, the activity of SOD exhibited the reverse correlation with the incubation time (P = 0.0018).
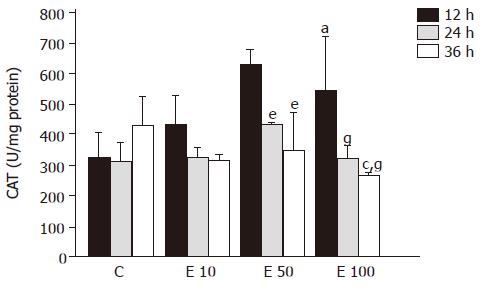
After 12-h incubation, CAT activities in groups E50 and E100 were significantly increased, by 94% and 68%, respectively, over those in group C (P<0.05, Figure 7). On the contrary, CAT activity in group E100 at 36 h was significantly decreased from that in groups C and E50 (P<0.05). Moreover, both in groups E50 and E100, CAT activities were significantly lowered at 24 and 36 h from those at 12 h (P<0.05). There was a significant increase in correlation between CAT activity and incubation time (P = 0.0003).
LDH is an enzyme that exists in many tissues and organs, such as the heart, muscle, kidney, liver, etc. When those tissues or organs are damaged, LDH is released into the blood from the cells. Therefore, LDH leakage can be used to indicate cell viability. In this study, the viability of hepatocytes was monitored by the release of LDH into the medium. That is to say, higher LDH leakage was interpreted as lower viability of hepatocytes. The previous study has shown that ethanol increased the production of ROS and resulted in a decrease in hepatocyte viability[7]. Results in this study also suggest that high concentration of ethanol (100 mmol/L) may decrease cell viability of hepatocytes.
MDA was one of the main lipid peroxidation products, its elevated levels could reflect the degrees of lipid peroxidation induced injury in hepatocytes[11]. Many reports have demonstrated that ethanol exposure promotes the accumulation of lipid peroxidation in vivo[12] and in vitro[13]. Lipid peroxidation induced by ethanol administration results from not only increasing ROS production but also the mass generation of acetaldehyde[14]. Our data also indicated that the MDA concentration showed significant correlation with the incubation concentration and time of ethanol in isolated rat hepatocytes.
It has been reported that chronic ethanol feeding results in increased[15], decreased[16], or unchanged hepatic GSH contents[17] in vivo. The discrepancies in the total GSH levels in the livers of rats chronically fed with ethanol might have originated from the differences in the strains of rats used and the dose, duration, and route of ethanol administration among the different studies. On the other hand, the previous study has demonstrated that acute ethanol administration neither decreases nor increases the GSH level in hepatocytes, at least within 4 h after treating with 50 mmol/L ethanol in vitro[18]. Our results also showed that there was no significant difference in GSH content after 50 mmol/L ethanol treatment in hepatocytes. But the GSH concentration in hepatocytes significantly declined after 100 mmol/L ethanol treatment at 24 and 36 h. In this study, the reduction of GSH and the elevation of lipid peroxidation were simultaneously observed in the 100 mmol/L ethanol exposure. Thus, it could be speculated that ethanol-induced lipid peroxidation might contribute to decreased GSH contents in this study as previously shown by others[18].
Metabolism of ethanol is believed to result in the increased production of ROS, especially superoxide and H2O2, and the removal of these toxic species is thought to be a vital initial step in ensuring cell survival during ethanol intoxication[6]. Four major antioxidant enzymes available to the cell during ethanol-induced oxidant stress include GPX, GRD, SOD, and CAT. The previous study has shown that GPX, CAT, and SOD activities showed an inverse correlation with the severity of pathological injury in rats fed with ethanol[12]. In contrast, Oh et al reported that chronic ethanol feeding resulted in the lower activity of GPX with significantly higher activities of GRD and CAT[15]. However, there have been a few reports about the effects of ethanol on antioxidant enzymes activities in hepatocytes in vitro. Our data suggest that higher concentration of ethanol may reduce antioxidant enzymes activities of GRD and CAT after long-time incubation and contribute to decreased cell viability and increased lipid peroxidation.
In conclusion, this study indicates the direct relatedness between ethanol and hepatocytes and excludes the factor of gastrointestinal absorption. It was demonstrated that 100 mmol/L ethanol exposure diminished the cell viability because the lipid peroxidative product accumulated, which was caused by the decreased antioxidative status, including the reduction of GSH contents, GRD and CAT activities.
Co-first-authors: Sien-Sing Yang and Chi-Chang Huang
Science Editor Guo SY and Xu XQ Language Editor Elsevier HK
| 1. | Boveris A, Fraga CG, Varsavsky AI, Koch OR. Increased chemiluminescence and superoxide production in the liver of chronically ethanol-treated rats. Arch Biochem Biophys. 1983;227:534-541. [RCA] [PubMed] [DOI] [Full Text] [Cited by in Crossref: 170] [Cited by in RCA: 167] [Article Influence: 4.0] [Reference Citation Analysis (0)] |
| 2. | Ekström G, Ingelman-Sundberg M. Rat liver microsomal NADPH-supported oxidase activity and lipid peroxidation dependent on ethanol-inducible cytochrome P-450 (P-450IIE1). Biochem Pharmacol. 1989;38:1313-1319. [RCA] [PubMed] [DOI] [Full Text] [Cited by in Crossref: 395] [Cited by in RCA: 375] [Article Influence: 10.4] [Reference Citation Analysis (0)] |
| 3. | Ingelman-Sundberg M, Johansson I. Mechanisms of hydroxyl radical formation and ethanol oxidation by ethanol-inducible and other forms of rabbit liver microsomal cytochromes P-450. J Biol Chem. 1984;259:6447-6458. [PubMed] |
| 4. | Rashba-Step J, Turro NJ, Cederbaum AI. Increased NADPH- and NADH-dependent production of superoxide and hydroxyl radical by microsomes after chronic ethanol treatment. Arch Biochem Biophys. 1993;300:401-408. [RCA] [PubMed] [DOI] [Full Text] [Cited by in Crossref: 105] [Cited by in RCA: 98] [Article Influence: 3.1] [Reference Citation Analysis (0)] |
| 5. | Ishii H, Kurose I, Kato S. Pathogenesis of alcoholic liver disease with particular emphasis on oxidative stress. J Gastroenterol Hepatol. 1997;12:S272-S282. [RCA] [PubMed] [DOI] [Full Text] [Cited by in Crossref: 99] [Cited by in RCA: 88] [Article Influence: 3.1] [Reference Citation Analysis (0)] |
| 6. | Nordmann R, Ribière C, Rouach H. Implication of free radical mechanisms in ethanol-induced cellular injury. Free Radic Biol Med. 1992;12:219-240. [RCA] [PubMed] [DOI] [Full Text] [Cited by in Crossref: 456] [Cited by in RCA: 418] [Article Influence: 12.7] [Reference Citation Analysis (1)] |
| 7. | Bailey SM, Cunningham CC. Effect of dietary fat on chronic ethanol-induced oxidative stress in hepatocytes. Alcohol Clin Exp Res. 1999;23:1210-1218. [RCA] [PubMed] [DOI] [Full Text] [Cited by in Crossref: 35] [Cited by in RCA: 36] [Article Influence: 1.4] [Reference Citation Analysis (0)] |
| 8. | Berry MN, Friend DS. High-yield preparation of isolated rat liver parenchymal cells: a biochemical and fine structural study. J Cell Biol. 1969;43:506-520. [RCA] [PubMed] [DOI] [Full Text] [Full Text (PDF)] [Cited by in Crossref: 3387] [Cited by in RCA: 3600] [Article Influence: 64.3] [Reference Citation Analysis (0)] |
| 9. | Moldéus P, Högberg J, Orrenius S. Isolation and use of liver cells. Methods Enzymol. 1978;52:60-71. [RCA] [PubMed] [DOI] [Full Text] [Cited by in Crossref: 820] [Cited by in RCA: 848] [Article Influence: 18.0] [Reference Citation Analysis (0)] |
| 10. | BEERS RF, SIZER IW. A spectrophotometric method for measuring the breakdown of hydrogen peroxide by catalase. J Biol Chem. 1952;195:133-140. [PubMed] |
| 11. | Hu YY, Liu CH, Wang RP, Liu C, Liu P, Zhu DY. Protective actions of salvianolic acid A on hepatocyte injured by peroxidation in vitro. World J Gastroenterol. 2000;6:402-404. [PubMed] |
| 12. | Polavarapu R, Spitz DR, Sim JE, Follansbee MH, Oberley LW, Rahemtulla A, Nanji AA. Increased lipid peroxidation and impaired antioxidant enzyme function is associated with pathological liver injury in experimental alcoholic liver disease in rats fed diets high in corn oil and fish oil. Hepatology. 1998;27:1317-1323. [RCA] [PubMed] [DOI] [Full Text] [Cited by in Crossref: 223] [Cited by in RCA: 218] [Article Influence: 8.1] [Reference Citation Analysis (0)] |
| 13. | Sergent O, Morel I, Cogrel P, Chevanne M, Pasdeloup N, Brissot P, Lescoat G, Cillard P, Cillard J. Increase in cellular pool of low-molecular-weight iron during ethanol metabolism in rat hepatocyte cultures. Relationship with lipid peroxidation. Biol Trace Elem Res. 1995;47:185-192. [RCA] [PubMed] [DOI] [Full Text] [Cited by in Crossref: 21] [Cited by in RCA: 22] [Article Influence: 0.7] [Reference Citation Analysis (0)] |
| 14. | Müller A, Sies H. Role of alcohol dehydrogenase activity and the acetaldehyde in ethanol- induced ethane and pentane production by isolated perfused rat liver. Biochem J. 1982;206:153-156. [PubMed] |
| 15. | Oh SI, Kim CI, Chun HJ, Park SC. Chronic ethanol consumption affects glutathione status in rat liver. J Nutr. 1998;128:758-763. [PubMed] |
| 16. | Rouach H, Fataccioli V, Gentil M, French SW, Morimoto M, Nordmann R. Effect of chronic ethanol feeding on lipid peroxidation and protein oxidation in relation to liver pathology. Hepatology. 1997;25:351-355. [RCA] [PubMed] [DOI] [Full Text] [Cited by in Crossref: 174] [Cited by in RCA: 158] [Article Influence: 5.6] [Reference Citation Analysis (0)] |
| 17. | Shaw S, Jayatilleke E, Ross WA, Gordon ER, Leiber CS. Ethanol-induced lipid peroxidation: potentiation by long-term alcohol feeding and attenuation by methionine. J Lab Clin Med. 1981;98:417-424. [PubMed] |
| 18. | Higuchi H, Kurose I, Kato S, Miura S, Ishii H. Ethanol-induced apoptosis and oxidative stress in hepatocytes. Alcohol Clin Exp Res. 1996;20:340A-346A. [RCA] [PubMed] [DOI] [Full Text] [Cited by in Crossref: 60] [Cited by in RCA: 56] [Article Influence: 2.0] [Reference Citation Analysis (0)] |


