Copyright
©The Author(s) 2003.
World J Gastroenterol. Sep 15, 2003; 9(9): 1972-1975
Published online Sep 15, 2003. doi: 10.3748/wjg.v9.i9.1972
Published online Sep 15, 2003. doi: 10.3748/wjg.v9.i9.1972
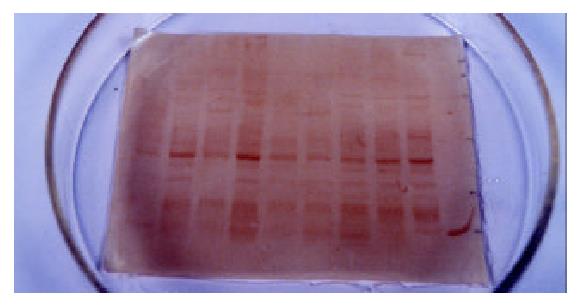
Figure 1 Mad2 protein expression in normal tissue and colorectal Cancer.
1: standard molecular weight; 2: Mad2 in poorly differentiated adenocarcinoma; 3: Mad2 in correspond-ing norma l tissue; 4: Mad2 in well differ entia ted adenocarcinoma; 5: Mad2 in corresponding normal tissue; 6: Mad2 in moderately differentiated adenocarcinoma; 7: Mad2 in corresponding normal tissue.
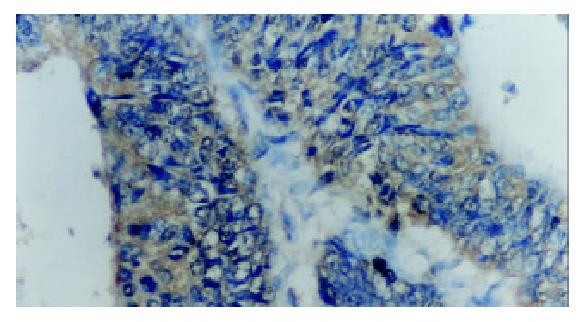
Figure 2 Strongly positive expression of Mad2 in tubular adenocarcinoma.
S-P × 400.
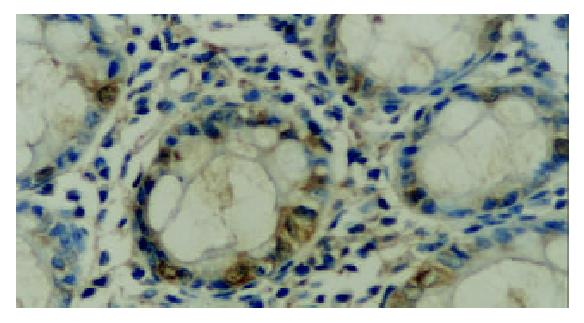
Figure 3 Weakly positive expression of Mad2 in normal mucosa S-P × 400.
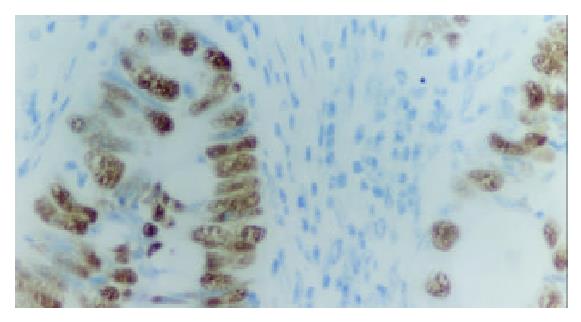
Figure 4 Strongly positive expression of p53 in tubular adenocarcinoma.
S-P × 400.
- Citation: Li GQ, Li H, Zhang HF. Mad2 and p53 expression profiles in colorectal cancer and its clinical significance. World J Gastroenterol 2003; 9(9): 1972-1975
- URL: https://www.wjgnet.com/1007-9327/full/v9/i9/1972.htm
- DOI: https://dx.doi.org/10.3748/wjg.v9.i9.1972


