Copyright
©The Author(s) 2003.
World J Gastroenterol. Aug 15, 2003; 9(8): 1866-1870
Published online Aug 15, 2003. doi: 10.3748/wjg.v9.i8.1866
Published online Aug 15, 2003. doi: 10.3748/wjg.v9.i8.1866
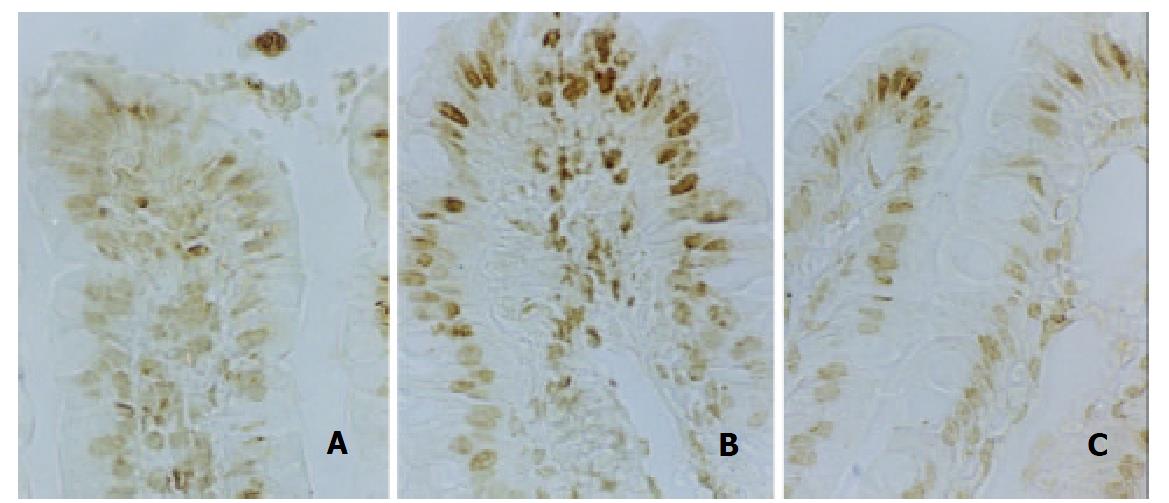
Figure 1 Light micrographs of apoptotic cells detected by TUNEL method (original magnification ×400).
A: In S group, TUNEL signals were only observed accidentally at villi tip. B: In SBT group, many TUNEL signals appeared at villi tip of the graft. C: In ISBT group, after IPC was carried out, TUNEL signals decreased significantly at villi tip of the graft.
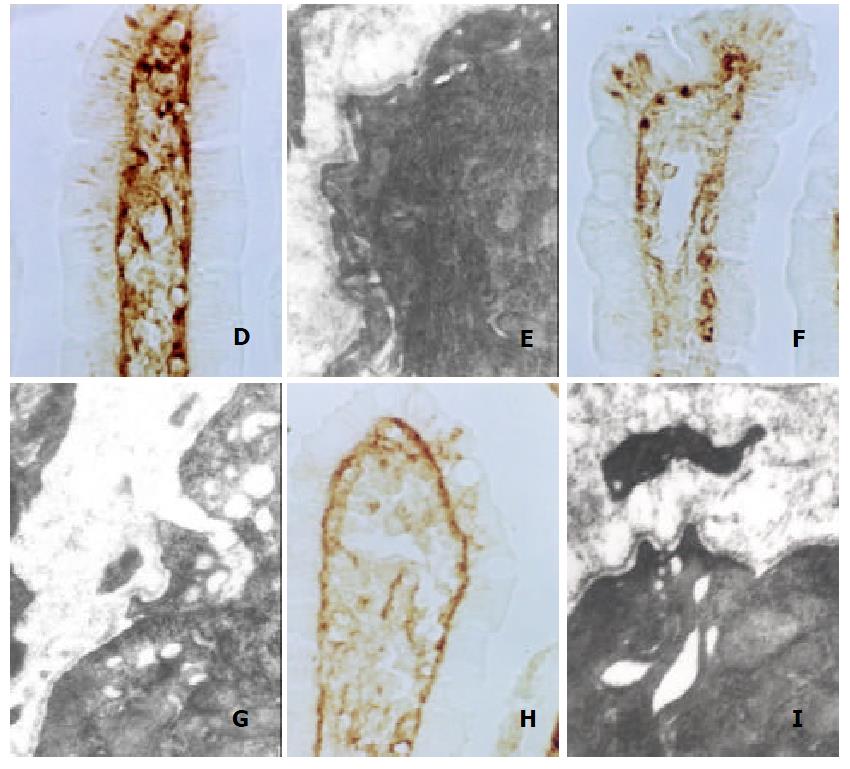
Figure 2 Light and electron micrographs (LM and EM) of morphological change of epithelial basement membrane (BM) (LM, original magnification ×400, EM, original magnification ×20000).
D and E: In S group, BM showed line-shaped, continuous normal structure. F and G: In SBT group, BM became disrupted and collapsed, even disappeared. H and I: In ISBT group, after IPC was function carried out, the lesion of BM was slighter, compared with that in SBT group.
- Citation: Wang SF, Li GW. Early protective effect of ischemic preconditioning on small intestinal graft in rats. World J Gastroenterol 2003; 9(8): 1866-1870
- URL: https://www.wjgnet.com/1007-9327/full/v9/i8/1866.htm
- DOI: https://dx.doi.org/10.3748/wjg.v9.i8.1866


