Copyright
©The Author(s)2003.
World J Gastroenterol. Aug 15, 2003; 9(8): 1828-1831
Published online Aug 15, 2003. doi: 10.3748/wjg.v9.i8.1828
Published online Aug 15, 2003. doi: 10.3748/wjg.v9.i8.1828
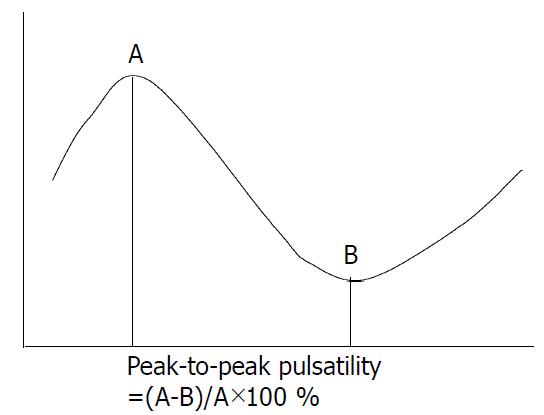
Figure 1 Mean portal blood velocity (Vmean) was calculated (cm/s) by the equation of “Vmean = 0.
57×maximum portal blood velocity (Vmax)”.
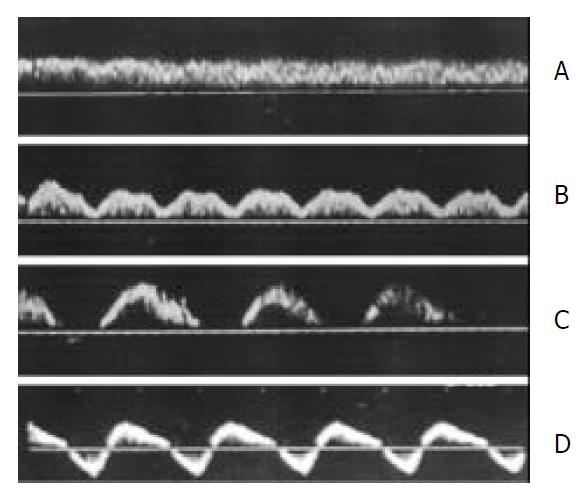
Figure 2 Representative waveform of portal blood flow from patients with normal (A; PP: 17%), transiently reduced (B; PP: 60%), stagnant (C; PP: 100%) or retrograde (D; PP: 194%) portal blood flow.
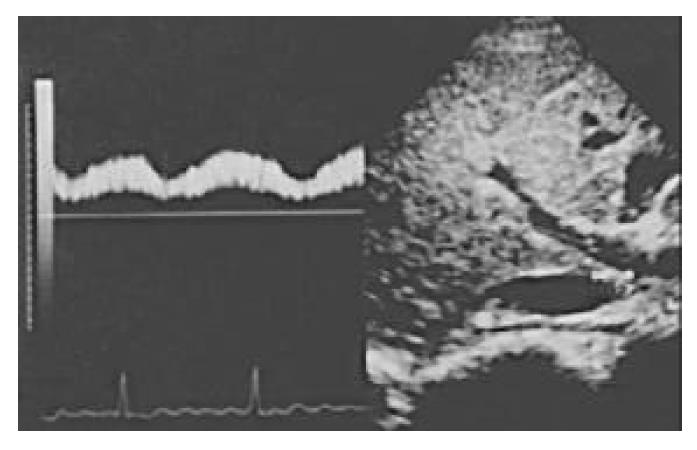
Figure 3 Occurrence of reduced portal blood flow immedi-ately after ventricular systole.
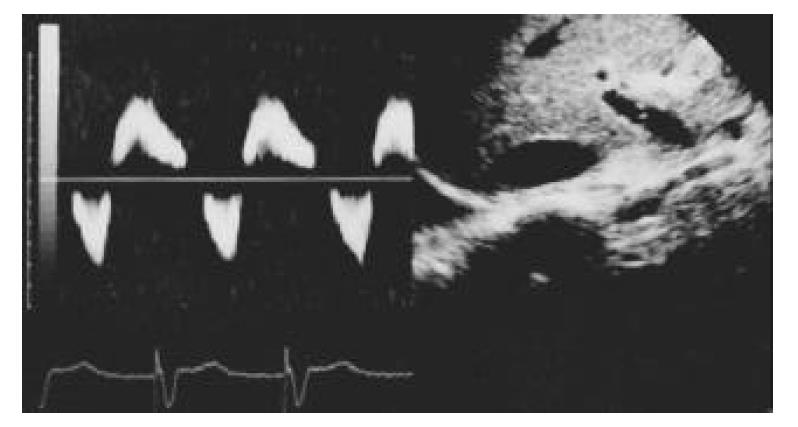
Figure 4 The occurrence of transient hepatofugal portal blood flow immediately after ventricular systole.
- Citation: Hu JT, Yang SS, Lai YC, Shih CY, Chang CW. Percentage of peak-to-peak pulsatility of portal blood flow can predict right-sided congestive heart failure. World J Gastroenterol 2003; 9(8): 1828-1831
- URL: https://www.wjgnet.com/1007-9327/full/v9/i8/1828.htm
- DOI: https://dx.doi.org/10.3748/wjg.v9.i8.1828


