Copyright
©The Author(s) 2003.
World J Gastroenterol. Aug 15, 2003; 9(8): 1824-1827
Published online Aug 15, 2003. doi: 10.3748/wjg.v9.i8.1824
Published online Aug 15, 2003. doi: 10.3748/wjg.v9.i8.1824
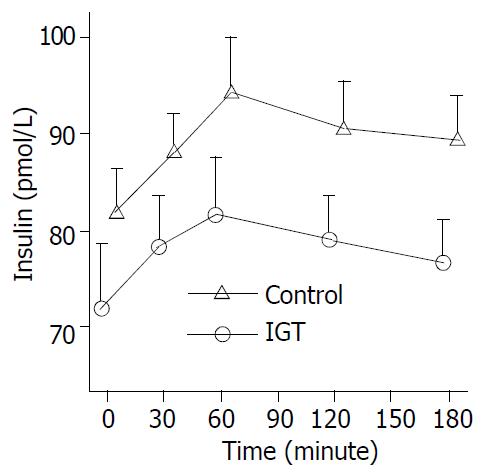
Figure 1 Circulation insulin levels during hyperglycemia clamps in 20 patients of control group (○-○) and in 20 pa-tients of IGT group (△-△).
Mean ± S.E.M. in human sepsis. Plasma insulin levels rose from a basal value to a peak within an hour (P < 0.01) and high levels maintained in two groups.
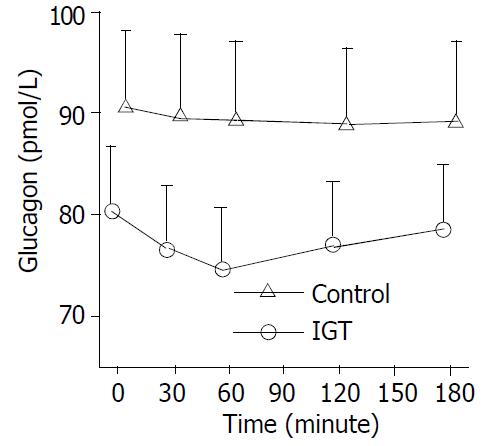
Figure 2 Circulation glucagon levels during hyperglycemia clamps in 20 patients of control group (○-○) and in 20 pa-tients of IGT group (△-△).
Mean ± S.E.M. in human sepsis. In control group, plasma glucagon levels decreased from a basal value to the lowest level within half an hour (P < 0.01) and a low level maintained, and was not significantly declined in IGT group in the entire observation period.
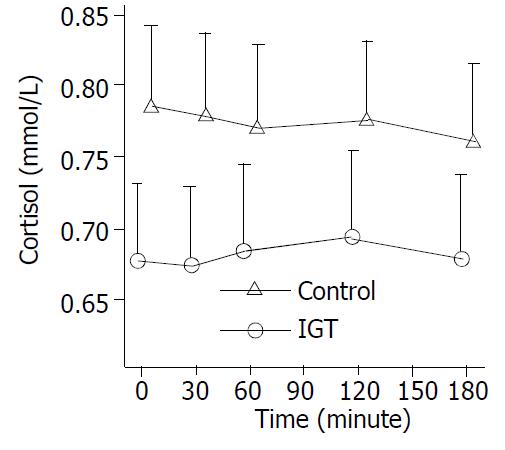
Figure 3 Circulation cortisol levels during hyperglycemia clamps in 20 patients of control group (○-○) and in 20 pa-tients of IGT group (△-△).
Mean ± S.E.M. in human sepsis. There were no significant changes in two groups.
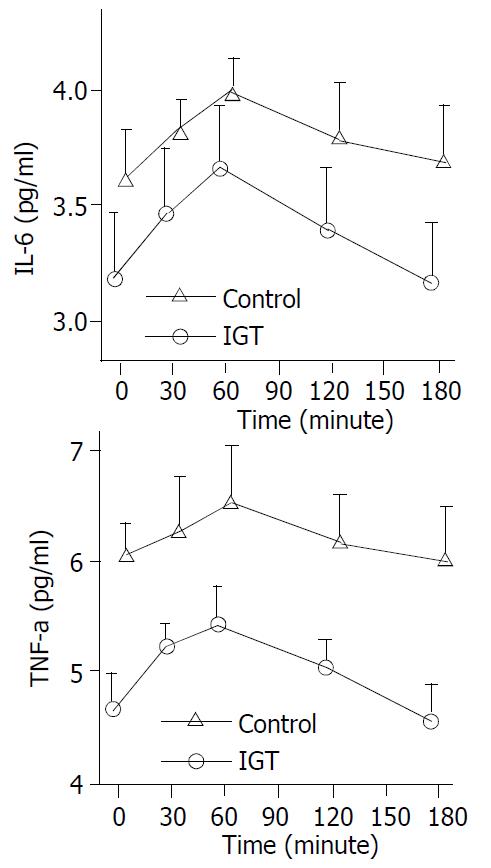
Figure 4 Circulation IL-6, TNF-α levels during hyperglyce-mia clamps in 20 patients of control group (○-○) and in 20 patients of IGT group (△-△).
Mean ± S.E.M. in human sepsis. In two groups, plasma IL-6, TNF-α levels rose from a basal value to a peak within 1 hour (P < 0.01). In IGT group, increased level of plasma TNF-α, IL-6 during the clamping lasted longer than in control group (3 hours vs. 2 hours; P < 0.05).
- Citation: Yu WK, Li WQ, Li N, Li JS. Influence of acute hyperglycemia in human sepsis on inflammatory cytokine and counterregulatory hormone concentrations. World J Gastroenterol 2003; 9(8): 1824-1827
- URL: https://www.wjgnet.com/1007-9327/full/v9/i8/1824.htm
- DOI: https://dx.doi.org/10.3748/wjg.v9.i8.1824


