Copyright
©The Author(s) 2003.
World J Gastroenterol. Aug 15, 2003; 9(8): 1808-1814
Published online Aug 15, 2003. doi: 10.3748/wjg.v9.i8.1808
Published online Aug 15, 2003. doi: 10.3748/wjg.v9.i8.1808
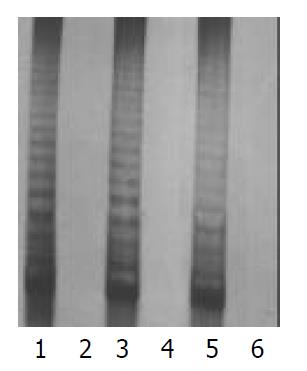
Figure 1 Telomerase activity of fibroblasts and P3 cells of dif-ferent generations (1, 3 and 5 were P3 cells of the 10th, 20th, and 30th generations; 2, 4, and 6 were fibroblasts of the 10th, 20th, and 30th generations).
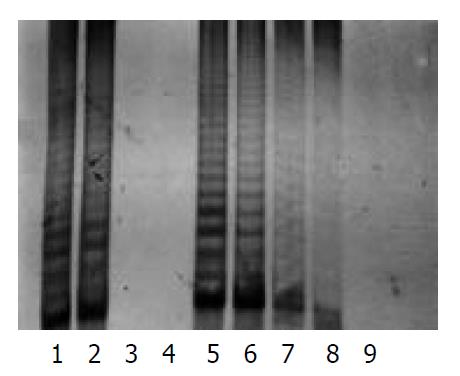
Figure 2 Specificity and sensitivity of telomerase activities in P3 cells (1, 293 cells as the positive control; 2,104 P3 cells; 3, treated with RNase; 4, heat treated; 5, 6, 7, and 8 were 103, 102, 101, and 100 P3 cells, respectively; 9, the lytic liquid).
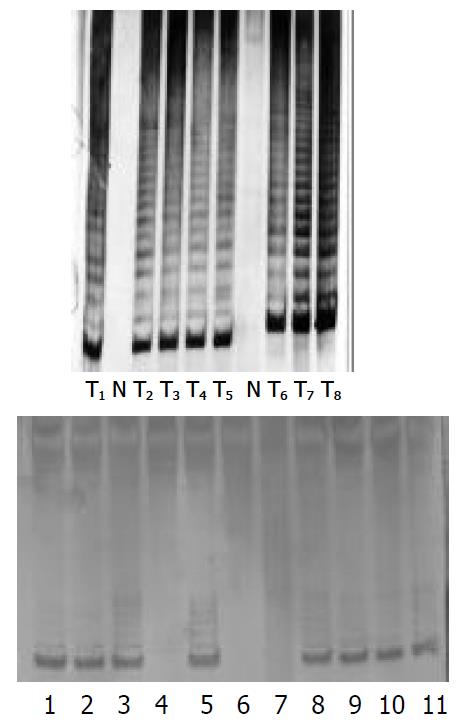
Figure 3 a: Telomerase activity of tumor and normal pancreas (T: tumor; N: normal).
b: Semiquantitative telomerase activity of tumor and normal pancreas (1 2 3; 5 4 6; 9 10 11: T10, T15 T18 6 μg 0.6 μg 0.06 μg; 7: negative control, 8: positive control; T: tumor).
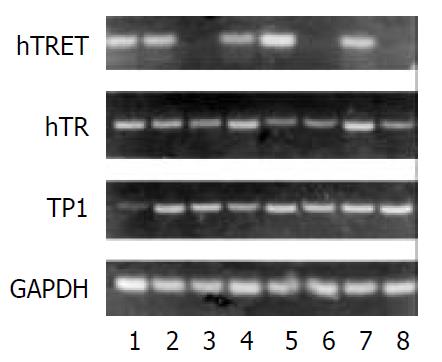
Figure 4 Telomerase subunit expression of pancreatic carci-noma (1: P3; 2: PaTu-8801; 3: fibroblast cell line; 4, 5, 7: tumor; 6, 8: normal).
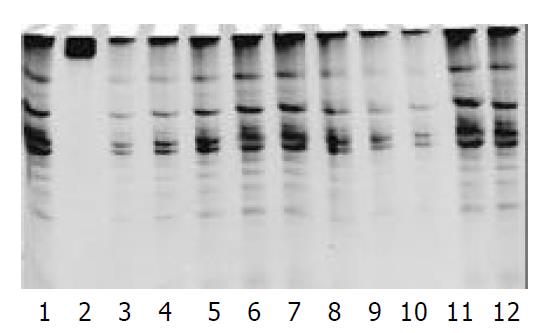
Figure 5 Telomerase activity after treated with PS-ODN in P3 cell line (1: positive control; 2: negative control; 3-6: 100 μmol/ L, 31.
60 μmol/L, 10 μmol/L, 3.16 μmol/L PS-ODN1 groups; 7-10: 3.16 μmol/L,10 μmol/L, 31.60 μmol/L, 100 μmol/L PS-ODN2 group; 11: 100 μmol/L PS-ODN3 group; 12: 100 μmol/L PS-ODN4 groups).
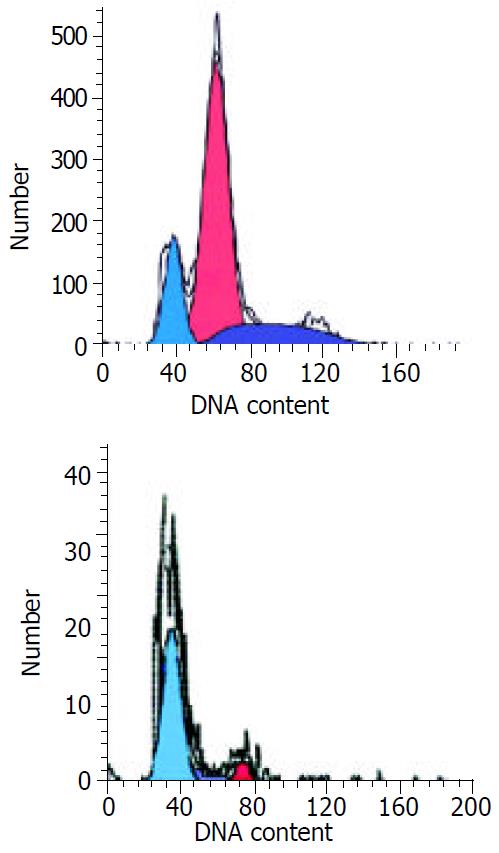
Figure 6 The apoptotic rate of P3 cells by the FCM test after treatment in P3 cells with PS-ODN.
A: PS-ODN1 10 μmol/L group; B: PS-ODN1 100 μmol/L group.
- Citation: Zhou JH, Zhang HM, Chen Q, Han DD, Pei F, Zhang LS, Yang DT. Relationship between telomerase activity and its subunit expression and inhibitory effect of antisense hTR on pancreatic carcinoma. World J Gastroenterol 2003; 9(8): 1808-1814
- URL: https://www.wjgnet.com/1007-9327/full/v9/i8/1808.htm
- DOI: https://dx.doi.org/10.3748/wjg.v9.i8.1808


