Copyright
©The Author(s) 2003.
World J Gastroenterol. Aug 15, 2003; 9(8): 1804-1807
Published online Aug 15, 2003. doi: 10.3748/wjg.v9.i8.1804
Published online Aug 15, 2003. doi: 10.3748/wjg.v9.i8.1804
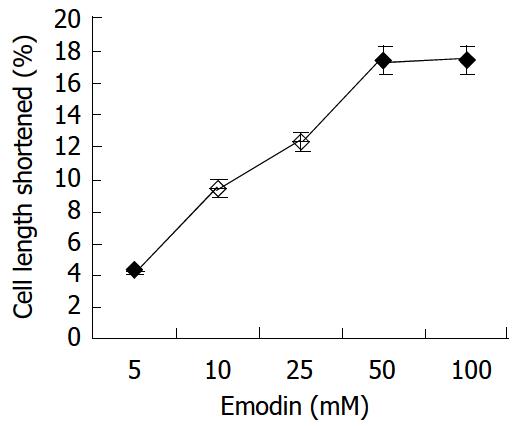
Figure 1 Contractile effect of emodin on isolated smooth muscle cell.
Values were calculated as means ± SE from 3 experiments.
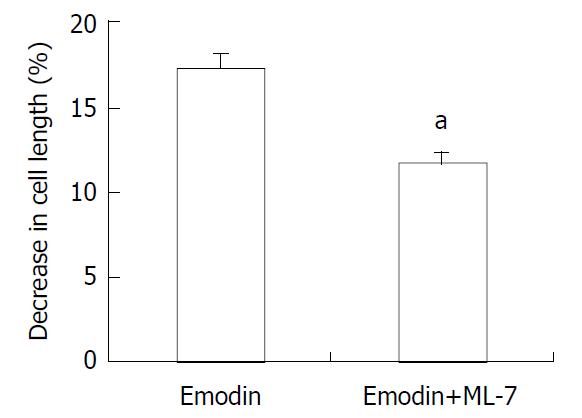
Figure 2 Effect of ML-7 on emodin-induced contraction of smooth muscle cells.
Values were means ± SE of 3 experiments. aP < 0.05 by Student’s t-test.
Figure 3 Timecourse changes of [Ca2+]i induced by emodin in a circular colonic smooth muscle cells (analysed by BioRad Laserpix software).
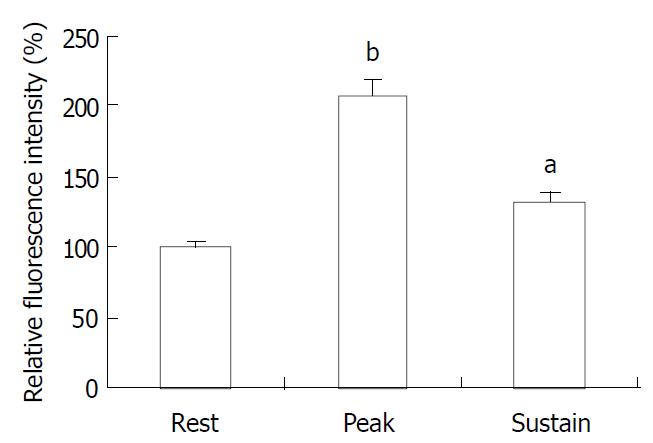
Figure 4 Average peak and sustained changes in [Ca2+]i in response to emodin (50 μmol/L).
aP < 0.05, bP < 0.001.
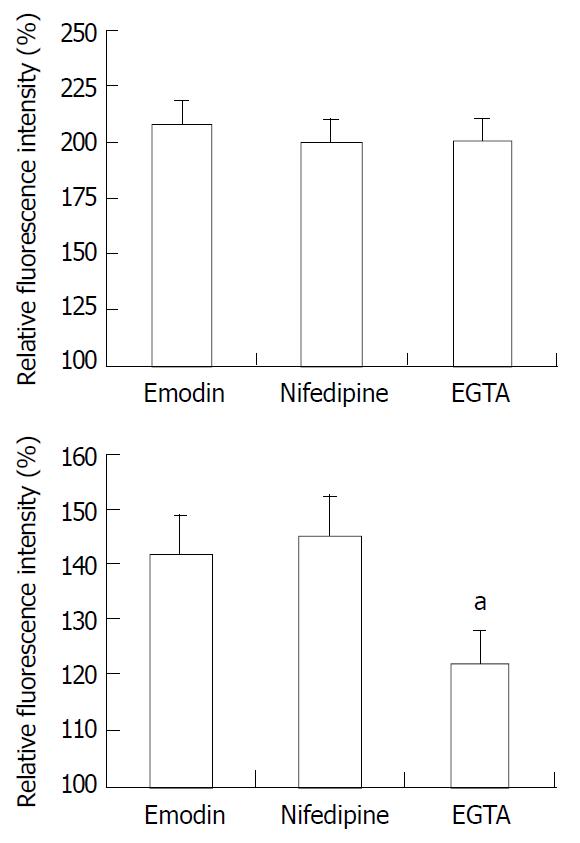
Figure 5 Average peak (top) and sustained (bottom) changes in [Ca2+]i in response to emodin under control conditions, in the presence of nifedipine, and EGTA solution.
n = 15. aP < 0.05 vs emodin group.
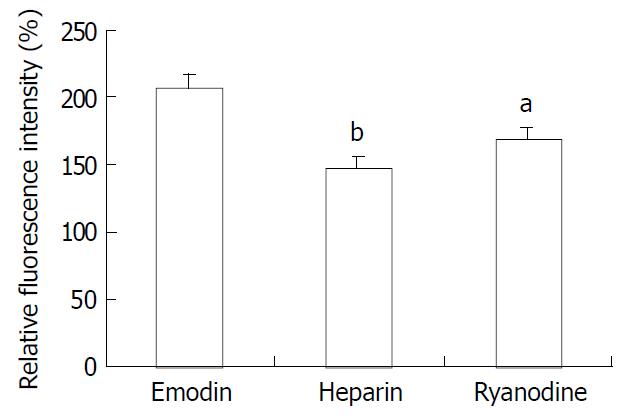
Figure 6 Effect of ryanodine and heparin on the change in [Ca2+]i induced by emodin.
n = 15 aP < 0.05 vs emodin group bP < 0.01 vs emodin group.
- Citation: Ma T, Qi QH, Yang WX, Xu J, Dong ZL. Contractile effects and intracellular Ca2+ signalling induced by emodin in circular smooth muscle cells of rat colon. World J Gastroenterol 2003; 9(8): 1804-1807
- URL: https://www.wjgnet.com/1007-9327/full/v9/i8/1804.htm
- DOI: https://dx.doi.org/10.3748/wjg.v9.i8.1804


