Copyright
©The Author(s) 2003.
World J Gastroenterol. Aug 15, 2003; 9(8): 1786-1790
Published online Aug 15, 2003. doi: 10.3748/wjg.v9.i8.1786
Published online Aug 15, 2003. doi: 10.3748/wjg.v9.i8.1786
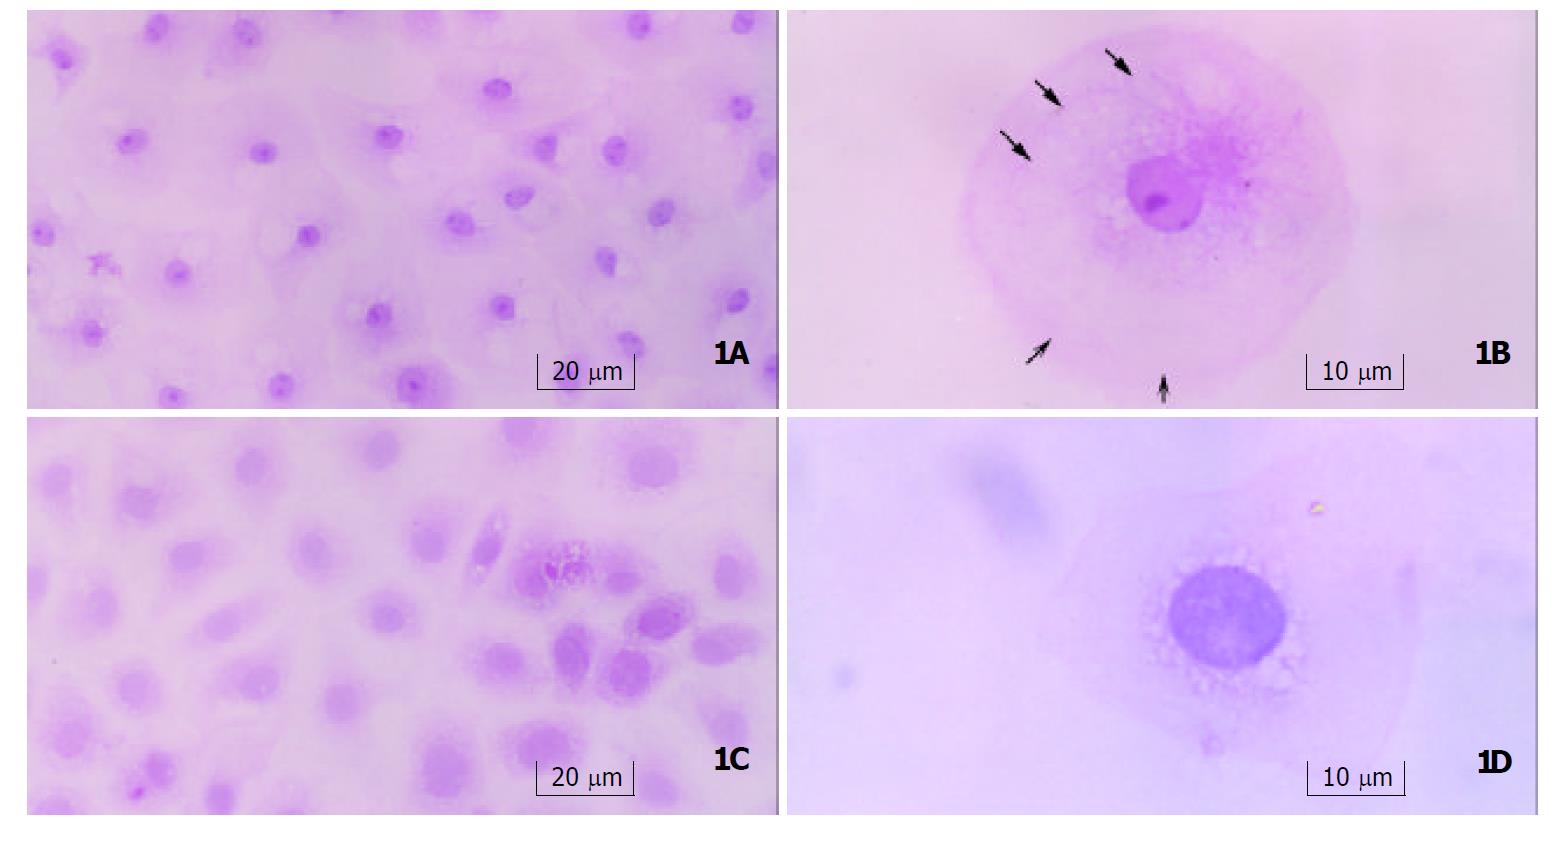
Figure 1 Morphology of IEC-6 cells.
a: Gastrin-treated cells(250×) contained an abundance of plasma, small nuclei with nucleoli, and were arranged regularly. b: One of gastrin-treated cells (400×) showed the tendency to form microvilli on the edge(open arrows), and cytoskeleton-like staining in plasma (solid arrows). c: Control cells (250×) contained sparse plasma, large nuclei without nucleoli, and were in irregular arrangement and immature shape. d: One of control cells (400×) showed no tendency to form microvilli on the edge, and nucleus was relatively larger and had no nucleolus.
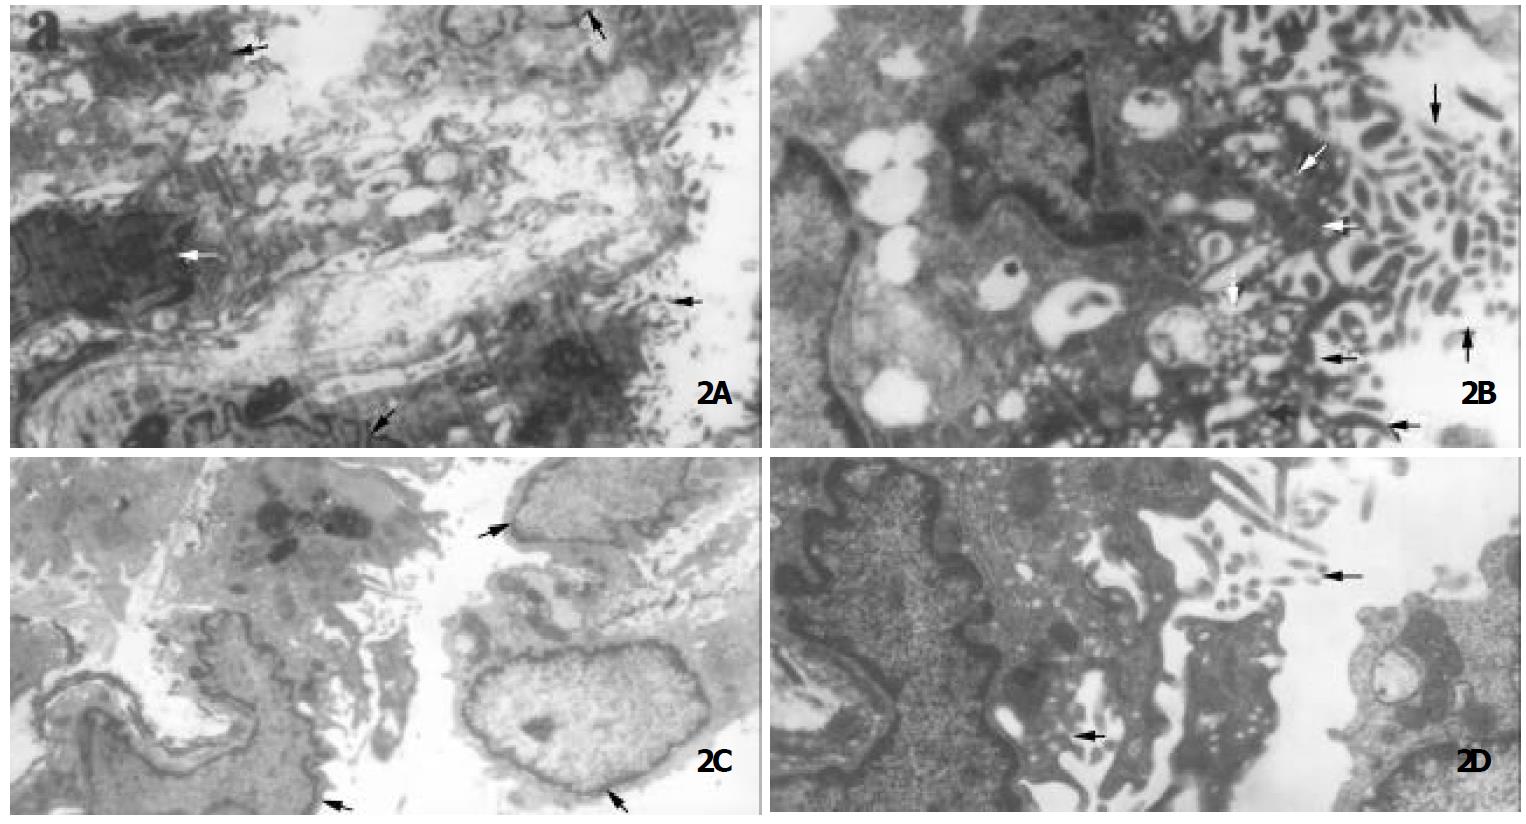
Figure 2 Ultrastructural changes of IEC-6 cells.
a: Gastrin-treated cells (5000×, bar = 1 μm) showed columnar structures(the nuclei were shown by open arrows) with numerous microvilli on the edge (solid arrows). b: Gastrin-treated cells (12000×, bar = 500 nm)developed numerous microvilli (open arrows) and lots of endocytic vesicles appeared under the apical membrane (solid arrows). c: Control cells (5000×, bar = 1 μm) were thin and flat. Relatively large nuclei (open arrows) and scanty plasma were observed. d: Only sparse microvilli (open arrow) and endocytic vesicles (solid arrow) were seen in control cells (12000×, bar = 500 nm).
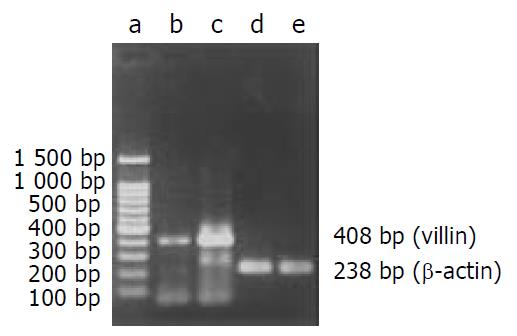
Figure 3 RT-PCR products from IEC-6 cells on agarose electrophoresis.
a: Marker (brighter band: 500 bp), b: Control, c: Gastrin treated cells, d: β-actin(Control), e: β-actin (Gastrin).
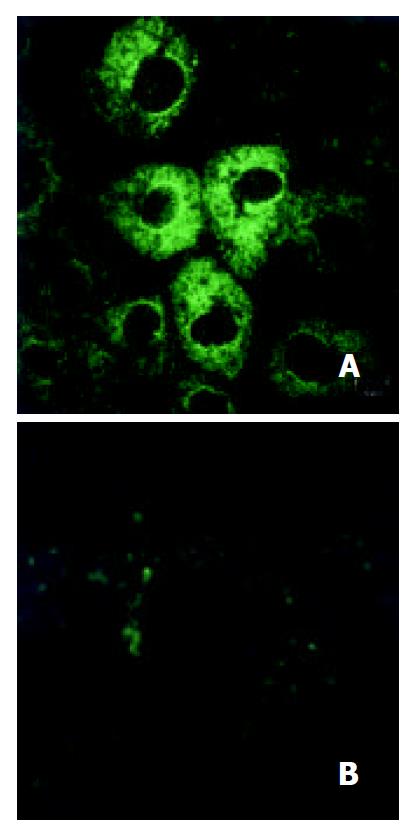
Figure 4 Villin expression in IEC-6 cells.
a: Gastrin-treated cells (800×), b: Control cells (800×).
-
Citation: Wang Z, Chen WW, Li RL, Wen B, Sun JB. Effect of gastrin on differentiation of rat intestinal epithelial cells
in vitro . World J Gastroenterol 2003; 9(8): 1786-1790 - URL: https://www.wjgnet.com/1007-9327/full/v9/i8/1786.htm
- DOI: https://dx.doi.org/10.3748/wjg.v9.i8.1786


