Copyright
©The Author(s) 2003.
World J Gastroenterol. Aug 15, 2003; 9(8): 1781-1785
Published online Aug 15, 2003. doi: 10.3748/wjg.v9.i8.1781
Published online Aug 15, 2003. doi: 10.3748/wjg.v9.i8.1781
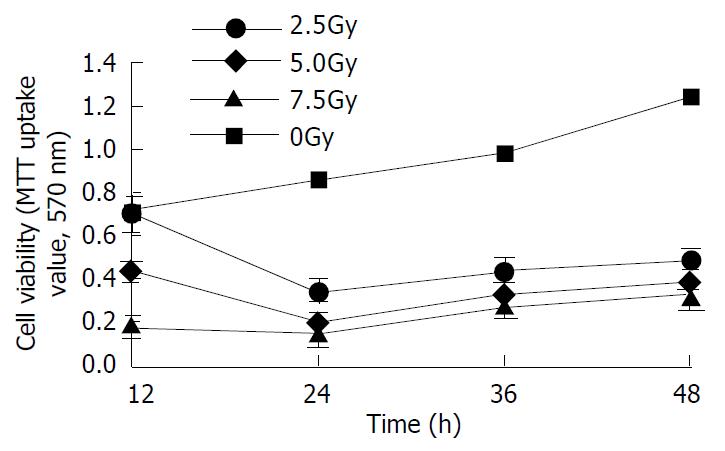
Figure 1 X-ray induced inhibition of growth of L02 cells.
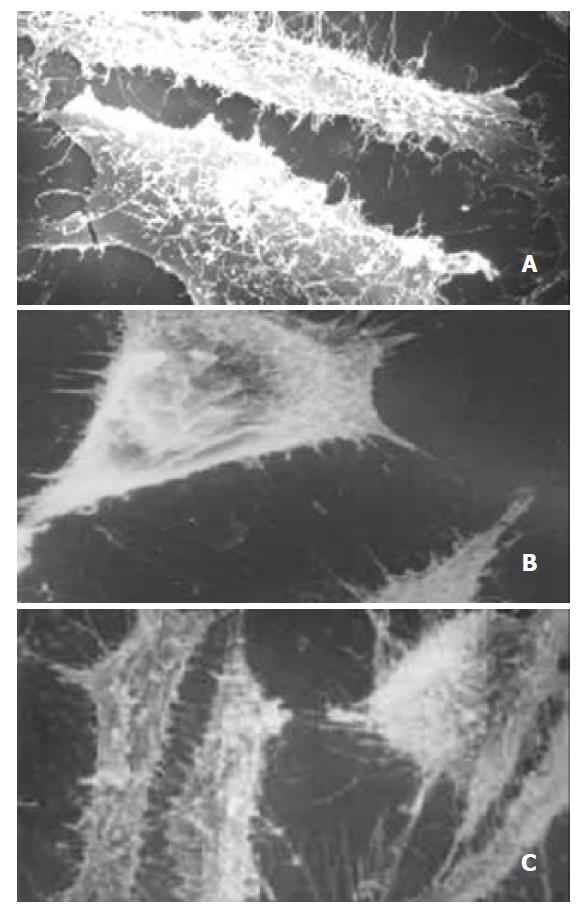
Figure 2 The result of scan electron microscopy.
(a) Normal liver cell surface structure. (b) Irradiated hepatocytes with atrophy and decreased protuberance. (c) Morphological changes of hepatocytes irradiated and incubated in the pres-ence of NADH.
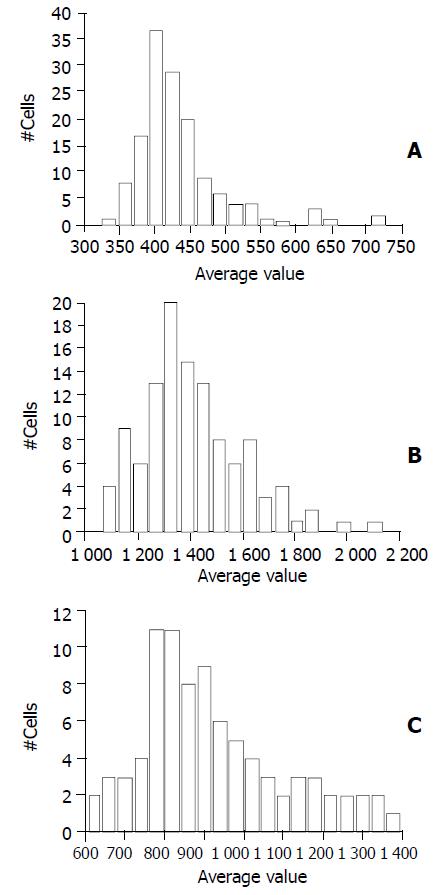
Figure 3 The change of intracellular H2O2 production in L02 cells cultured with or without NADH for 4 h after X-ray irradiation.
(a) Sham irradiation group. (b and c) X-ray treated (2.5 Gy) L02 cells were respectively cultured in the absence or presence of NADH. Mean value of fluorescence was calculated according to the number of L02 cells. aP<0.05 compared with sham irradiation (a) and test group (c).
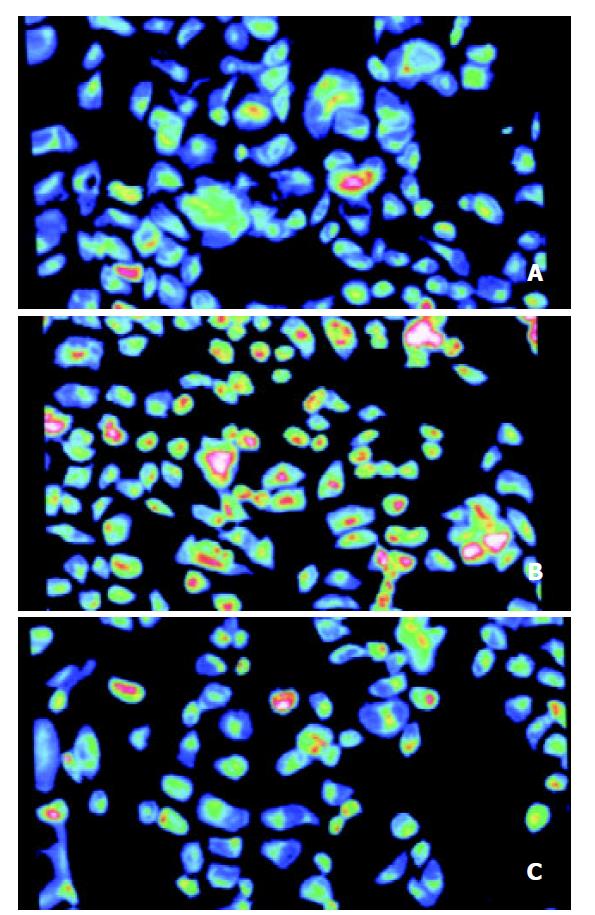
Figure 4 The graph showed the cell fluorescence change of intracellular ROS by confocal microscope scanning in L02 cells of different treatment.
- Citation: Liu FQ, Zhang JR. X-ray induced L02 cells damage rescued by new anti-oxidant NADH. World J Gastroenterol 2003; 9(8): 1781-1785
- URL: https://www.wjgnet.com/1007-9327/full/v9/i8/1781.htm
- DOI: https://dx.doi.org/10.3748/wjg.v9.i8.1781


