Copyright
©The Author(s) 2003.
World J Gastroenterol. Jul 15, 2003; 9(7): 1554-1558
Published online Jul 15, 2003. doi: 10.3748/wjg.v9.i7.1554
Published online Jul 15, 2003. doi: 10.3748/wjg.v9.i7.1554
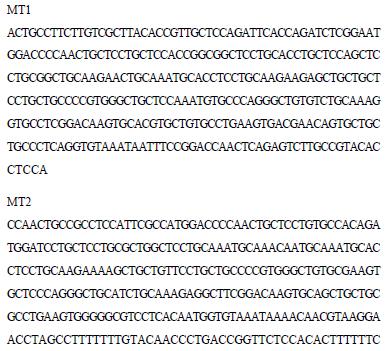
Figure 1 DNA sequences of RT-PCR products from rat testis.
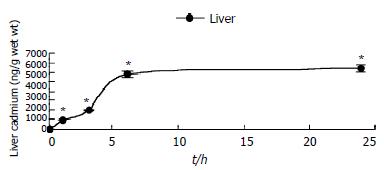
Figure 2 Time course of Cd accumulation in liver after a single subcutaneous injection of 4 μmol Cd/kg.
The values were the mean S.E. (n = 3). An asterisk indicated a significant difference (*P < 0.05 vs control) from the untreated.
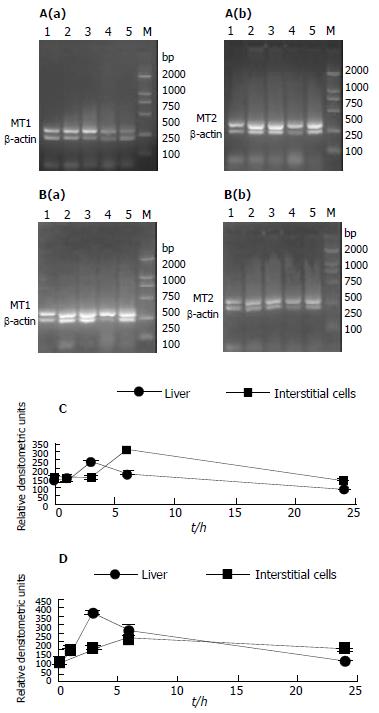
Figure 3 Effect of cadmium treatment on MT1(a) and MT2(b) mRNA levels in testicular interstitial cells (B) and the liver (A) of untreated rats (0h) and Cd-treated rats after 1 h, 3 h, 6 h, or 24 h (lanes 1-5).
Values were obtained by RT-PCR analysis followed by densitometry scanning and expressed as MT1(C) or MT2(D) mRNA RT-PCR products to β-actin mRNA RT-PCR products ratio. Data represented the mean SE (n = 9, three treatment replicates with three analyses per replicate).
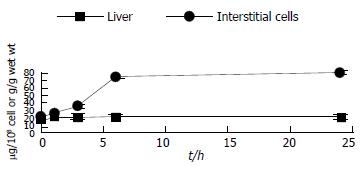
Figure 4 Metallothionein protein in testicular interstitial cells and liver of untreated and Cd-treated rats.
Experimental conditions are shown in Figure 3. The values were the mean S.E. (n = 3).
-
Citation: Ren XY, Zhou Y, Zhang JP, Feng WH, Jiao BH. Expression of
metallothionein gene at different time in testicular interstitial cells and liver of rats treated with cadmium. World J Gastroenterol 2003; 9(7): 1554-1558 - URL: https://www.wjgnet.com/1007-9327/full/v9/i7/1554.htm
- DOI: https://dx.doi.org/10.3748/wjg.v9.i7.1554


