Copyright
©The Author(s) 2003.
World J Gastroenterol. Jul 15, 2003; 9(7): 1525-1528
Published online Jul 15, 2003. doi: 10.3748/wjg.v9.i7.1525
Published online Jul 15, 2003. doi: 10.3748/wjg.v9.i7.1525
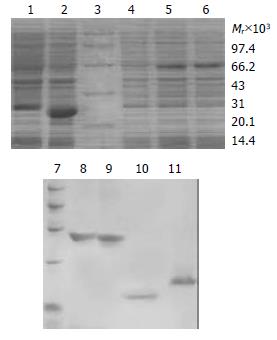
Figure 1 SDS-PAGE analysis of expression and purification for TAT fusion proteins.
1: Transformed by pTAT-HA/HBVc; 2: Transformed by pTAT-HA/hEDN; 3: Protein marker; 4: Transformed by pTAT-HA; 5: Transformed by pTAT-HA/TR; 6: Transformed by pTAT-HA/TRmut; 7: Protein marker; 8: Purified TAT-TN; 9: Purified TAT-TNmut; 10: Purified TAT-hEDN; 11. Purified TAT-HBVc.
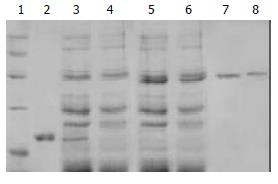
Figure 2 SDS-PAGE analysis of purified control proteins.
1: Protein marker; 2: Purified HBVc; 3: Expression product of BL21 transformed by pET30-a/HBVc; 4: Expression product of BL21 transformed by pET30-a; 5: Expression product of BL21 transformed by pET30-a/TR; 6. Expression product of BL21 transformed by pET30-a/TRmut; 7: Purified TR; 8: Purified TRmut.
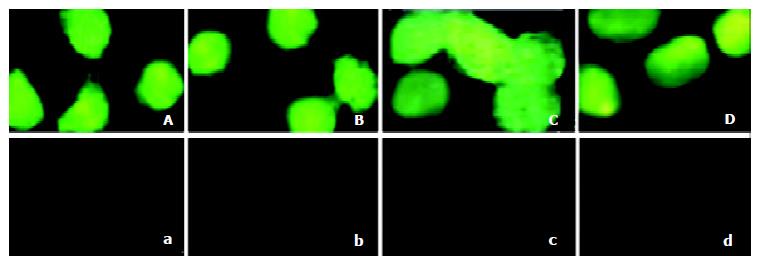
Figure 3 Detection of the transduction of the TAT fusion proteins in 2.
2.15 cells. A: Added with TAT-TR; B: Added with TAT-hEDN; C: Added with TAT-HBVc; D: Added with TAT-TRmut; a: Added with TR; b: Added with hEDN; c: Added with HBVc; d: Added with TRmut.
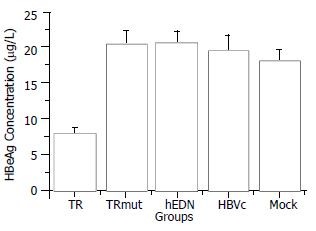
Figure 4 Comparison of HBeAg concentration between different groups.
- Citation: Ding J, Liu J, Xue CF, Gong WD, Li YH, Zhao Y. Anti-HBV effect of TAT- HBV targeted ribonuclease. World J Gastroenterol 2003; 9(7): 1525-1528
- URL: https://www.wjgnet.com/1007-9327/full/v9/i7/1525.htm
- DOI: https://dx.doi.org/10.3748/wjg.v9.i7.1525


