Copyright
©The Author(s) 2003.
World J Gastroenterol. Jul 15, 2003; 9(7): 1460-1464
Published online Jul 15, 2003. doi: 10.3748/wjg.v9.i7.1460
Published online Jul 15, 2003. doi: 10.3748/wjg.v9.i7.1460
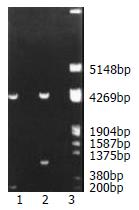
Figure 1 Fragment mapping analysis of recombinant plasmid digested with BglII and HindIII in gel electrophoresis.
Lane 1: pGL3 plasmid was cleaved into two fragments, which showed about 5000 bp and 200 bp respectively. Lane 2: Recombinant plasmid was cut into a fragment of about 5000 bp and the one of about 1000 bp. Lane 3: DNA marker.
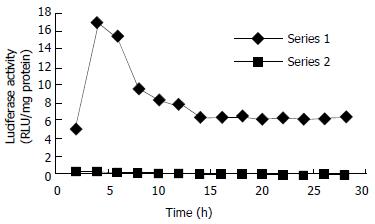
Figure 2 The time course of luciferase activities induced by TCDD and DMSO in stably transfected cells.
The TCDD-induced luciferase activity in HepG2-Luc cells peaked at about 4 h, and then decreased to a stable level at about 14 h after TCDD treatment.
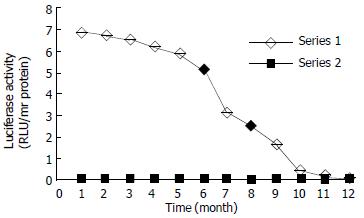
Figure 3 Responsive period of HepG2-Luc cells to TCDD induction.
The responsiveness of HepG2-Luc cells to TCDD induction was decreased with culture time and became undetectable at about 10th month.
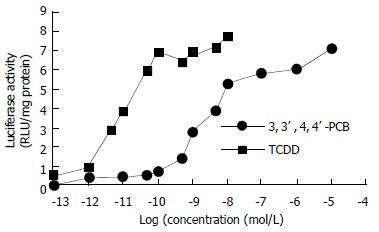
Figure 4 Comparison of luciferase activity induced by TCDD and 3, 3', 4, 4'-PCB in HepG2-Luc cells.
The luciferase activity induced by indicated concentrations of 3, 3', 4, 4'-PCB was much less than that induced by TCDD.
- Citation: Zhang ZR, Xu SQ, Sun X, Xu YJ, Cai XK, Liu ZW, Tan XL, Zhou YK, Zhang JY, Yan H. Characteristics and application of established luciferase hepatoma cell line that responds to dioxin-like chemicals. World J Gastroenterol 2003; 9(7): 1460-1464
- URL: https://www.wjgnet.com/1007-9327/full/v9/i7/1460.htm
- DOI: https://dx.doi.org/10.3748/wjg.v9.i7.1460


