Copyright
©The Author(s) 2003.
World J Gastroenterol. May 15, 2003; 9(5): 941-945
Published online May 15, 2003. doi: 10.3748/wjg.v9.i5.941
Published online May 15, 2003. doi: 10.3748/wjg.v9.i5.941
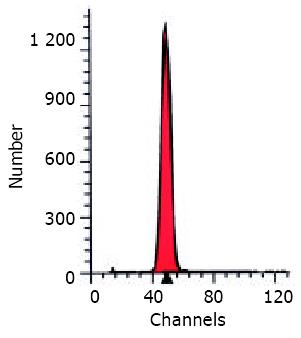
Figure 1 DNA analysis of aspiration biospy tissues acquired from intrahepatic benign hyperplastic nodules showed steady diploid (2C) peak that stayed in G1 period (single red peak).
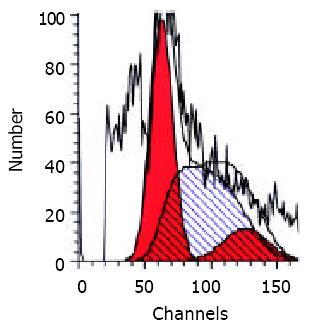
Figure 2 DNA analysis of aspiration biopsy tissues acquired from HCC nodules showed S period of hyperproliferation (the peak with oblique lines) and G2/M period (the second red peak).
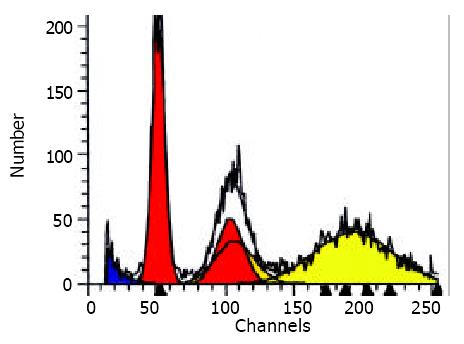
Figure 3 DNA analysis of HCC nodules showed aneuploid (AN) peak (the orange peak).
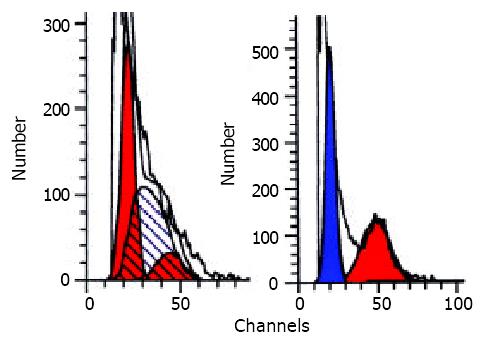
Figure 4 DNA a na lysis of HCC nodules showed hyperproliferation state before therapy (left) and apoptosis peak after therapy (the blue peak).
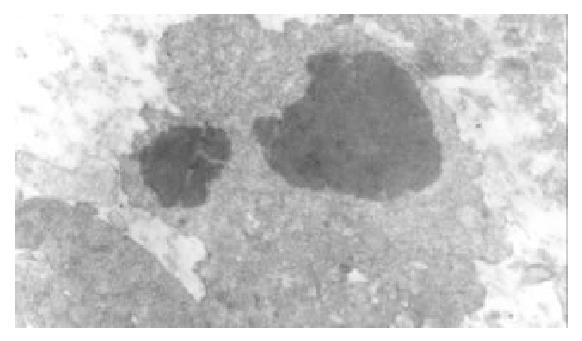
Figure 5 The same cases as those in figure.
4 appeared typical apoptosis cells and apoptosis bodies after therapy.
- Citation: Lin LW, Lin XY, He YM, Gao SD, Lin XD. Biological characteristics of HCC by ultrasound-guided aspiration biopsy and its clinical application. World J Gastroenterol 2003; 9(5): 941-945
- URL: https://www.wjgnet.com/1007-9327/full/v9/i5/941.htm
- DOI: https://dx.doi.org/10.3748/wjg.v9.i5.941


