Copyright
©The Author(s) 2003.
World J Gastroenterol. May 15, 2003; 9(5): 1094-1097
Published online May 15, 2003. doi: 10.3748/wjg.v9.i5.1094
Published online May 15, 2003. doi: 10.3748/wjg.v9.i5.1094
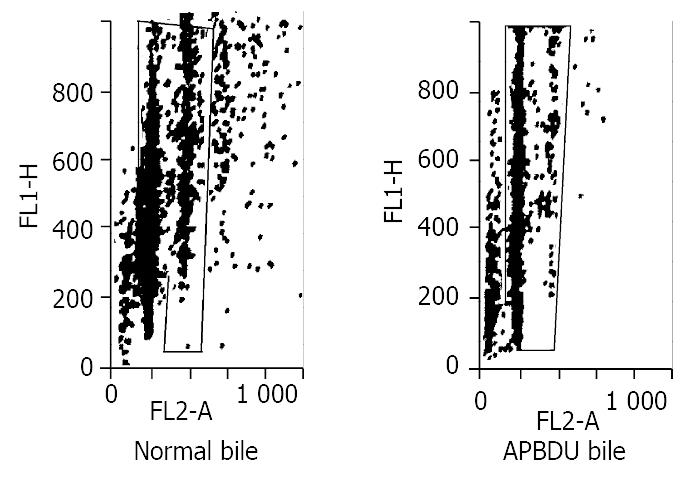
Figure 1 Representative data of cell cycle from QBC939 cells in the presence of 1% APBDU bile (S + G2/M = 65.
12%) or 1% normal bile (S + G2/M = 30.47%) for 24 h was analyzed by flow cytometry.
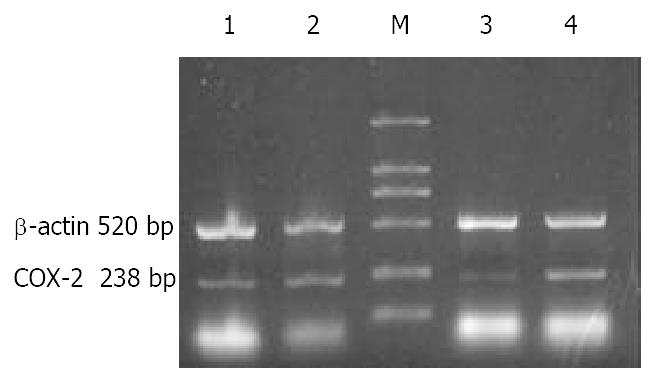
Figure 2 Expression of COX-2 mRNA, β-actin served as control.
M: DL2,000 marker; 1: normal bile; 2 and 4: APBDU; 3: PBS.
-
Citation: Wu GS, Zou SQ, Liu ZR, Wang DY. Bile from a patient with anomalous pancreaticobiliary ductal union promotes the proliferation of human cholangiocarcinoma cells
via COX-2 pathway. World J Gastroenterol 2003; 9(5): 1094-1097 - URL: https://www.wjgnet.com/1007-9327/full/v9/i5/1094.htm
- DOI: https://dx.doi.org/10.3748/wjg.v9.i5.1094


