Copyright
©The Author(s) 2003.
World J Gastroenterol. May 15, 2003; 9(5): 1067-1071
Published online May 15, 2003. doi: 10.3748/wjg.v9.i5.1067
Published online May 15, 2003. doi: 10.3748/wjg.v9.i5.1067
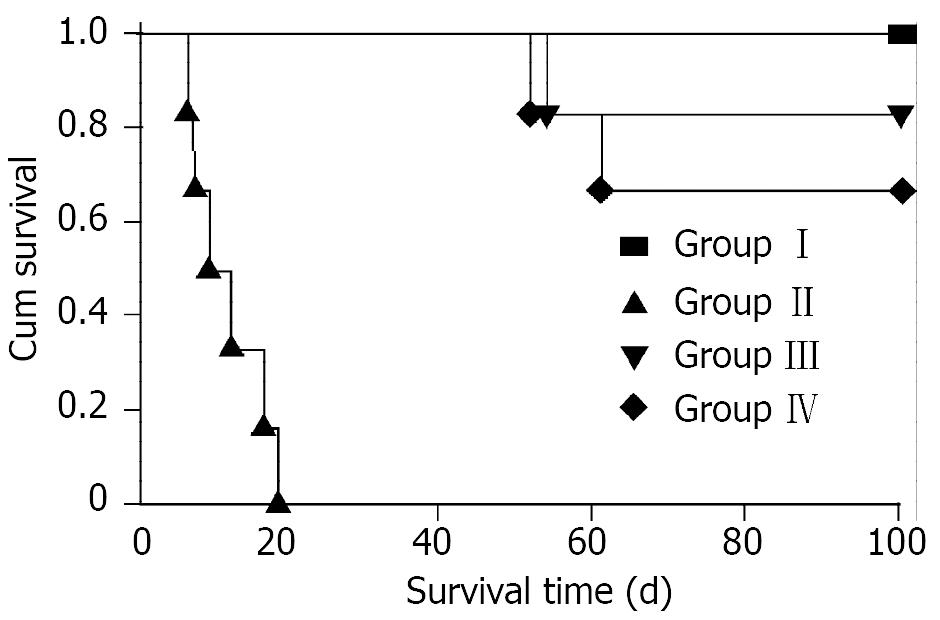
Figure 1 Effect of 1,25-(OH)2 D3 on survival of rat recipients of an othtopic liver allograft (Kaplan-Meier Survival Curve).
When Group III was compared with Grou II: P = 0.0005. When Group IV was compared with Grou II: P = 0.0005. When Group IV was compared with Group III: P = 0.70.
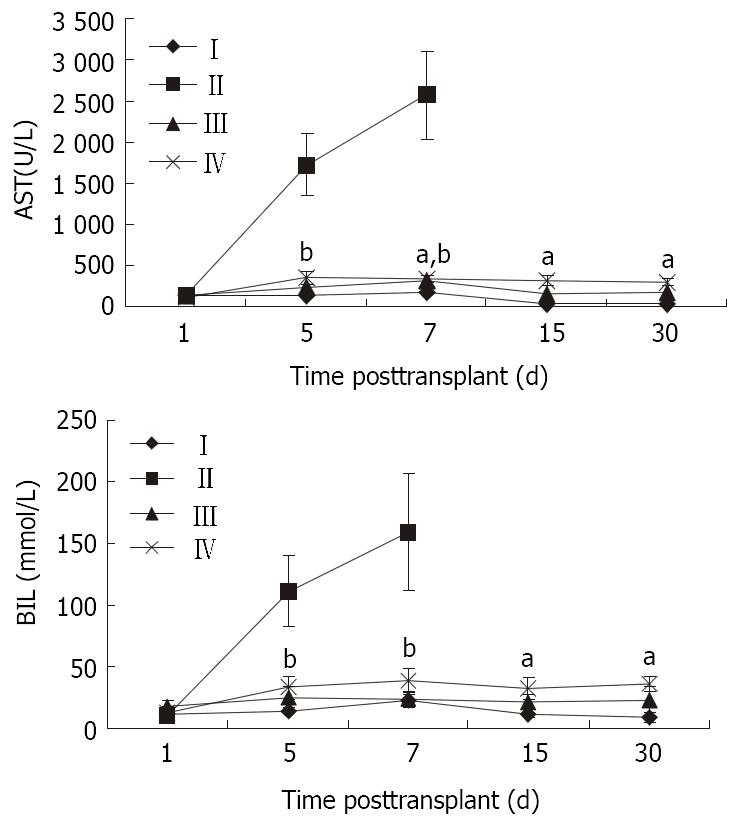
Figure 2 Effect of 1,25-(OH)2 D3 on graft function (-x±s).
aP < 0.05, vs Group I; bP < 0.05, vs Group II.
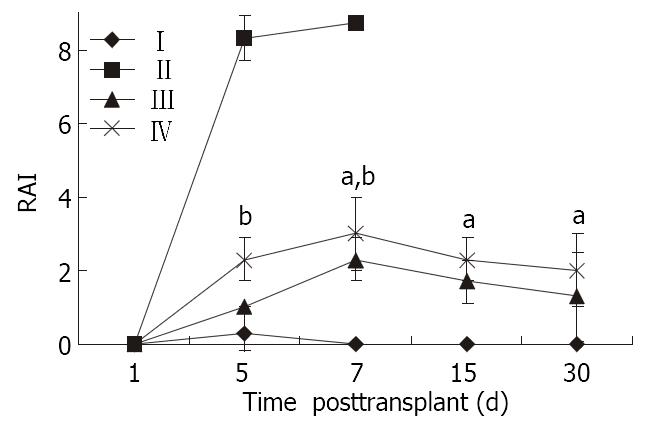
Figure 3 Effect of 1,25-(OH)2 D3 on Rejection Activity Index (RAI).
(-x±s). aP < 0.05, vs Group I; bP < 0.05 vs Group II.
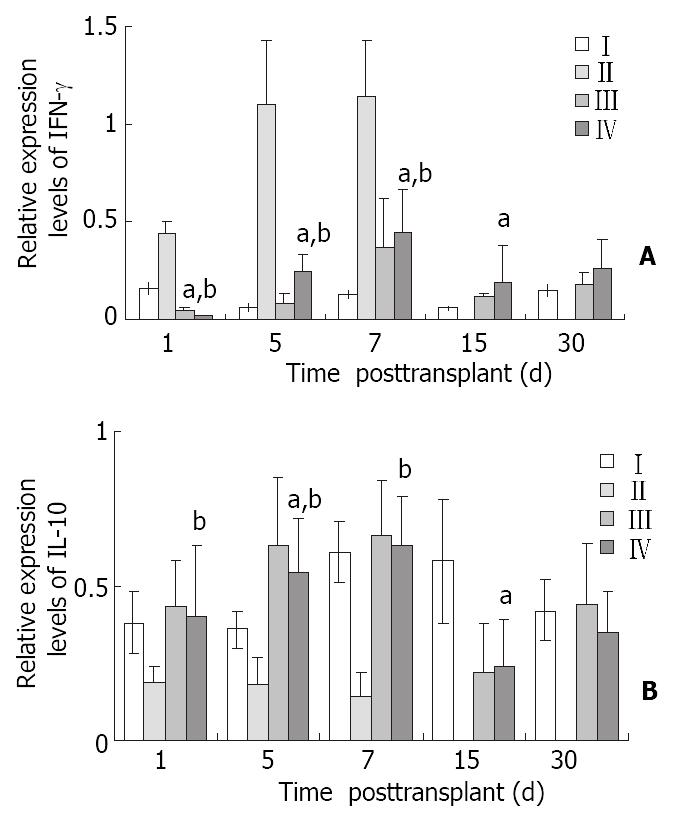
Figure 4 Effect of 1,25-(OH)2 D3 on IFN-γ and IL-10 gene transcription (-x±s, analyzed by RT-PCR).
aP < 0.05, vs Group I; bP < 0.05 vs Group II.
- Citation: Zhang AB, Zheng SS, Jia CK, Wang Y. Effect of 1,25-dihydroxyvitamin D3 on preventing allograft from acute rejection following rat orthotoic liver transplantation. World J Gastroenterol 2003; 9(5): 1067-1071
- URL: https://www.wjgnet.com/1007-9327/full/v9/i5/1067.htm
- DOI: https://dx.doi.org/10.3748/wjg.v9.i5.1067


