Copyright
©The Author(s) 2003.
World J Gastroenterol. May 15, 2003; 9(5): 1008-1013
Published online May 15, 2003. doi: 10.3748/wjg.v9.i5.1008
Published online May 15, 2003. doi: 10.3748/wjg.v9.i5.1008
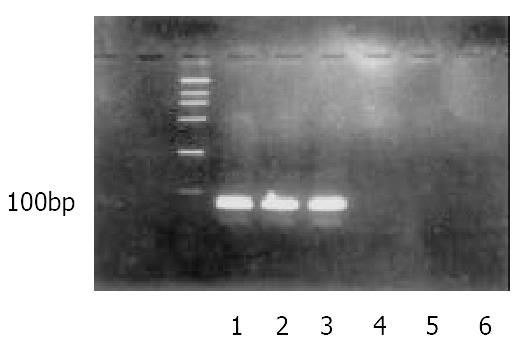
Figure 1 Detection IRNA or mIRNA in the total RNA of HHCCs which constitutionally expressing IRNA or mIRNA.
1: DNA Marker DL2000; 2 and 3: RT-PCR of cell lines expressing IRNA; 4: RT-PCR of cell lines expressing mIRNA; 5 and 6: PCR of cell lines expressing IRNA or mIRNA.
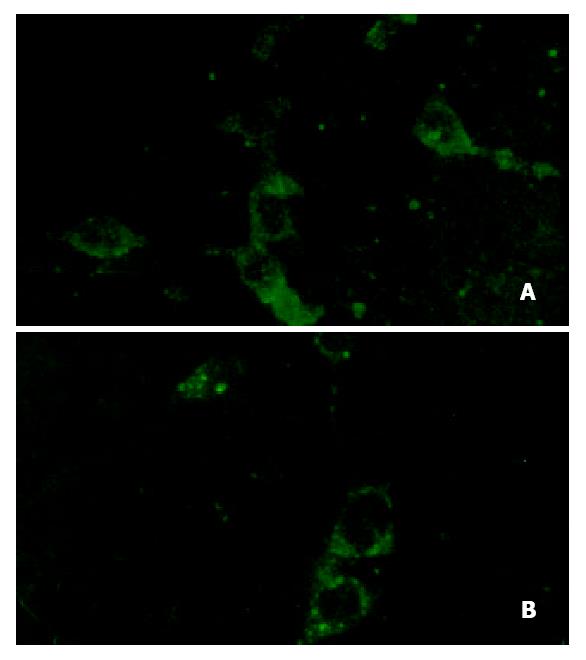
Figure 2 The translation level of β-actin in HHCC and IRNA-expressing lines.
(Laser confocal, 400 × 1.00). A: IRNA-express-ing cell lines, B: Control cell lines.
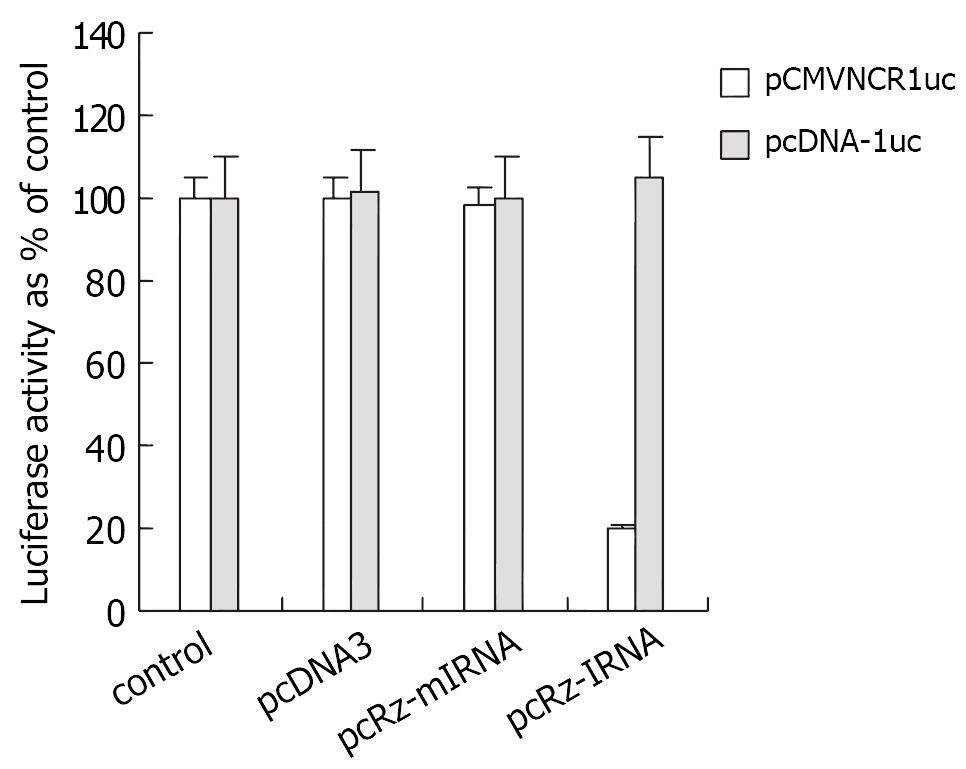
Figure 3 The effect of long-term expressing IRNA on cap-independent and cap-dependent protein translation.
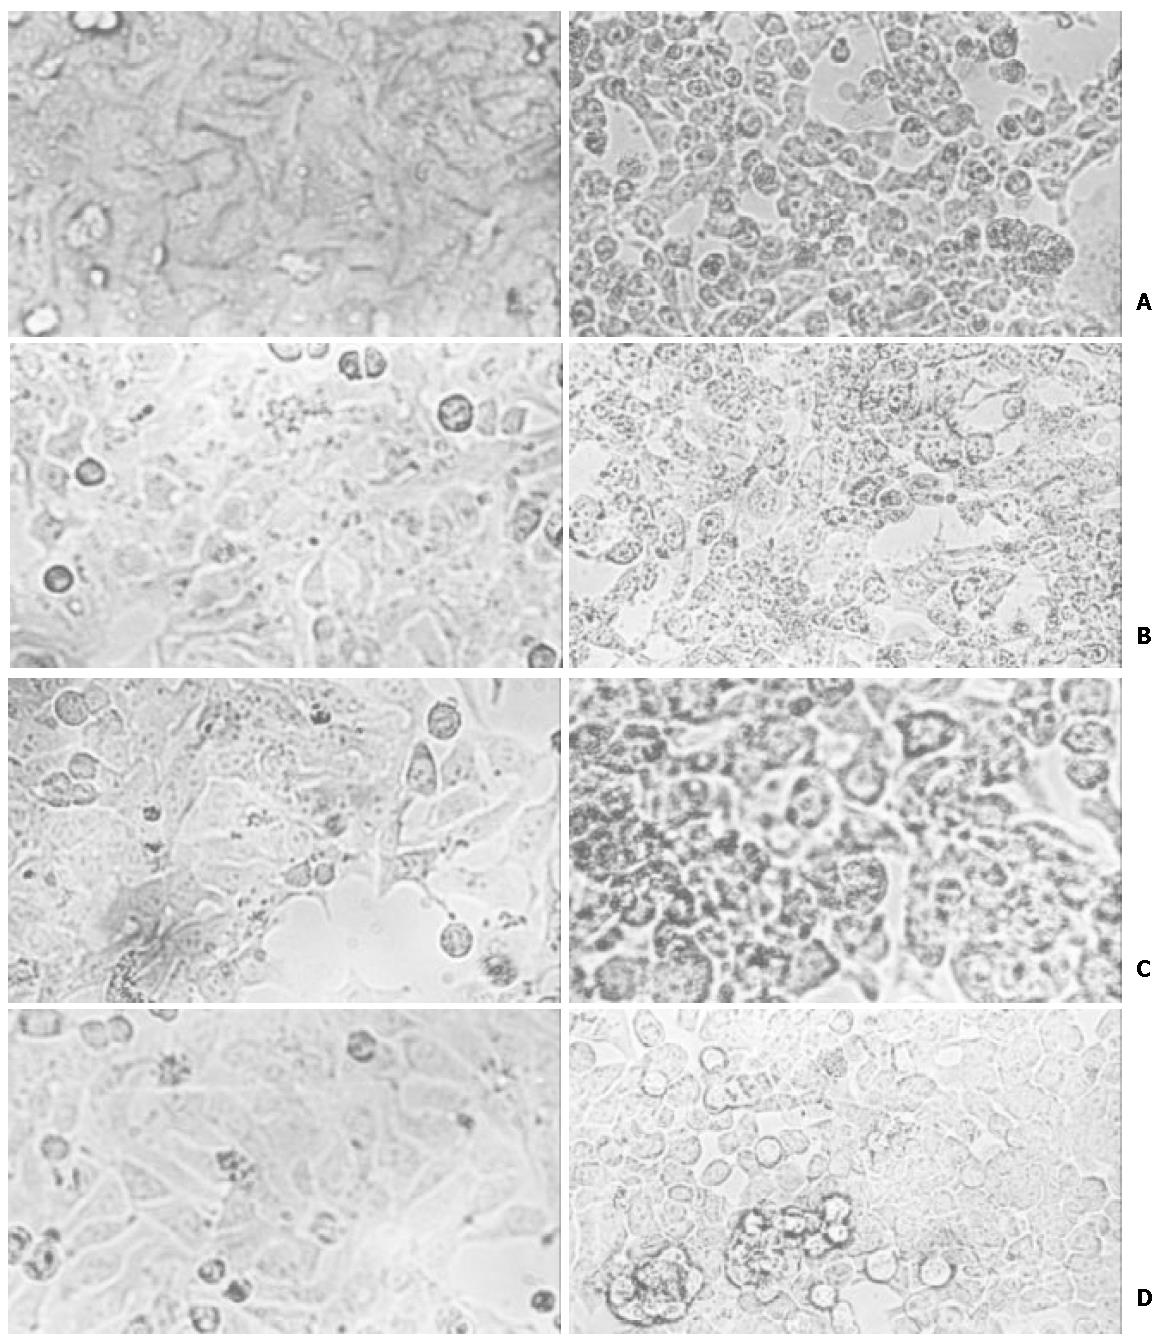
Figure 4 The cytopathic effect of different HHCC cells infected with PV.
A: control HHCC cells; B: mIRNA cells; C: pcDNA3 cells; D: IRNA cells.
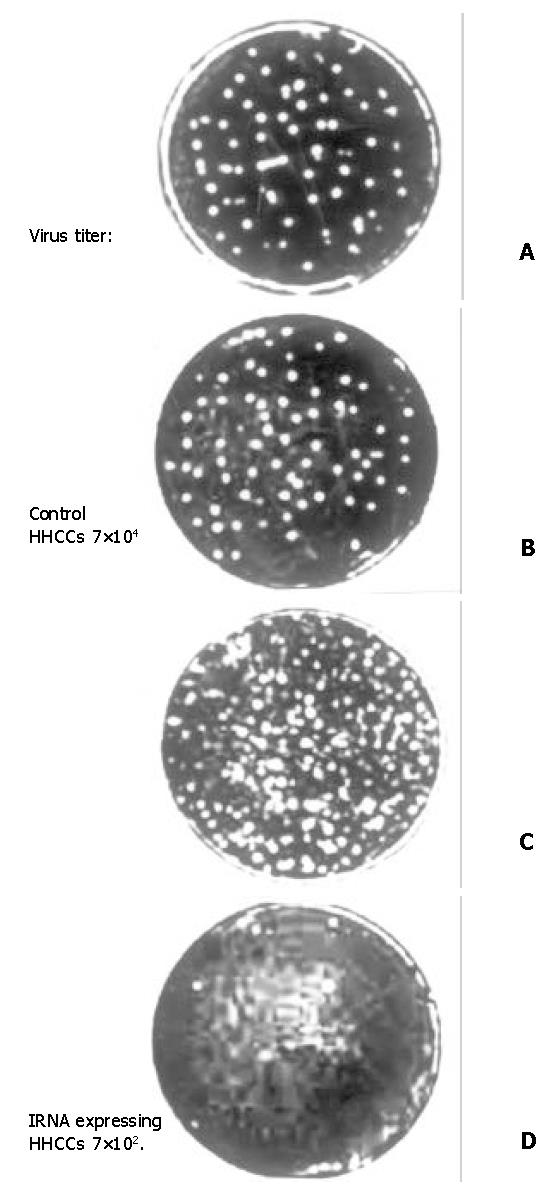
Figure 5 Plaque characteristic of different HHCC infected of PV.
A: control HHCC; B: mIRNA cells; C: pcDNA3 cells; D: IRNA cells.
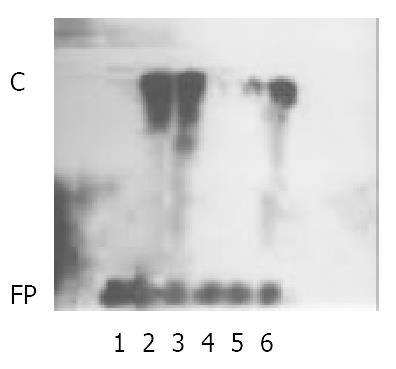
Figure 6 IRNA forms a gel-retarded complex which is inhibited by 5’ UTR of HCV RNA.
32P-labeled IRNA was incubated with RRL extract in the absence (lane 2) or presence of an unla-beled 25- or 50-fold molar excess of IRNA (lane3 and lane 4, respectively) or 5’ UTR (lane 5) or of a 50-fold molar excess of nonspecific RNA (lane 6). Protein-RNA complexes were analyzed on a nondenaturing gel. In lane 1, RRL extract was not added. FP: free probe; C: complexes.
-
Citation: Liang XS, Lian JQ, Zhou YX, Nie QH, Hao CQ. A small yeast RNA inhibits HCV IRES mediated translation and inhibits replication of poliovirus
in vivo . World J Gastroenterol 2003; 9(5): 1008-1013 - URL: https://www.wjgnet.com/1007-9327/full/v9/i5/1008.htm
- DOI: https://dx.doi.org/10.3748/wjg.v9.i5.1008


