Copyright
©The Author(s) 2003.
World J Gastroenterol. Feb 15, 2003; 9(2): 225-232
Published online Feb 15, 2003. doi: 10.3748/wjg.v9.i2.225
Published online Feb 15, 2003. doi: 10.3748/wjg.v9.i2.225
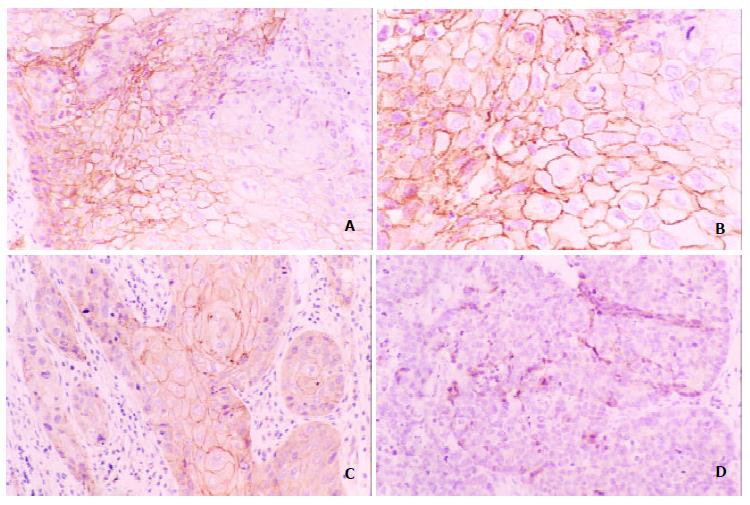
Figure 1 Expression of E-cadherin in esophageal squamous carcinoma tissue, brownish membrane and cytoplasm were shown in part of the tumor cells (A, B positive, C heterogeneous, D negative expression Original magnification × 200; B, Original magnification × 400).
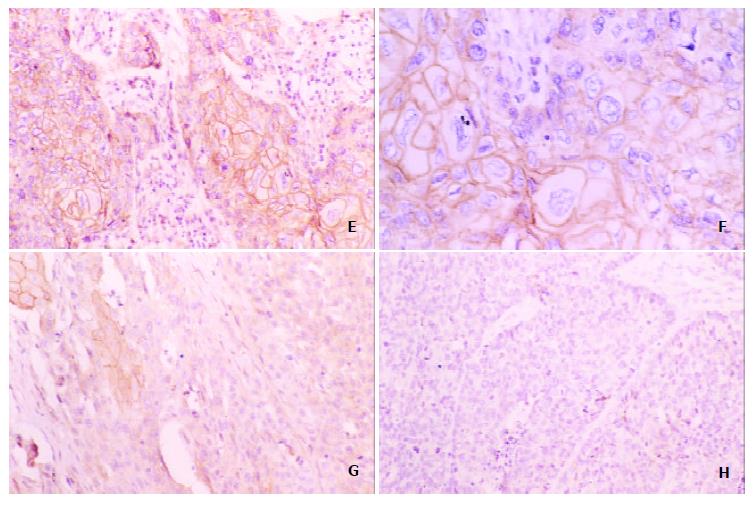
Figure 2 Expression of β-catenin in esophageal squamous carcinoma tissue ,brownish membrane and cytoplasm were shown in part of the tumor cells in the centers showing zonal differentiation (E, F positive, G heterogeneous, H negative expression Original magnification; H, Original magnification × 400)
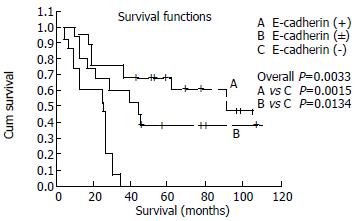
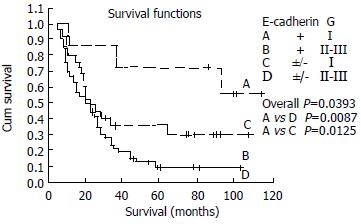
Figure 3 Kaplan-Meier survival curves for patients with stage I, II according to E-cadherin expression.
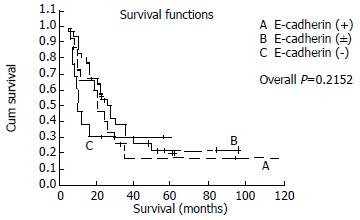
Figure 4 Kaplan-Meier survival curves for patients with stage III, IV according to E-cadherin expression.
Figure 5 Kaplan-Meier survival curves for patients with ESCC stratified for histologic grade according to E-cadherin expression
- Citation: Zhao XJ, Li H, Chen H, Liu YX, Zhang LH, Liu SX, Feng QL. Expression of e-cadherin and β-catenin in human esophageal squamous cell carcinoma: relationships with prognosis. World J Gastroenterol 2003; 9(2): 225-232
- URL: https://www.wjgnet.com/1007-9327/full/v9/i2/225.htm
- DOI: https://dx.doi.org/10.3748/wjg.v9.i2.225


