Copyright
©The Author(s) 2003.
World J Gastroenterol. Feb 15, 2003; 9(2): 205-208
Published online Feb 15, 2003. doi: 10.3748/wjg.v9.i2.205
Published online Feb 15, 2003. doi: 10.3748/wjg.v9.i2.205
Figure 1 RT-PCR analysis of ETS2 expression in ESCC tissues (Lanes C) and matched normal esophagus tissues (Lanes N).
Glyceraldehyde-3-phosphate dehydrogenase (GAPDH) was used as an internal control. PCR product sizes were 229bp for ETS2 and 452bp for GAPDH.
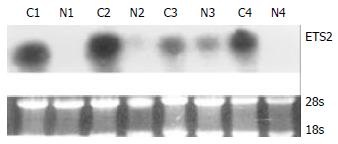
Figure 2 Northern blot results of ETS2 gene in ESCC tissues (designated as C) and matched normal esophagus tissues (designated as N).
Thirty-microgram total RNA of each sample was resolved by formaldehyde gel electrophoresis, transferred to a nylon membrane, and hybridized with 32P-labelled ETS2 probe.
Figure 3 Elevation of ETS2 protein expression in paired ESCC tissue samples detected by Western blot.
Total protein was extracted from the tissues and equal amounts of total protein of each sample (30 μg) were loaded. Blots were hybridized with anti-ETS2 antibody (1:500). An enhanced chemiluminescence system (ECL) was used for signal detection. The molecular weight of ETS2 protein is 56 kD.
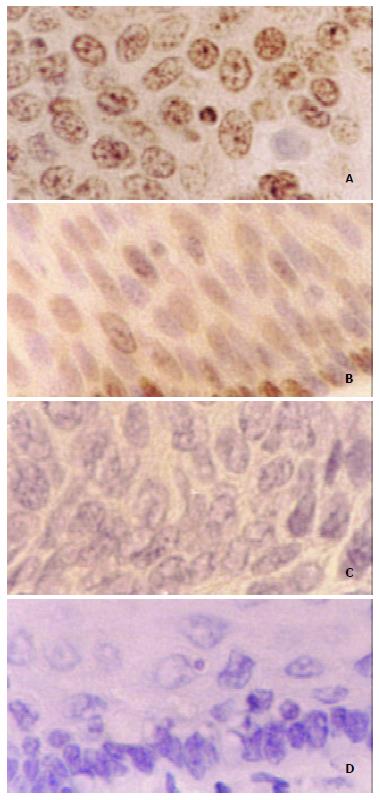
Figure 4 Immunohistochemistry analysis for ETS2 protein in paired ESCC tissue samples using anti-ETS2 antibody (1:50).
Diffuse and strong staining was detected in the nucleus of the ESCC epithelial cells (A), while sporadic and weak staining was observed in the nucleus of matched normal esophageal epithelial cells (B). No positive staining was observed in negative controls (C) (D). (original magnification × 400).
- Citation: Li X, Lu JY, Zhao LQ, Wang XQ, Liu GL, Liu Z, Zhou CN, Wu M, Liu ZH. Overexpression of ETS2 in human esophageal squamous cell carcinoma. World J Gastroenterol 2003; 9(2): 205-208
- URL: https://www.wjgnet.com/1007-9327/full/v9/i2/205.htm
- DOI: https://dx.doi.org/10.3748/wjg.v9.i2.205


