Copyright
©The Author(s) 2003.
World J Gastroenterol. Dec 15, 2003; 9(12): 2776-2781
Published online Dec 15, 2003. doi: 10.3748/wjg.v9.i12.2776
Published online Dec 15, 2003. doi: 10.3748/wjg.v9.i12.2776
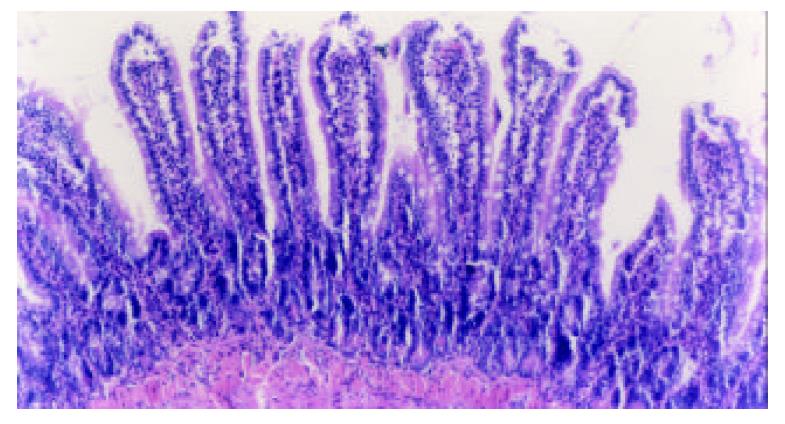
Figure 1 Epithelial cells shed from the top of villi with almost normal villous height and well defined arrangement of villi at 3 hours following TBI.
H-E, magnification × 100.
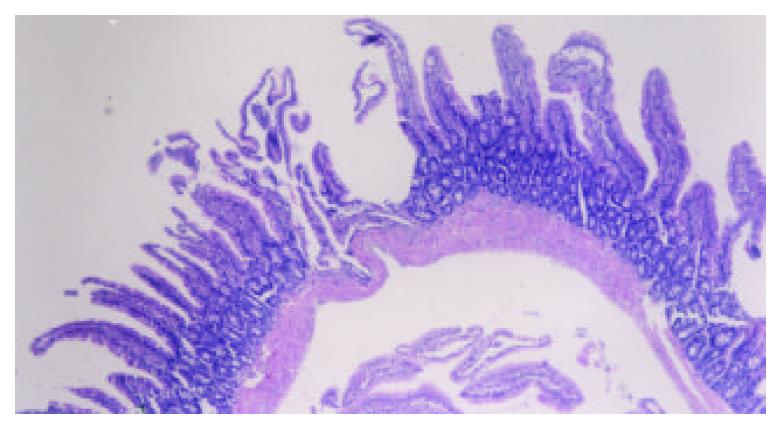
Figure 2 Markedly altered villous morphology and decreased height at 72 hours following TBI.
Note the focal mucosa ulcer with exposure of submucosal interstitium and disarrangement of villi. H-E, magnification ×100.
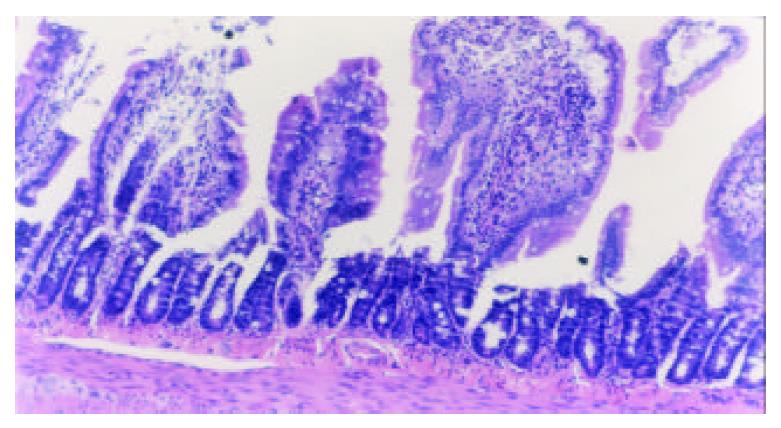
Figure 3 Marked alterations of villous morphology occurred 7 days following TBI, including mucosal atrophy, fusion of adjacent villi, inflammatory cell infiltration, and vascular dilation, congestion and edema in the villous interstitium and lamina propria.
H-E, magnification × 100.
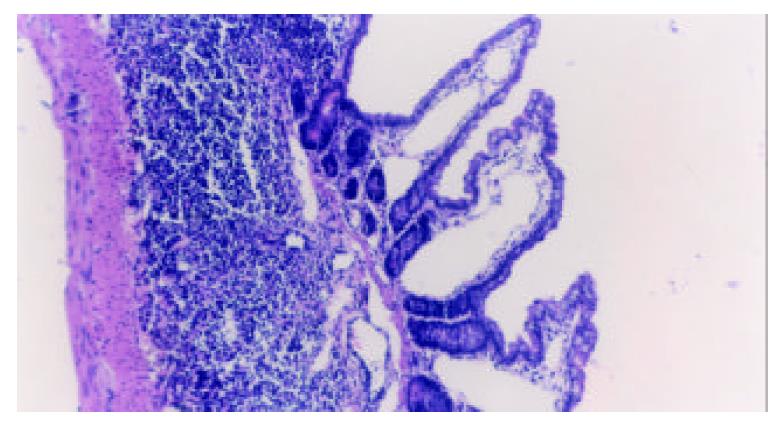
Figure 4 Dilation of central chyle duct of jejunal mucosa.
H-E, magnification × 100.
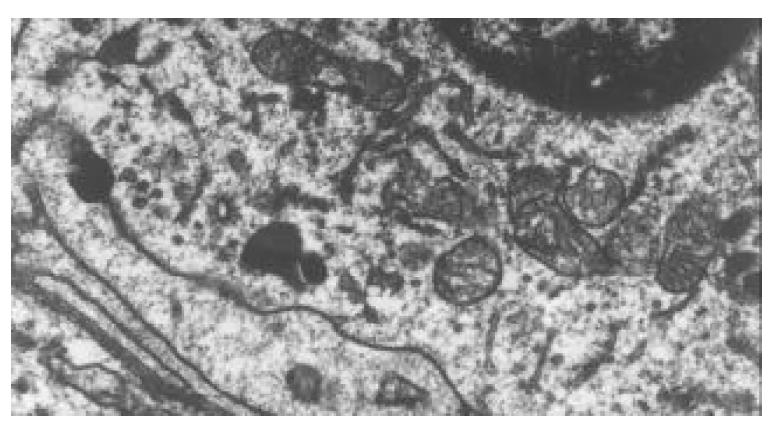
Figure 5 Reduction of mitochondrial matrix and disruption of its cristae at 72 hours following TBI.
TEM, magnification ×15 k.
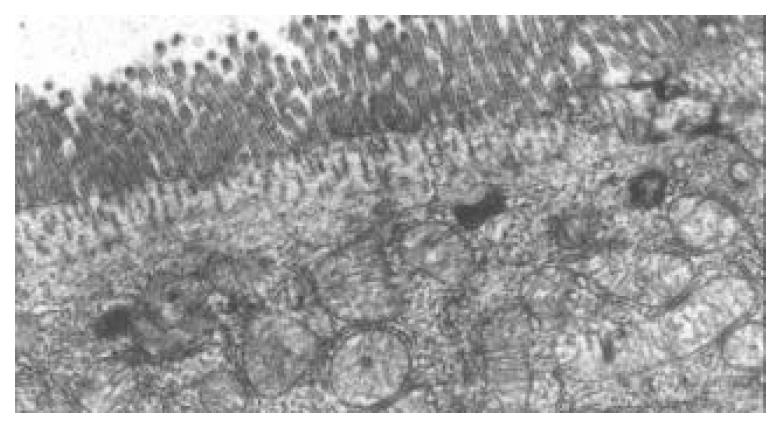
Figure 6 Ruptured, distorted and sparse microvilli at 24 hours following TBI.
TEM, magnification ×10 k.
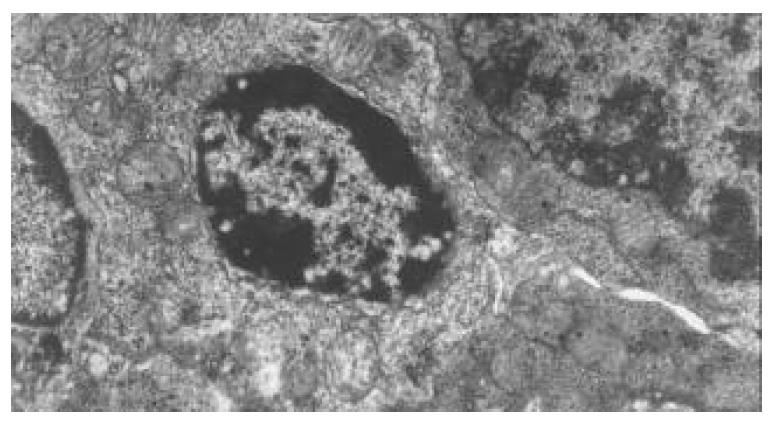
Figure 7 Apoptosis bodies in epithelial cytoplasms of jejunum following TBI.
TEM, magnification ×8000.
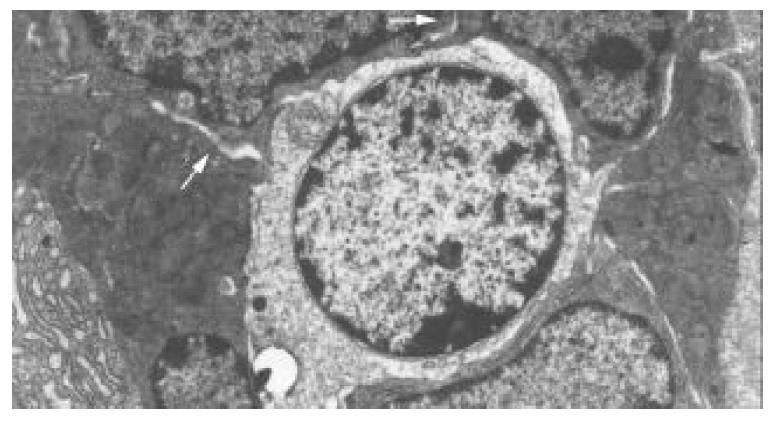
Figure 8 Disrupted and wider tight junction between epithe-lial cells at 72 hours and 7 days following TBI, shown as blank arrow.
TEM, magnification ×5000.
Figure 9 Significant increase of level of plasma endotoxin following TBI compared with control.
Two peaks of plasma endotoxin existed at 3 h and 72 h postinjury, respectively. aP < 0.05 vs control; cP < 0.05 vs 12 h, 24 h and 72 h following TBI, eP < 0.05 vs 3 h following TBI. Mean ± SD of six animals, control: 183.7 ± 41.8 EU/L, 3 h: 434.8 ± 54.9 EU/L, 12 h: 324.2 ± 61.7 EU/L, 24 h: 303.3 ± 60.2 EU/L, 72 h: 560.5 ± 76.2 EU/L, 7 d: 306.7 ± 62.4 EU/L.
Figure 10 Significant increase of L/M ratio at 12 h, 24 h and 72 h following TBI compared with control and significant decline on day 7 compared with group at 72 h.
The L/M ratio on day 7 was still significantly higher than that at 12 h and 24 h. bP < 0.01 vs control, dP < 0.01 vs 12 h and 24 h, eP < 0.01 vs 7 d. Mean ± SD of six animals, control: 0.0172 ± 0.0009, 12 h: 0.0303 ± 0.0013, 24 h: 0.0354 ± 0.0025,72 h: 0.0736 ± 0.0105, 7 d: 0.0588 ± 0.0083.
- Citation: Hang CH, Shi JX, Li JS, Wu W, Yin HX. Alterations of intestinal mucosa structure and barrier function following traumatic brain injury in rats. World J Gastroenterol 2003; 9(12): 2776-2781
- URL: https://www.wjgnet.com/1007-9327/full/v9/i12/2776.htm
- DOI: https://dx.doi.org/10.3748/wjg.v9.i12.2776


