Copyright
©The Author(s) 2003.
World J Gastroenterol. Nov 15, 2003; 9(11): 2612-2615
Published online Nov 15, 2003. doi: 10.3748/wjg.v9.i11.2612
Published online Nov 15, 2003. doi: 10.3748/wjg.v9.i11.2612
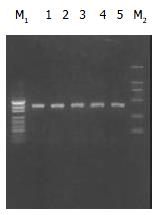
Figure 1 Electrophoregram of PCR products (Lanes 1-5).
The signals of pUC19-DNA marker (M1) present 489 bp, 404 bp, 331 bp, 242 bp, 190 bp, 147 bp and 110 bp from up to bottom. The signals of DL2000-DNA marker (M2) present 2000 bp, 1000 bp, 750 bp, 500 bp, 250 bp and 100 bp from up to bottom.
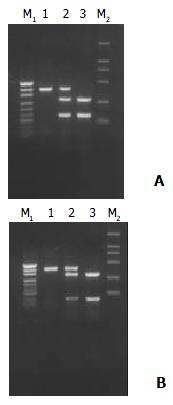
Figure 2 After digested with restriction enzyme PstI (A) or RsaI (B), CYPIIE1 was divided into three types, namely wild type homozygote (C1/C1) (Lane 1), heterozygote (C1/C2) (Lane 2) and mutant homozygote (C2/C2) (Lane 3).
C1 means wild type gene (PstI+, RsaI-), and C2 mutant gene (PstI-, RsaI+). pUC19-DNA marker (M1) and DL2000-DNA marker (M2).
- Citation: Piao YF, Li JT, Shi Y. Relationship between genetic polymorphism of cytochrome P450IIE1 and fatty liver. World J Gastroenterol 2003; 9(11): 2612-2615
- URL: https://www.wjgnet.com/1007-9327/full/v9/i11/2612.htm
- DOI: https://dx.doi.org/10.3748/wjg.v9.i11.2612


