Copyright
©The Author(s) 2003.
World J Gastroenterol. Nov 15, 2003; 9(11): 2433-2440
Published online Nov 15, 2003. doi: 10.3748/wjg.v9.i11.2433
Published online Nov 15, 2003. doi: 10.3748/wjg.v9.i11.2433
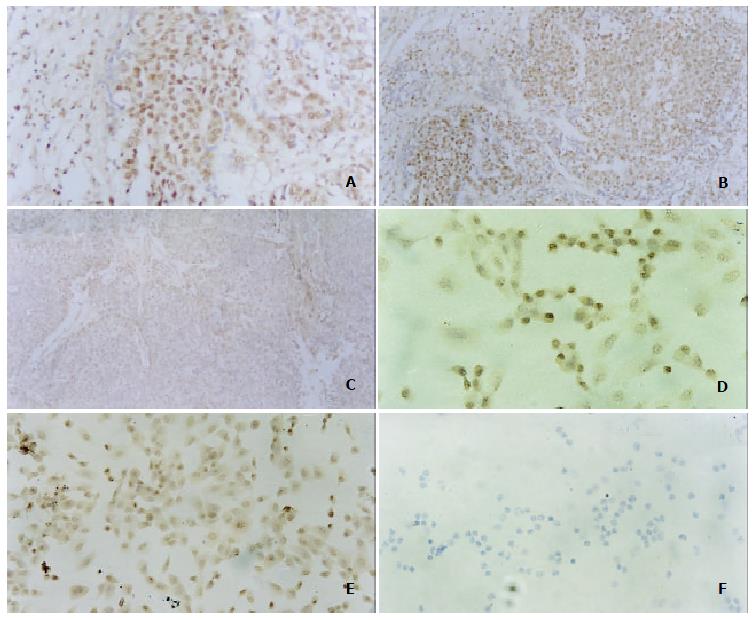
Figure 1 Expression of TRAILR in human HCC tissues and HCC cell lines by in situ hybridization.
Stronger expression of DR5 (A and D) and DR4 (B and E) as well as negative expression of DcR1 C and F) in both human HCC tissues and HCC cell lines. Note that TRAIL-R staining was found mainly in the cytoplasm and membrane.
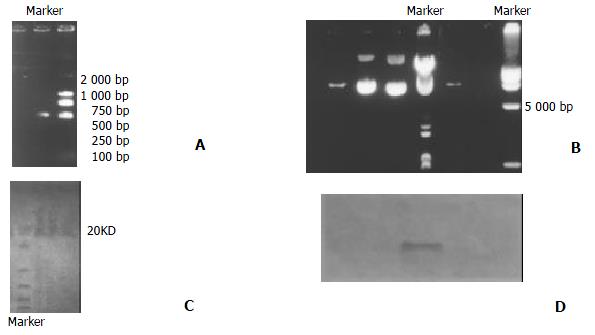
Figure 2 Construction of pIRES-EGFP-TRAIL.
A: the C-terminus extracellular region of 114-281 amino acid (aa) was amplified by PCR, including EcoRV/EcoR I at two end, 523 bp; B: TRAIL expression plasmids pIRES-EGFP-TRAIL; C: The cellular proteins were separated by SDS-PAGE; D: Western blot identified expression of TRAIL, negative expression of TRAIL in control.
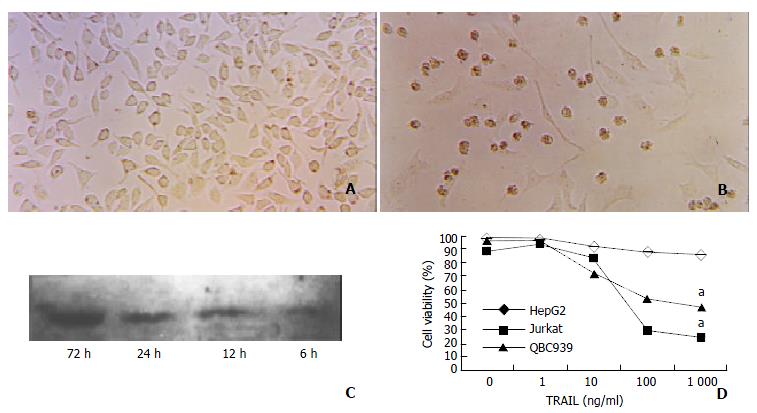
Figure 3 Determination of the percentage of cell viability by in vitro administration of recombinant TRAIL.
A: Normal HepG2 shapes; B: HepG2 shaped treatment with TRAIL (100 ng/mL, 24 h); C: Western blot analyzed expression of TRAIL protein transfected with pIRES-EGFP-TRAIL (6 h, 12 h, 24 h 72 h). D:Survival of tumor cells treatment with TRAIL, detected by MTT. Each value represents the mean of the three wells. For clarity, SD bars are omitted from the graph, but are less than 5% for all data points. Experiments were performed at least three separate times with similar results. a: Compared with hepG2, statistical significant (P < 0.05). The results similar to HepG2 were obtained in SMMC-7721.
Figure 4 Transfection of pIRES-EGFP-TRAIL in vitro and in vivo.
A: Transfected efficiency observed with fluorescence microscope (in vitro); B: The expression of TRAIL gene in nude mice tumor was all relatively strong (in vivo). (1), the expression of TRAIL gene in tissue near the tumor was weak (2) and that in normal liver tissue was negative after transfection of TRAIL gene (3); C: TRAIL protein production was determined by Western blot analysis. (a) Nude mice HCC tissue, (b) Adjacent tissue and (c) Normal tissue.
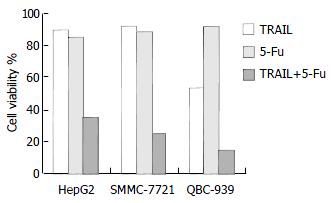
Figure 5 Cell viability of tumor cells incubated with TRAIL in combination with 5-FU.
Cell viability is shown as the percentage of viable cells relative to control cell after 24 h of incubation with TRAIL (50 ng/mL), 5-FU (0.025 mg/mL) or both. SD bars are less than 5% for all data points and omitted.
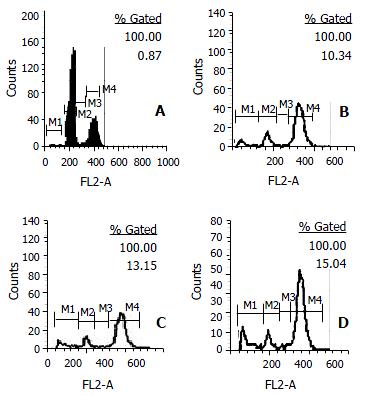
Figure 6 Apoptosis of HepG2 after treatment with TRAIL.
A: HepG2 without treatment. B, C, D: HepG2 treatment with TRAIL for 24 h (B, 10 ng/mL. C, 100 ng/mL. D, 1000 ng/mL). Compared to A P < 0.05.
- Citation: Chen XP, He SQ, Wang HP, Zhao YZ, Zhang WG. Expression of TNF-related apoptosis-inducing Ligand receptors and antitumor tumor effects of TNF-related apoptosis-inducing Ligand in human hepatocellular carcinoma. World J Gastroenterol 2003; 9(11): 2433-2440
- URL: https://www.wjgnet.com/1007-9327/full/v9/i11/2433.htm
- DOI: https://dx.doi.org/10.3748/wjg.v9.i11.2433


