Copyright
©The Author(s) 2002.
World J Gastroenterol. Oct 15, 2002; 8(5): 918-922
Published online Oct 15, 2002. doi: 10.3748/wjg.v8.i5.918
Published online Oct 15, 2002. doi: 10.3748/wjg.v8.i5.918
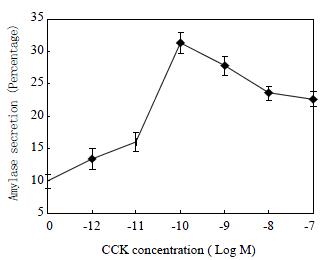
Figure 1 Concentration dependence of cholecystokinin (CCK)-stimulated amylase secretion.
Note that maximum secretion was achieved at 100 pM of CCK. n = 6
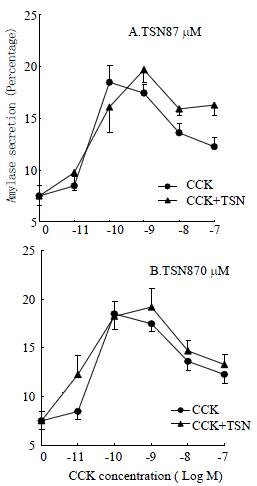
Figure 2 Effect of toosendanin (TSN) on CCK-stimulated amylase secretion.
TSN was added to the pancreatic acini 10 min before stimulation with CCK which was maintained for another 30 min. A. TSN 87 μM, n = 6. B. TSN 870 μM, n = 4. Note that, for clarity, the same CCK dose-response curve (n = 6) was drawn both in A and B.
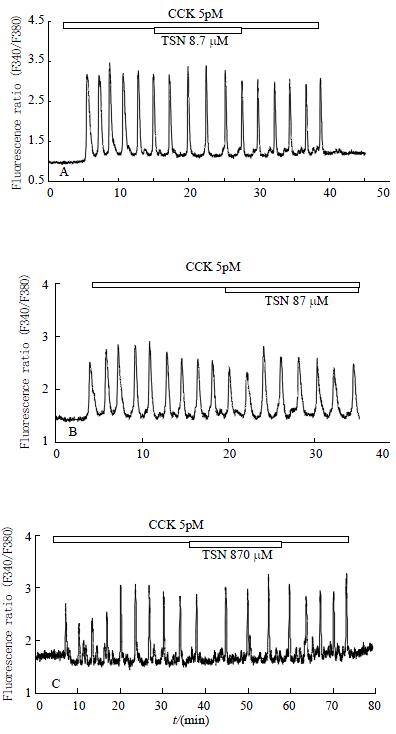
Figure 3 Effect of toosendanin on 5 pM CCK-induced calcium oscillations.
CCK and TSN were added as indicated by the horizontal bars. A. TSN 8.7 μM, n = 4. B. TSN 87 μM, n = 7. C. TSN 870 μM, n = 8.
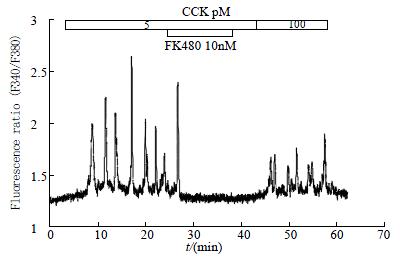
Figure 4 Effect of FK480 on CCK-induced calcium oscillations.
5 pM of CCK and 10 nM of FK480 were added as indicated by the horizontal bars. n = 5.
- Citation: Cui ZJ, He XH. The pre-synaptic blocker toosendanin does not inhibit secretion in exocrine cells. World J Gastroenterol 2002; 8(5): 918-922
- URL: https://www.wjgnet.com/1007-9327/full/v8/i5/918.htm
- DOI: https://dx.doi.org/10.3748/wjg.v8.i5.918


