Copyright
©The Author(s) 2002.
World J Gastroenterol. Oct 15, 2002; 8(5): 901-907
Published online Oct 15, 2002. doi: 10.3748/wjg.v8.i5.901
Published online Oct 15, 2002. doi: 10.3748/wjg.v8.i5.901
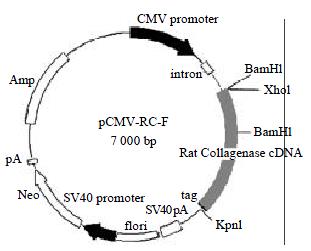
Figure 1 Map of plasmid pCMV-RC-F.
The FLAG tagged full length rat collagenase cDNA was inserted into a mammalian expression pasmid vector PtargeTM which carries the human cytomegalovirus (CMV) immediate-early enhancer/promoter region.
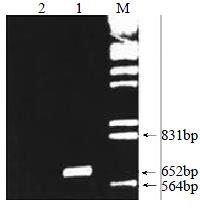
Figure 2 RT-PCR assay of the mRNA expression of recombinant collagenase in NIH 3T3 cells.
The PCR-amplified 652 bp fragment of recombinant collagenase cDNA derived from their respective mRNA was found in NIH 3T3 cells which were transfected with pCMV-RC-F (lane 1), while no signal was detected in cells which transfected with control plasmid pTargeTM (lane 2). Lane M is the molecular weight marker (DNA/Hind III, BamH I).
Figure 3 Westernblot analysis of the FLAG-tagged rat collagenase expression using mouse anti-FLAG M2 McAb.
The immunoreactive band with anti-FLAG M2 McAb at about Mr 55000 was observed in the culture supernatant of cells transfected with PCMV-RC-F (lane 1) and the supernatant of 1:2 dilution (lane 2). No immunoreactive was found in the supernatant of cells transfected with pTargeTM (lane 3, 4) or in culture medium alone (lane 5, 6).
Figure 4 Gelatin zymography analysis for the activity of collagenase.
The enhanced gelatin degradation activity was found in the culture supernatant of pcmv-RC-F transfected cells (lane 1-7 represent the zymograph of 1:1, 1:2, 1:4, 1:8, 1:16, 1:32, 1:64 diluted solutions of the supernatant) when compared with pTargeTM transfected cells (lane 10, 11 represent the zymograph of 1:2 and 1:1 diluted solutions of the surpernatant). No activity was found at about Mr 55000 in the culture medium (lane 8, 9).
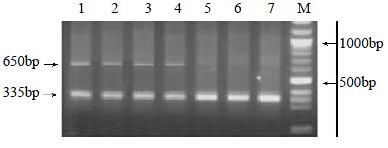
Figure 5 RT-PCR assay for the expression of recombinant interstitial collagenase in rat livers.
The 652 bp PCR amplified fragment of recombinant collagenase cDNA which was derived from their respective mRNA could be detected in liver samples from pCMV-RIC-F plasmid transduced rat groups C1 (lane 1, 2) and C2 (lane 3, 4) but not in the normal control group A (lane 5, 6) and disease control group B (lane 7). 335 bp fragment was PCR amplified β-actin cDNA. Lane M was 100 bp-1200 bp DNA marker ladders.
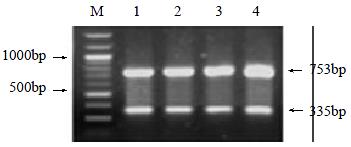
Figure 6 RT-PCR assay for the endogenous expression of collagenase in rat livers.
The 753 bp PCR-amplified fragment of endogenous collagenase cDNA which was derived from their respective mRNA could be detected in all liver samples from the normal control groups A (lane 1) and disease control group B (lane 4), as well as pCMV-RIC-F plasmid transduced rat groups C1 (lane 3) and C2 (lane 4).335 bp fragment was PCR amplified β-actin cDNA. Lane M was 100 bp-1200 bp DNA marker ladders.
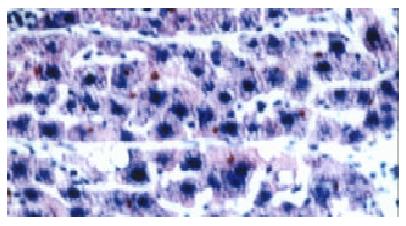
Figure 7 Immunohistochemical analysis of the expression of recombinant plasmid with anti-FLAG antibody in pCMV-RIC-F plasmid transduced group C1 (× 400).
Nearly about 30 percent of total cells presented positive signals. The distributions of positive signals were found in both the hepatocytes and the perisinusoidal cells.
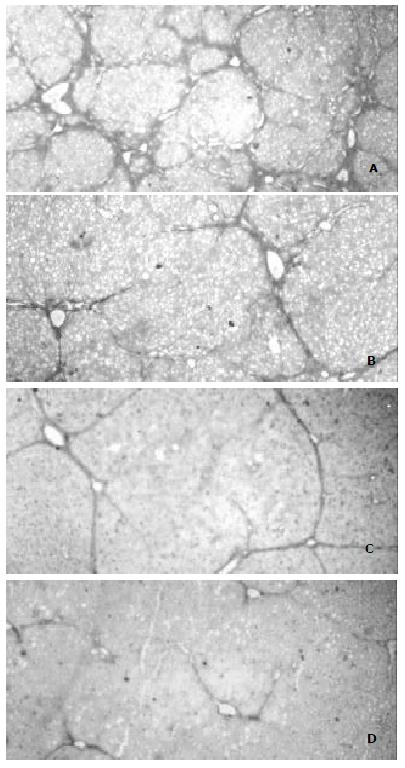
Figure 8 Immunohistochemical analysis of collagen types I (A, B) and III (C, D) in livers (× 100).
The accumulations of collagen in the disease control group (A, C) were more severe than that in the pCMV-RIC-F plasmid transduced C1 group (B, D).
-
Citation: Wang JY, Guo JS, Yang CQ. Expression of exogenous rat collagenase
in vitro and in a rat model of liver fibrosis. World J Gastroenterol 2002; 8(5): 901-907 - URL: https://www.wjgnet.com/1007-9327/full/v8/i5/901.htm
- DOI: https://dx.doi.org/10.3748/wjg.v8.i5.901


