Copyright
©The Author(s) 2002.
World J Gastroenterol. Oct 15, 2002; 8(5): 827-831
Published online Oct 15, 2002. doi: 10.3748/wjg.v8.i5.827
Published online Oct 15, 2002. doi: 10.3748/wjg.v8.i5.827
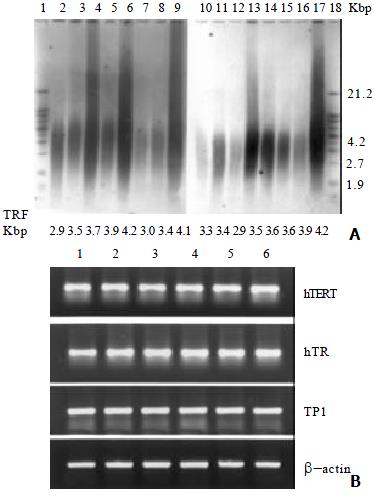
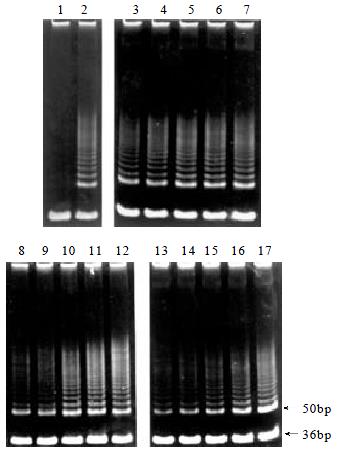
Figure 1 Telomerase inhibition by DOX in BEL-7404 human hepatoma cells.
(A) Inhibition of telomerase activity by DOX in a dose and time-dependent manner in BEL-7404 human hepatoma cells•Lane 1, negative control; Lane 2, cell control; Lane 3', telomerase activity in presence of DOX for 24 h (2.5, 1.25, 0.625, 0.313 and 0.156 μM); Lane 8-12, telomerase activity in presence of DOX for 48 h (2.5, 1.25, 0.625, 0.313 and 0.156 μM); Lane 13-17, telomerase activity in presence of DOX for 72 h (2.5, 1.25, 0.625, 0.313 and 0.156 μM). All experiments were repeated at least twice and representative results were shown here. (B) RT-PCR analysis of hTERT, hTR and TP1 mRNA expression with DOX treatment for 72 h in a concentration range from 0.156 to 2.5 μM. Lane 1, cell control; Lane 2, 2.5 μM; Lane 3, 1.25 μM; Lane 4, 0.625 μM; Lane 5, 0.313 μM; Lane 6, 0.156 μM. β-actin was used as standard. Amplified sequences for hTERT, hTR, TP1 and β-actin are 146, 126, 264 and 539 bp, respectively.
Figure 2 Shortening of mean telomere length (terminal restriction fragments, TRF) in DOX treated BEL-7404 human hepatoma cells.
Lane 1 and 18, molecular marker; Lane 17, cell control; Lane 2-6, DOX treated for 72 h (2.5, 1.25, 0.625, 0.313 and 0.156 μM); Lane 7-11: DOX treated for 48 h (2.5, 1.25, 0.625, 0.313 and 0.156 μM); Lane 12-16: DOX treated for 24 h (2.5, 1.25, 0.625, 0.313 and 0.156 μM).
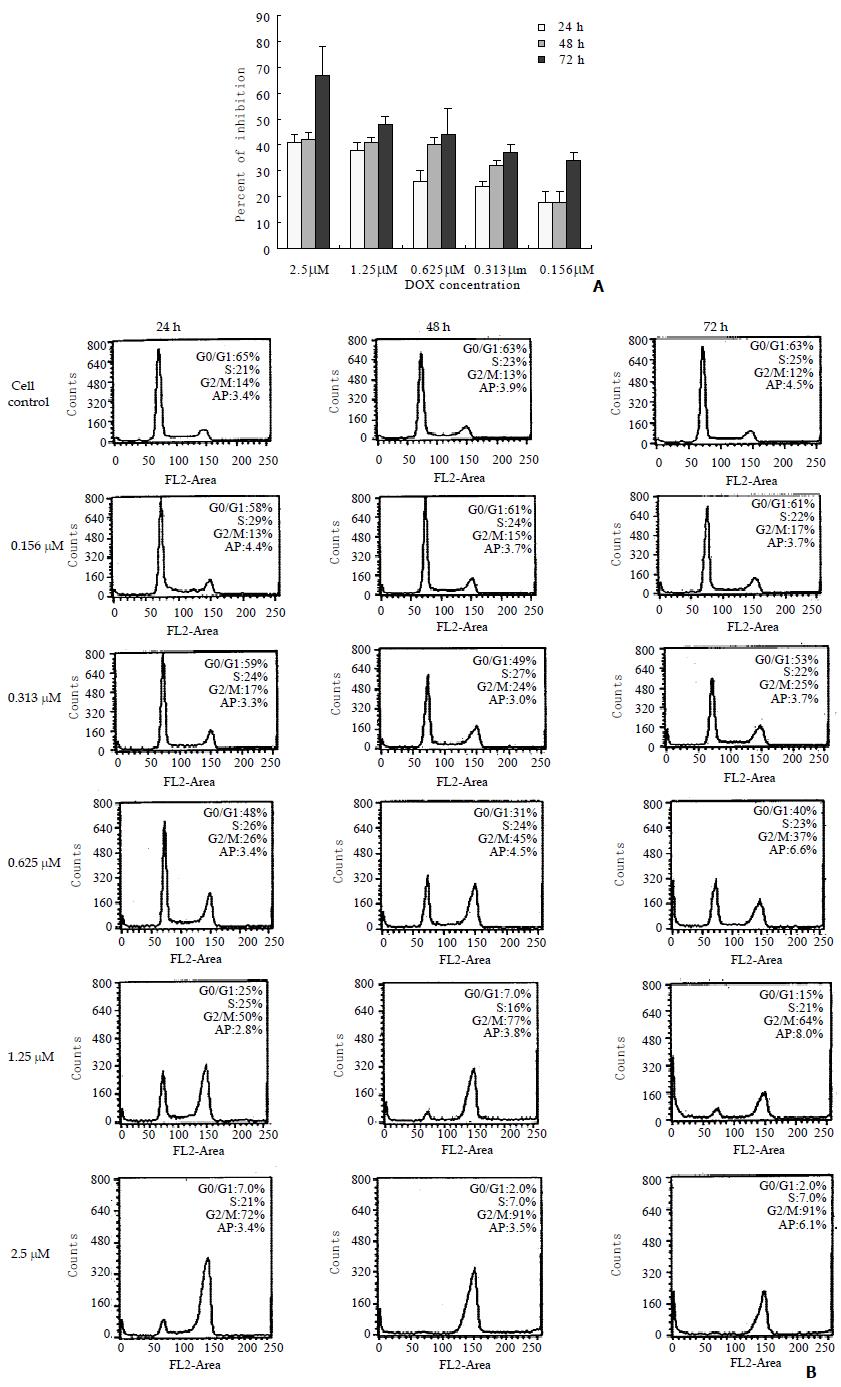
Figure 3 Effects of DOX on cell growth, cell cycle and cell apoptosis in BEL-7404 human hepatoma cells.
(A) Growth inhibition of BEL-7404 human hepatoma cells treated with DOX. Each value represents mean ± SD from triplicate wells. (B) Cell cycle distribution and apoptosis in DOX treated BEL-7404 human hepatoma cells, analyzed by flow cytometry. Cell cycle was arrested at G2/M with the treatment of DOX. Histograms of DNA contents of untreated cell control and treated with 0.156, 0.313, 0.625, 1.25 and 2.5 μM were shown. Cells were maintained in the presence of DOX for 24, 48, and 72 h without a change in medium and collected at the times indicated. AP means the percent of apoptosis.
- Citation: Zhang RG, Guo LX, Wang XW, Xie H. Telomerase inhibition and telomere loss in BEL-7404 human hepatoma cells treated with doxorubicin. World J Gastroenterol 2002; 8(5): 827-831
- URL: https://www.wjgnet.com/1007-9327/full/v8/i5/827.htm
- DOI: https://dx.doi.org/10.3748/wjg.v8.i5.827


