Copyright
©The Author(s) 2002.
World J Gastroenterol. Oct 15, 2002; 8(5): 804-807
Published online Oct 15, 2002. doi: 10.3748/wjg.v8.i5.804
Published online Oct 15, 2002. doi: 10.3748/wjg.v8.i5.804
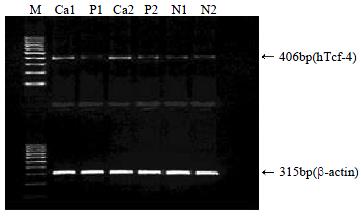
Figure 1 Expression of hTcf-4 and β-actin mRNA in HCC (Ca), para-cancerous tissue (P) and normal liver (N).
Semiquantitative RT-PCR analysis revealed that the expression level of hTcf-4 gene in HCC was much higher than that in para-cancerous tissues and normal livers. M: 100 bp DNA Ladder
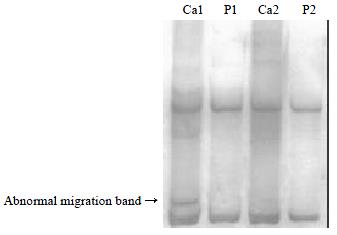
Figure 2 SSCP analysis of hTcf-4 exon 15 in HCC (Ca) and para-cancerous liver (P).
Lane 1, abnormal SSCP pattern detected in exon 15 of patient 1, compared with the pattern of exon 15 from the corresponding para-cancerous liver in lane 2. Lane 3, normal SSCP pattern of exon 15 from patient 2, compared with the pattern of exon 15 from the corresponding para-cancerous liver in lane 4.
- Citation: Jiang Y, Zhou XD, Liu YK, Wu X, Huang XW. Association of hTcf-4 gene expression and mutation with clinicopathological characteristics of hepatocellular carcinoma. World J Gastroenterol 2002; 8(5): 804-807
- URL: https://www.wjgnet.com/1007-9327/full/v8/i5/804.htm
- DOI: https://dx.doi.org/10.3748/wjg.v8.i5.804


