Copyright
©The Author(s) 2002.
World J Gastroenterol. Oct 15, 2002; 8(5): 777-781
Published online Oct 15, 2002. doi: 10.3748/wjg.v8.i5.777
Published online Oct 15, 2002. doi: 10.3748/wjg.v8.i5.777
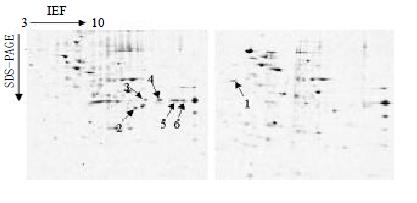
Figure 1 The differentially expressed protein spots observed in SHEE (left) and SHEEC (right) two-dimensional gels samples.
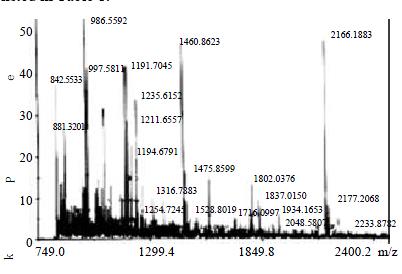
Figure 2 The MALDI-TOF mass spectrum map of protein spot 1.
Mode of operation: Reflector Extraction mode: delayed Accelerating voltage: 20000 V. Acquisition mass range: 750-3500 Da Number of laser shots: 150/spectrum Laser intensity: 2233
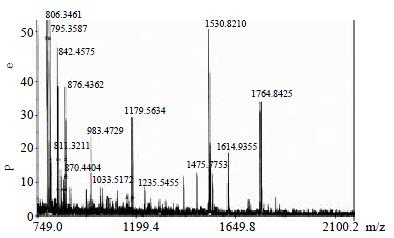
Figure 3 The MALDI-TOF mass spectrum map of protein spot 6.
Mode of operation: Reflector Extraction mode: delayed Accelerating voltage: 20000 V. Acquisition mass range: 750-3000 Da Number of laser shots: 200/spectrum Laser intensity: 2224
- Citation: Xiong XD, Xu LY, Shen ZY, Cai WJ, Luo JM, Han YL, Li EM. Identification of differentially expressed proteins between human esophageal immortalized and carcinomatous cell lines by two-dimensional electrophoresis and MALDI-TOF-mass spectrometry. World J Gastroenterol 2002; 8(5): 777-781
- URL: https://www.wjgnet.com/1007-9327/full/v8/i5/777.htm
- DOI: https://dx.doi.org/10.3748/wjg.v8.i5.777


