Copyright
©The Author(s) 2002.
World J Gastroenterol. Aug 15, 2002; 8(4): 739-745
Published online Aug 15, 2002. doi: 10.3748/wjg.v8.i4.739
Published online Aug 15, 2002. doi: 10.3748/wjg.v8.i4.739
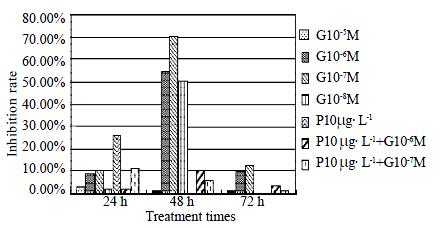
Figure 1 Genistein inhibited the basal and PDGF-BB induced proliferation of HSCs.
Cell proliferation was measured by MTT incorporation.
Figure 2 Flow cytometric analysis of cell cycle of HSC.
(A) Control HSC; (B) HSCs stimulated with 10 μg·L-1 PDGF-BB for 15 min; (C) HSC treated with 10-7 mol/L genistein for 48 h; (D) HSC stimulated with 10 μg·L-1 PDGF-BB for 15 min and then incubated with 10-7 mol/L genistein for 48 h.
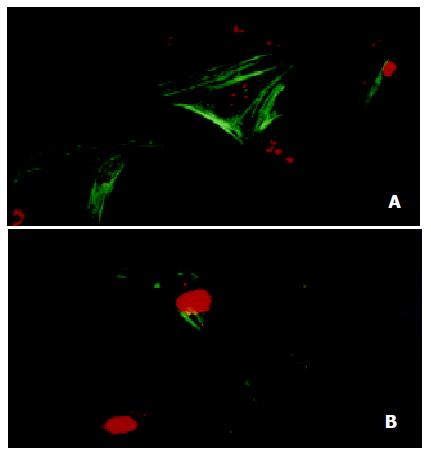
Figure 3 Immunoflurescence detection of α-SMA in HSC by confocal laser microscopy (× 600).
(A) Strong staining was observed in control HSC; (B) only a few cells were stained when HSC treated with 10-7 mol/L genistein for 48 h.
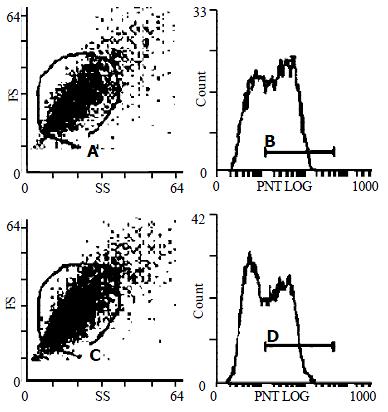
Figure 4 Flow cytometric analysis of α-SMA in HSC.
(A, B) control HSC (C, D) HSC treated with 10-7 mol/L genistein for 48 h. Showed significant decreased fluorescence intensity (P < 0.05).
Figure 5 Immunoflurescence detection of the expression of tyrosine phosphorylation in HSC by confocal laser microscopy (× 200).
(A) HSC stimulated with 10 μg·L-1 PDGF-BB for 15 min showed a strong staining for phosphoyrosine containing protein; (B) HSCs stimulated with 10 μg·L-1 PDGF-BB for 15 min and then incubated with 10-7 mol/L genistein for 48 h showed significant decreased fluorescence intensity for phosphoyrosine containing protein.
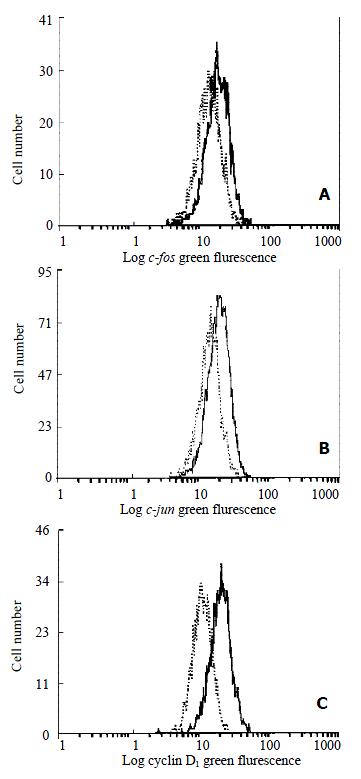
Figure 6 Flow cytometric analysis of c-fos (A), c-jun (B) and cyclin D1 (C) expression in HSC.
-indicated the control HSC and -indicated HSC treated with 10-7 mol/L genistein for 48 h.
- Citation: Liu XJ, Yang L, Mao YQ, Wang Q, Huang MH, Wang YP, Wu HB. Effects of the tyrosine protein kinase inhibitor genistein on the proliferation, activation of cultured rat hepatic stellate cells. World J Gastroenterol 2002; 8(4): 739-745
- URL: https://www.wjgnet.com/1007-9327/full/v8/i4/739.htm
- DOI: https://dx.doi.org/10.3748/wjg.v8.i4.739


