Copyright
©The Author(s) 2002.
World J Gastroenterol. Aug 15, 2002; 8(4): 734-738
Published online Aug 15, 2002. doi: 10.3748/wjg.v8.i4.734
Published online Aug 15, 2002. doi: 10.3748/wjg.v8.i4.734
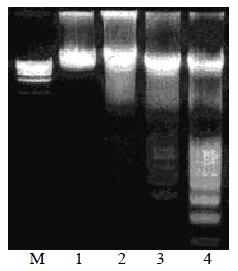
Figure 1 Oligonucleosomal genomic DNA fragmentation.
Lane M: DNA marker of PBR322; Lane 1: Control HSCs; Lane 2, 3, 4: HSC treated with anti-FAK antibodies for 24, 48 or 72 h.
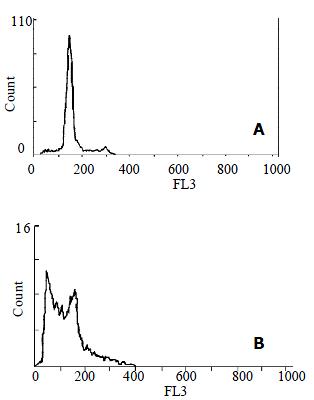
Figure 2 Flow cytometric analysis of HSCs.
A: Control HSC; B: HSC treated with anti-FAK antibodies for 72 h showed the presence of a hypodiploid (sub-G1) fraction, indicating DNA degradation.
Figure 3 Electrophoresis analysis of RT-PCR product.
Lane M: 100 bp DNA ladder; Lane 1, 2: amplified from cDNA from the control HSCs; Lane 3, 4: amplified from cDNA from HSCs treated with anti-FAK antibodies for 72 h. The positive bands of 452 bp and 216 bp represented GAPDH and TIMP-1 respectively. Lane 4 showed decreased expression of TIMP-1 in HSC compared with lane 2.
- Citation: Liu XJ, Yang L, Wu HB, Qiang O, Huang MH, Wang YP. Apoptosis of rat hepatic stellate cells induced by anti-focal adhesion kinase antibody. World J Gastroenterol 2002; 8(4): 734-738
- URL: https://www.wjgnet.com/1007-9327/full/v8/i4/734.htm
- DOI: https://dx.doi.org/10.3748/wjg.v8.i4.734


