Copyright
©The Author(s) 2002.
World J Gastroenterol. Aug 15, 2002; 8(4): 644-649
Published online Aug 15, 2002. doi: 10.3748/wjg.v8.i4.644
Published online Aug 15, 2002. doi: 10.3748/wjg.v8.i4.644
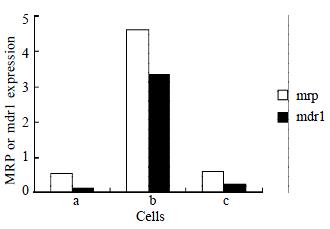
Figure 1 Quantification of PCR.
The ratio between the mdr1 or mrp and β2M gene is expressed as described in MATERIALS AND METHODS. (a. parental cell-SMMC7721/S; b. SMMC7721/R; c. SMMC7721/R incubated with 0.5 μmol/L AS-ODN for 24 h)
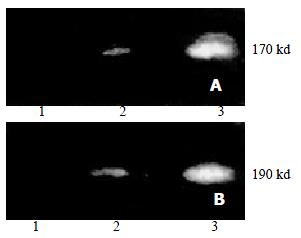
Figure 2 Expression of P-gp and P190 analyzed with Wstern blot.
(a) immunoblotted with anit-P-gp antibody; (b) immunoblotted with anti-P190 antibody. 1. parental cell-SMMC7721/S; 2. SMMC7721/R treated by AS-ODN (0.5 μmol/L, 72 h); 3. SMMC7721/R.
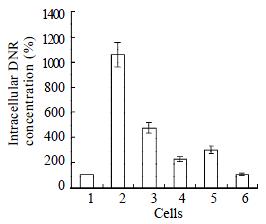
Figure 3 Intracellular DNR concentrations in cells treated with antisense oligonucleotids.
The concentration of each AS-ODN is 0.5 mmol/L and the treatment time is 72 h. Data are the mean ± standard deviation of three independent experiments. (1. SMMC7721/R; 2. SMMC7721/S; 3. SMMC7721/R treated with AS-ODN/mdr1+mrp; 4. SMMC7721/R treated with AS-ODN/mdr1; 5. SMMC7721/R treated by AS-ODN/mrp; 6. SMMC7721/R treated with AS-ODN/nonsense.)
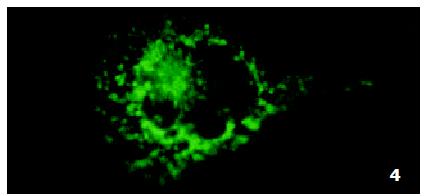
Figure 4 Intracellular DNR distribution in parental sensitive cells SMMC7721/S.
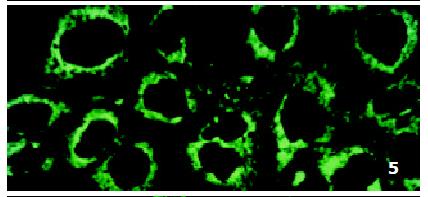
Figure 5 Intracellular DNR distribution in drug-resistant cells SMMC7721/R.
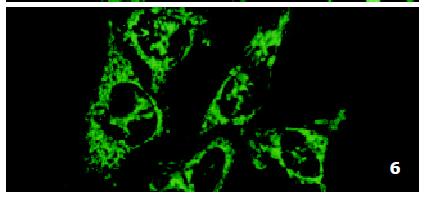
Figure 6 Intracellular DNR distribution in drug-resistant cells SMMC7721/R pre-treated with AS-ODN/mdr1 (0.
5 μmol/L) for 72 h.
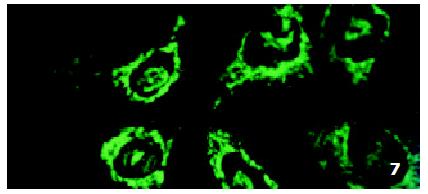
Figure 7 Intracellular DNR distribution in drug-resistant cells SMMC7721/R treated with AS-ODN/mrp (0.
5 μmol/L) for 72 h.
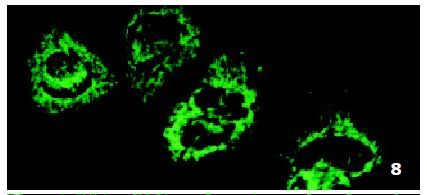
Figure 8 Intracellular DNR distribution in drug-resistant cells SMMC7721/R pre-treated with AS-ODN/mdr1 and AS-ODN/mrp.
Each AS-ODN concentration is 0.5 μmol/L and the treatment time is 72 h.
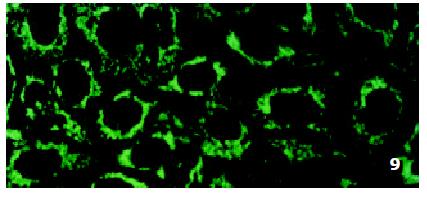
Figure 9 Intracellular DNR distribution in drug-resistant cells SMMC7721/R treated with nonsense oligonucleotides (0.
5 μmol/L) for 72 h.
- Citation: Yang JY, Luo HY, Lin QY, Liu ZM, Yan LN, Lin P, Zhang J, Lei S. Subcellular daunorubicin distribution and its relation to multidrug resistance phenotype in drug-resistant cell line SMMC-7721/R. World J Gastroenterol 2002; 8(4): 644-649
- URL: https://www.wjgnet.com/1007-9327/full/v8/i4/644.htm
- DOI: https://dx.doi.org/10.3748/wjg.v8.i4.644


