Copyright
©The Author(s) 2002.
World J Gastroenterol. Aug 15, 2002; 8(4): 631-637
Published online Aug 15, 2002. doi: 10.3748/wjg.v8.i4.631
Published online Aug 15, 2002. doi: 10.3748/wjg.v8.i4.631
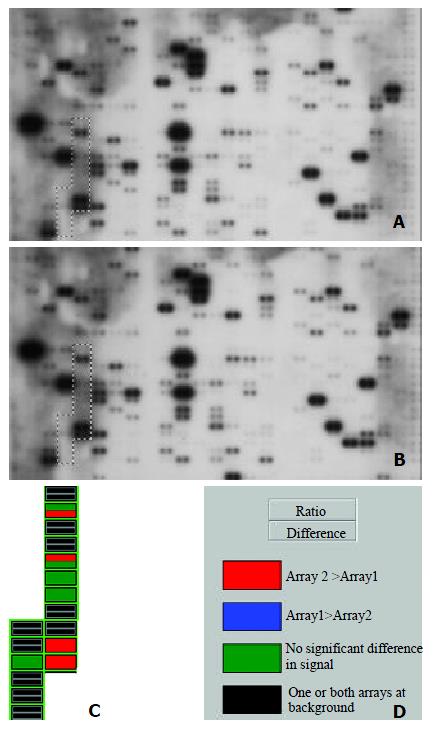
Figure 1 Parallel analysis of intergrin gene expression in human hepatocellular carcinoma and adjacent normal liver tissues.
Atlas human cancer cDNA expression array (Clontech, USA) is hybridized with 32P-labeled cDNA probes obtained by RT-PCR from total RNA of human hepatocellular carcinoma (A) and adjacent normal liver tissues (B). The intergrin gene region is marked in the photo. The colorful comparative diagram between human hepatocellular carcinoma and adjacent normal liver tissues is obtained when one aligns two arrays to AtlasImage Grid Temples and adjusts the alignments and backgroud calculations (C). Definitions of colors in the array comparison are showed (D).
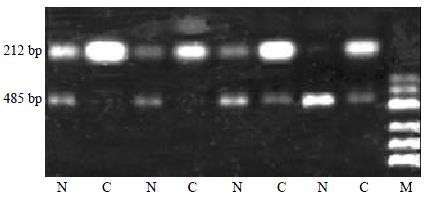
Figure 2 Partial semi-quantitative RT-PCR results for Intergrin beta1 in 24 paired tissues.
A total of 10 μL RT-PCR products are electrophoresed on 2% agarose gel containing ethidium bromide. The level of GAPDH is used as an internal control. (RT-PCR, reverse transcription- polymerase chain reaction; N, adjacent noamal liver tissue; C, human hepatocellular carcinoma tissue; GAPDH, glyceraldehyde-s-phosphate dehydrogenase; M, pUC Mix Maker)
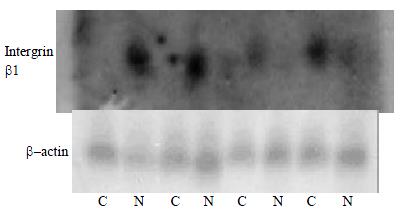
Figure 3 Nothern blot analysis of Intergrin beta1, which differentially express in human hepatocellular carcinoma and adjacent normal liver tissues, to confirm the Atlas human cancer cDNA expression array.
Four paired cases are used to determine these genes expression patterns. Twenty μg RNA is analyzed on a 1.2% denaturing agrose gel and tansfer onto a nylon membrane. 32P-labeled cDNA probes for these genes are hybridized to the RNA-bloted membranes. After stringent washes, membranes are exposed to X-ray film overnight at -70 °C. The same membranes are rehybridized with human β-actin for an RNA loading control. (C, human hepatocellular carcinoma tissue; N, adjacent noamal liver tissue)
- Citation: Liu LX, Jiang HC, Liu ZH, Zhou J, Zhang WH, Zhu AL, Wang XQ, Wu M. Intergrin gene expression profiles of humanhepatocellular carcinoma. World J Gastroenterol 2002; 8(4): 631-637
- URL: https://www.wjgnet.com/1007-9327/full/v8/i4/631.htm
- DOI: https://dx.doi.org/10.3748/wjg.v8.i4.631


