Copyright
©The Author(s) 2002.
World J Gastroenterol. Apr 15, 2002; 8(2): 208-212
Published online Apr 15, 2002. doi: 10.3748/wjg.v8.i2.208
Published online Apr 15, 2002. doi: 10.3748/wjg.v8.i2.208
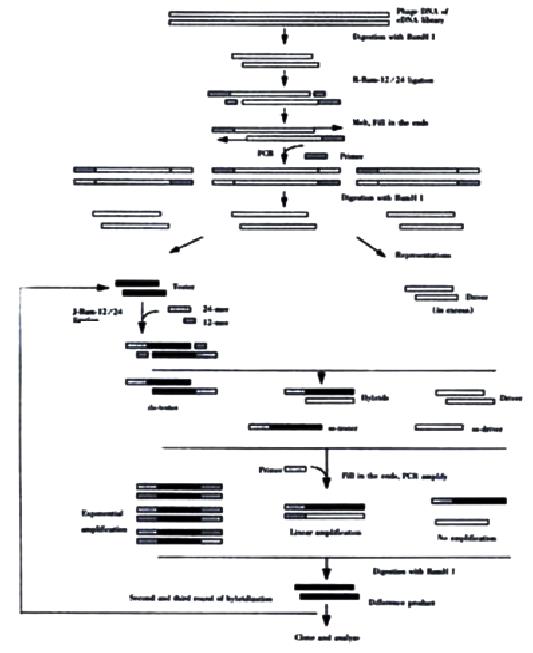
Figure 1 Schematic diagram of cDNA RDA based on cDNA libraries, illustrating the subtractive hybridization and amplification steps following the representation stage and preparation of amplicons.
Gray boxes (24-mer, 12-mer) represent R (or J, N)-Bam adapters
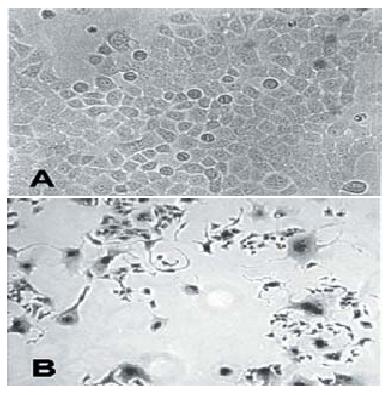
Figure 2 Morphological changes of human gastric cancer cell line BGC823 after Allitridi treatment.
A: The parental cells (used as control); B: Neurite-like structures outgrew from the cell bodies and formed interconnections after exposure to 25 mg•L⁻¹ Allitridi for 96 h (5 × 40).
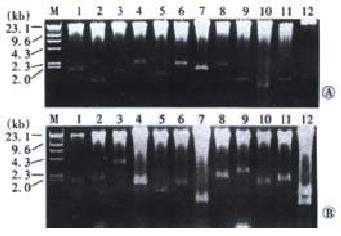
Figure 3 Insert sequences released from randomly selected clones (Lanes 1-12) of parental cell (BGC823) cDNA library (A) and Allitridi-treated cell (Alli823) cDNA library (B) by digestion with EcoR I and Xho I.
λPhage/Hind III size marker was indicated in Lane M.
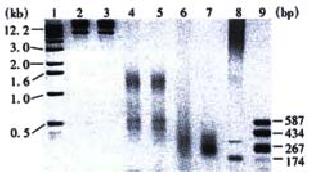
Figure 4 Agarose gel electrophoresis of difference products obtained after the first, second and third round hybridizations.
BamH I-digested library DNA extracted from Alli823 and BGC823 cDNA libraries respectively (Lanes 2, 3); Amplicons of cDNA population prepared from Allitridi-treated and parental groups (used as tester and driver respectively) (Lane 4, 5); First, second and third difference products respectively (Lanes 6, 7, 8); 1 kb size marker (Lane 1) and PUC18/Hae III DNA size marker (Lane 9).
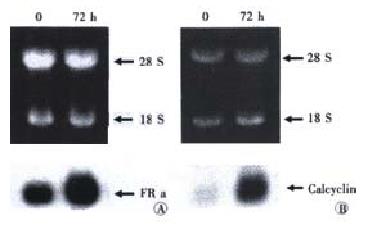
Figure 5 Northern blot analysis of FRαgene and calcyclin gene expression in BGC823 cells.
FRα mRNA (A) and calcyclin mRNA (B) level was elevated after exposure to 25 mg•L⁻¹ Allitridi for 72 h.
- Citation: Li Y, Yang L, Cui JT, Li WM, Guo RF, Lu YY. Construction of cDNA representational difference analysis based on two cDNA libraries and identification of garlic inducible expression genes in human gastric cancer cells. World J Gastroenterol 2002; 8(2): 208-212
- URL: https://www.wjgnet.com/1007-9327/full/v8/i2/208.htm
- DOI: https://dx.doi.org/10.3748/wjg.v8.i2.208


