Copyright
©The Author(s) 2001.
World J Gastroenterol. Oct 15, 2001; 7(5): 726-731
Published online Oct 15, 2001. doi: 10.3748/wjg.v7.i5.726
Published online Oct 15, 2001. doi: 10.3748/wjg.v7.i5.726
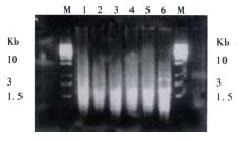
Figure 1 The results of secondary PCR amplification: Lane 1: Subtracted A-N cDNA library; Lane 2: Unsubtracted A cDNA library; Lane 3: Subtracted T-A cDNA library; Lane 4: Unsubtracted T cDNA library; Lane 5: Subtracted T-N cDNA library; Lane 6: Control; A: Subtracted A-N cDNA library; B: Subtracted A-N cDNA library; C: Subtracted A-N cDNA library.
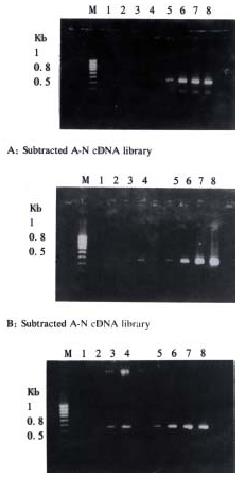
Figure 2 Analysis of subtraction efficiency: Lanes 1-4 were performed on subtracted cDNA libraries, Lanes 5-8 were performed on unsubtracted cDNA libraries.
Cycles for 1&5, 2&6, 3&7 and 4&8 were 18, 23, 28 and 33 respectively.
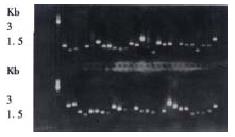
Figure 3 Clone PCR amplification with an average insert size of 0.
2-1 kb.
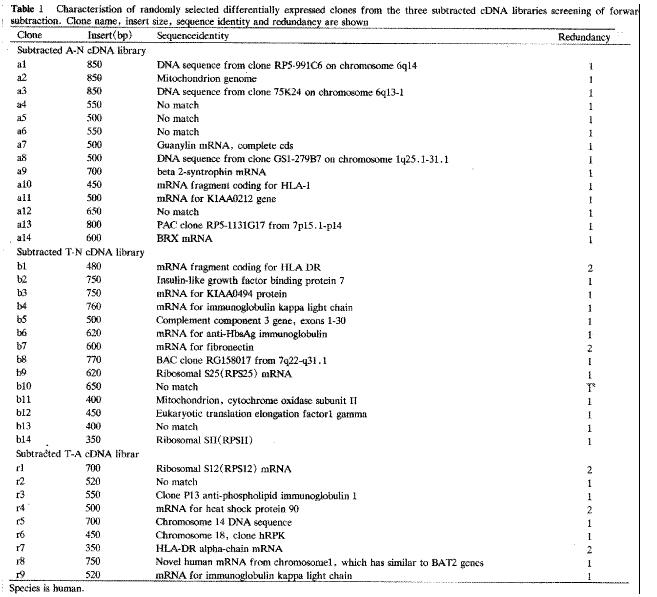
Figure 4 Characteristion of randomly selected differentially expressed clones from the three subtracted cDNA libraries screening of forward subtraction.
Clone name, insert size, sequence identity and redundancy are Shown
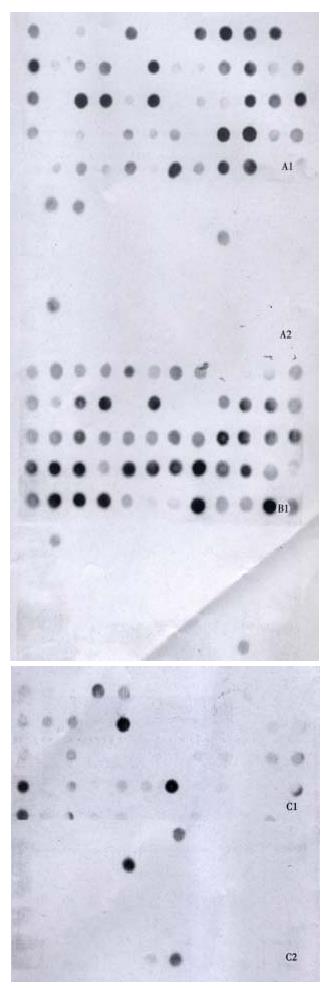
Figure 5 Differentially screening of clones using both forward (left) and backward (right) subtracted cDNA libraries.
A1: Subtracted A-N cDNA library; A2: Unsubtracted A cDNA library; B1: Subtracted T-A cDNA library; B2: Unsubtracted T cDNA library; C1: Subtracted T-N cDNA library; C2: Unsubtr acted T cDNA library.
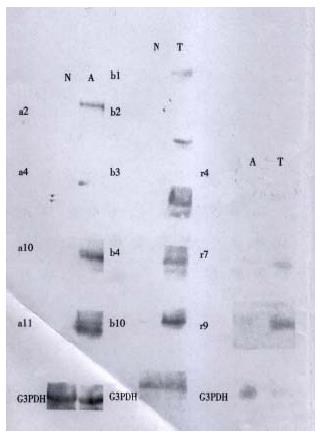
Figure 6 Virtual Northern Blot analysis of several differentia lly expressed cDNA: N: normal mucosa; A: adenoma; T: adenocarcinoma.
- Citation: Luo MJ, Lai MD. Identification of differentially expressed genes in normal mucosa, adenoma and adenocarcinoma of colon by SSH. World J Gastroenterol 2001; 7(5): 726-731
- URL: https://www.wjgnet.com/1007-9327/full/v7/i5/726.htm
- DOI: https://dx.doi.org/10.3748/wjg.v7.i5.726


