Copyright
©The Author(s) 2001.
World J Gastroenterol. Oct 15, 2001; 7(5): 647-651
Published online Oct 15, 2001. doi: 10.3748/wjg.v7.i5.647
Published online Oct 15, 2001. doi: 10.3748/wjg.v7.i5.647
Figure 1 Zymographic analyses.
Lane1: hypoxia group; Lane 2: control; Lane 3-5: hyperoxia group; Lane 6-8: control.
Figure 2 MMP-2 protein in HSC presented intense positive in hypoxia group.
LSAB (DAB), × 200
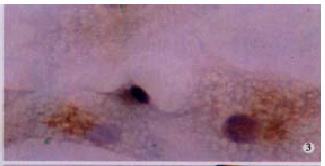
Figure 3 MMP-2 protein in HSC presented positive in hypoxia control.
LSAB (DAB), × 200
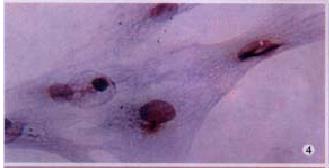
Figure 4 TIMP-2 protein in HSC presented weak positive in hypoxia group.
LSAB (DAB), × 200
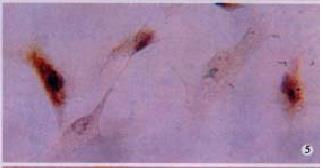
Figure 5 TIMP-2 protein in HSC presented intense positive in hypoxia control.
LSAB (DAB), × 200
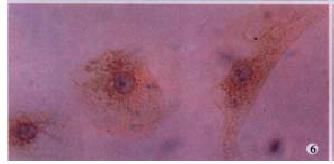
Figure 6 MT1-MMP protein in HSC presented positive in hyperoxia group.
LSAB (DAB), × 200
Figure 7 MT1-MMP protein in HSC presented weak positive in hyperoxia control.
LSAB (DAB), × 200
Figure 8 Signal of MMP-2 mRNA in HSC was intense in hypoxia for 6 h.
ISH (NBT/BCIP), × 400
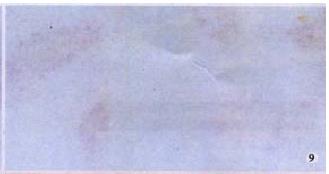
Figure 9 Signal of MMP-2 mRNA in HSC was weak in hypoxia for 12 h.
ISH (NBT/BCIP), × 400
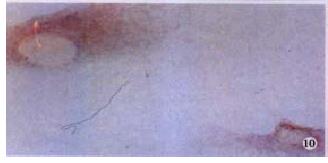
Figure 10 Signal of MMP-2 mRNA in HSC was intense in hypoxia for 24 h.
ISH (NBT/BCIP), × 400
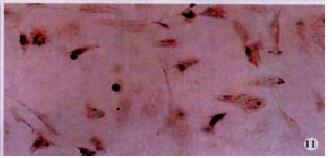
Figure 11 Signal of MT1-MMP mRNA in HSC was intense in hyperoxia group.
ISH (NBT/BCIP), × 100
- Citation: Chen PS, Zhai WR, Zhou XM, Zhang JS, Zhang YE, Ling YQ, Gu YH. Effects of hypoxia, hyperoxia on the regulation of expression and activity of matrix metalloproteinase-2 in hepatic stellate cells. World J Gastroenterol 2001; 7(5): 647-651
- URL: https://www.wjgnet.com/1007-9327/full/v7/i5/647.htm
- DOI: https://dx.doi.org/10.3748/wjg.v7.i5.647


