Copyright
©The Author(s) 2000.
World J Gastroenterol. Oct 15, 2000; 6(5): 766-769
Published online Oct 15, 2000. doi: 10.3748/wjg.v6.i5.766
Published online Oct 15, 2000. doi: 10.3748/wjg.v6.i5.766
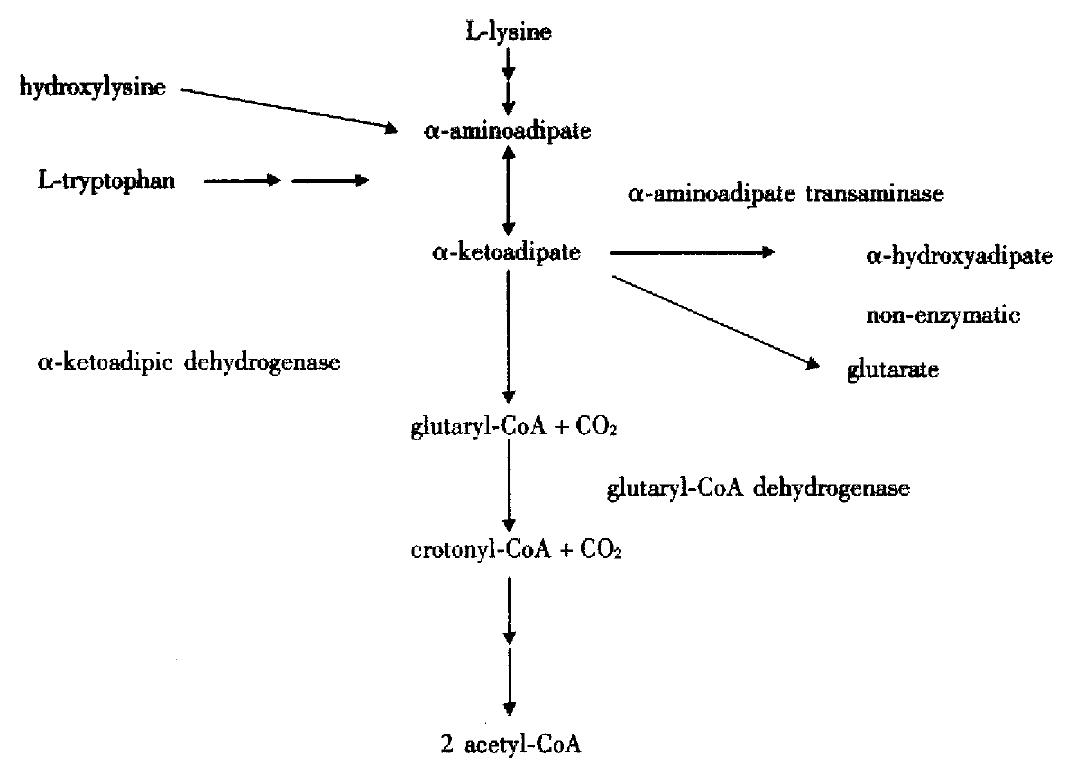
Figure 1 α-metabolic pathways of L-lysine, hydroxy-L-lysine and L-tryptophan leading to α-KA.
Figure 2 Total ion current (TIC) chromatogram of TMS derivatives of organic acids in urine from a patient with α-ketoadipic aciduria (case 1).
Peak identities are: 1, lactate-2TMS; 2, glycolate-2TMS; 3, urea-2TMS; 4, glutarate-2TMS; 5, 4-hydroxyphenylacetate-2TMS; 6, α-hydroxyadipate-2TMS; 7, α-ketoadipate-3TMS; 8, cis-aconitate-3TMS; 9, 3-hydroxymyristate-2TMS (IS); 10, heptadecanoate-TMS (IS). IS: added as an internal standard.
Figure 3 TIC chromatogram of TMS derivatives of metabolites in urine from a patient with α-ketoadipic aciduria (case 1).
Peak identities are: 1, phosphate-3TMS; 2, glutarate-2TMS; 3, erythritol-4TMS ; 4, α-hydroxyadipate-2TMS; 5, α-aminoadipate 3TMS; 6, histidine-3TMS; 7, gluconate-6TMS; 8, urate-4TMS; 9, heptadecanoate-TMS (IS). IS: added as an internal stardand.
- Citation: Xia ZW, Inoue Y, Ohse M, Shinka T, Kuhara T. A study on α-ketoadipic aciduria by gas chromatographic-mass spectrometry. World J Gastroenterol 2000; 6(5): 766-769
- URL: https://www.wjgnet.com/1007-9327/full/v6/i5/766.htm
- DOI: https://dx.doi.org/10.3748/wjg.v6.i5.766


