Copyright
©The Author(s) 2000.
World J Gastroenterol. Oct 15, 2000; 6(5): 664-670
Published online Oct 15, 2000. doi: 10.3748/wjg.v6.i5.664
Published online Oct 15, 2000. doi: 10.3748/wjg.v6.i5.664
Figure 1 SDS-PAGE and Western blot of Fas in three kinds of cell lines.
A: SDS-PAGE B: Western blot 1. Total protein (100 μg) extracted from pBK-SGC7901/VCR 2. Total protein (150 μg) extracted from pBK-SGC7901/VCR 3. Marker (Mr× 103) 4. Total protein (100 mg) extracted from fas-SGC7901/VCR 5. Total protein (150 mg) extracted from fas-SGC7901/VCR
Figure 2 Survival rates of three kinds of cells treated with chemotherapeutic drugs (%).
aP < 0.05, vs fas-SGC7901/VCR
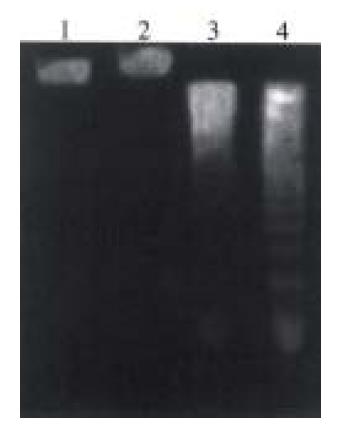
Figure 3 Agarose gel electrophoresis of apoptoctic cells DNA.
1, 2: pBK-SGC7901/VCR; 3, 4: fas-SGC7901/VCR; 1, 3: VM-26 (1.25 μmol/L); 2, 4: VM-26 (2.5 μmol/L)
Figure 4 Detection of P-gp expression in the 3 tumor cells lines by immunocytochemical staining.
× 400 A: pBK-SGC7901/VCR; B: SGC7901; C: fas-SGC7901/VCR
- Citation: Yin F, Shi YQ, Zhao WP, Xiao B, Miao JY, Fan DM. Suppression of P-gp induced multiple drug resistance in a drug resistant gastric cancer cell line by overexpression of Fas. World J Gastroenterol 2000; 6(5): 664-670
- URL: https://www.wjgnet.com/1007-9327/full/v6/i5/664.htm
- DOI: https://dx.doi.org/10.3748/wjg.v6.i5.664


