Copyright
©The Author(s) 2000.
World J Gastroenterol. Jun 15, 2000; 6(3): 430-432
Published online Jun 15, 2000. doi: 10.3748/wjg.v6.i3.430
Published online Jun 15, 2000. doi: 10.3748/wjg.v6.i3.430
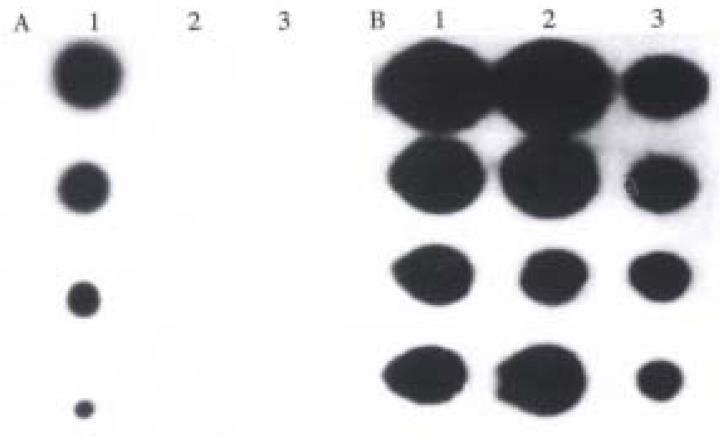
Figure 1 Blotting hybridization of hTR.
(A) Antisense hTR expression. (B) Sense hTR expression. (1) SGC7901 cells. (2) SGC7901 cells transduced with control vector (pBBS). (3) SGC7901 cells transduced with vector expressing antisense hTR (pBBS-hTR).
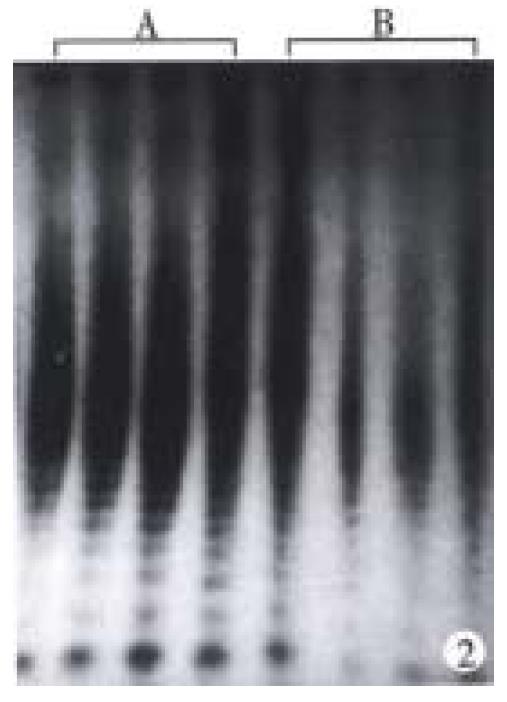
Figure 2 Telomerase activity of SGC7901 cells analyzed by TRAP.
(A) SGC7901 cells transduced with control vector (pBBS). (B) SGC7901 cells transduced with vector expressing antisense hTR (pBBS-hTR).
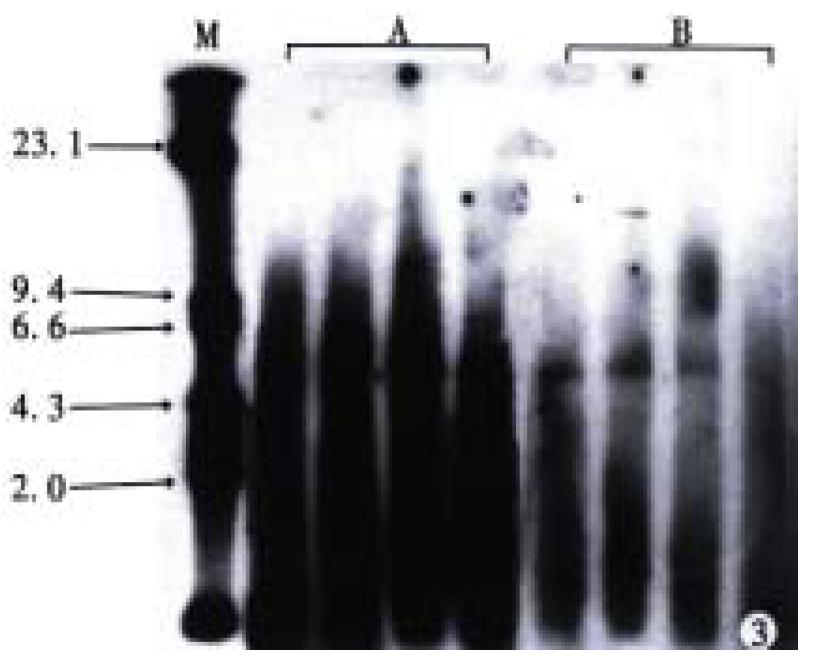
Figure 3 Telomeric lengths of SGC7901 cells analyzed by hybridization of nucleic acids directly in agarose gels.
(M) λ-DNA/Hind III Molecular Markers. (A) SGC7901 cells transduced with control vector (pBBS). (B) SGC7901 cells transduced with antisense hTR expressing vector (pBBS-hTR).
Figure 4 Cell cycle analyzed by flow cytometry.
(A) SGC7901 cells. (B) SGC7901 cells transduced with control vector (pBBS). (C) SGC7901 cells transduced with vector expressing antisense hTR (pBBS-hTR).
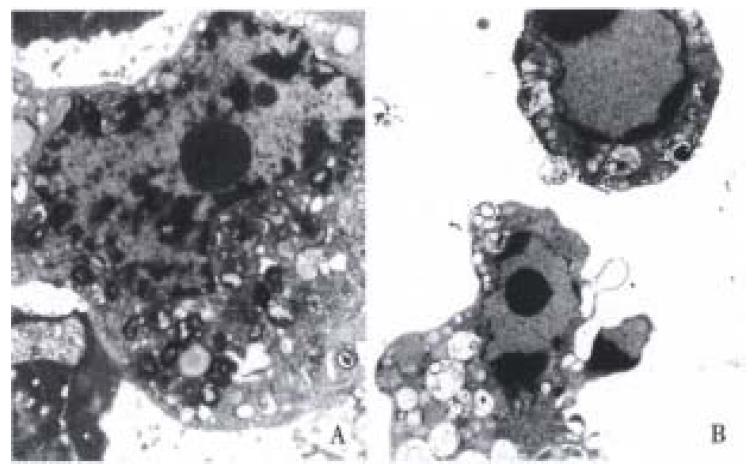
Figure 5 Ultrastructure observed under transmissive electron microscope.
(A) SGC7901 cells transduced with control vector (pBBS). (B) SGC7901 cells transduced with antisense hTR expressing vector (pBBS-hTR).
- Citation: Zhang FX, Zhang XY, Fan DM, Deng ZY, Yan Y, Wu HP, Fan JJ. Antisense telomerase RNA induced human gastric cancer cell apoptosis. World J Gastroenterol 2000; 6(3): 430-432
- URL: https://www.wjgnet.com/1007-9327/full/v6/i3/430.htm
- DOI: https://dx.doi.org/10.3748/wjg.v6.i3.430


